Abstract
Background:
Creatine kinase (CK) values are a critical part of the workup of suspected myopathies and are often assessed in patients that develop myalgia on statin therapy. CK elevations may influence the initiation and cessation of statin treatment, and incidentally discovered CK elevation may lead to further testing. A number of factors influence CK levels in healthy patients, but current reference ranges do not incorporate important influencers of CK such as race. Objectives of this study were to evaluate clinical factors associated with CK among healthy individuals and to develop practical reference ranges for important subgroups to improve test interpretation.
Methods:
CK was evaluated in nonpregnant participants ≥20 years old from the cross-sectional National Health and Nutrition Examination Survey (NHANES) 2011–2014. Linear and logistic regression stratified by sex identified clinical factors associated with CK levels. Adjustment for anthropomorphic measures assessed whether age and race-ethnicity differences in CK were explained by differences in body composition. The 95th and 97.5th percentiles of CK in sex/race-ethnicity subgroups were calculated, excluding patients with recent strenuous exercise.
Results:
A total of 10,096 nonpregnant adults were studied. Black race was strongly associated with CK. The odds ratio of having an abnormal CK for black women was 5.08 (95% CI 3.65–7.08) and for black men was 8.39 (95% CI 6.11–11.52). CK was substantially lower in older men. Differences in CK by age but not race-ethnicity were largely explained by body composition. Women with low body mass index were less likely to have an elevated CK, and overweight or obese men had an almost 2-fold greater odds of having an elevated CK. The 97.5th percentile of CK was 382 (95% CI 295–469) in white men, 1001 (95% CI 718–1284) in black men, 295 (95% CI 216–374) in white women, and 487 (95% CI 310–664) in black women.
Conclusion:
CK is substantially higher in men and in black patients. Differences in body size and composition are also important but do not explain racial differences in CK. The 95th and 97.5th percentiles in sex and race-ethnicity subgroups provide a practical guide for clinicians interpreting CK values.
Keywords: body composition, body mass index, CDC, Centers for Disease Control and Prevention, CK, creatine kinase, creatine phosphokinase, National Health and Nutrition Examination Survey, NHANES, race
1. Introduction
Creatine kinase (CK) measurement is an important initial test in the assessment of muscle damage, including workup of suspected myopathies. Additionally, current guidelines suggest that CK levels may be checked in patients on statins who develop symptoms to evaluate for muscle damage.[1] An elevated CK in this setting may often be a false positive, as true myopathy with statins is much less common than simple myalgias, and indeed in trials CK elevation occurs at similar rates in statin and placebo-treated patients.[2] Accurate interpretation of CK is critical, as elevated levels may lead to further workup even in the absence of symptoms, hesitancy to initiate statin therapy, or cessation of therapy even when symptoms are minimal. Understanding factors that influence CK and establishing more accurate reference ranges is essential for appropriate CK interpretation and physician decision-making.
Previous studies have shown that CK levels are higher in men and in black patients, and some have shown lower CK in older patients.[3–8] Whether age, sex, and race differences in CK levels are explained by differences in body composition and muscle mass is not clear. In addition, no large studies have comprehensively studied the clinical factors associated with differences in CK. Although sex-specific references ranges for CK are provided by some labs, reference ranges for other important subgroups, especially race-ethnicity subgroups, are not widely available. Greater confidence in the magnitude of the effect of race, especially black race, is paramount in order to promote greater awareness among physicians and promote accurate race-specific interpretation of CK values.
The objectives of this study were to confirm race-ethnicity associations with CK in a large U.S. population, determine to what degree differences in CK by race-ethnicity and age are explained by differences in body composition, and identify other clinical factors that may significantly affect CK. A specific goal was to provide ranges of CK for key subgroups to guide clinicians in interpreting CK results.
2. Methods
2.1. Study sample
The National Health and Nutrition Examination Survey (NHANES) is an ongoing program by the Centers for Disease Control and Prevention (CDC) and National Center for Health Statistics (NCHS), which interviews and examines a representative sample of the U.S. population. Measurement of creatine kinase (CK) began in 2011 and values are currently available for NHANES 2011–2014. NHANES uses a complex, multistage, probability-sampling design with oversampling of certain populations. Survey methods and data collection for the 2011–2014 survey have previously been described, and data is publically available.[9,10] The study protocol was approved by the University of Pennsylvania Institutional Review Board.
Included are participants from 2011–2014 NHANES, ≥ 20 years old, with a CK value available. Women with a positive pregnancy test or self-report of pregnancy were excluded. Self-reported race-ethnicity was divided into Hispanic, non-Hispanic white, non-Hispanic black, non-Hispanic Asian, and “other”—indicating other non-Hispanic race including non-Hispanic multiracial.
2.2. Measurement of CK and recent physical activity
CK was measured from refrigerated samples using an enzymatic rate method with a Beckman UniCel DxC800 Synchron with detailed quality control measures.[11] The reference range for this assay is 22 to 334 for men and 22 to 199 IU/L for women. An addition to the 2011–2014 NHANES survey to assist interpretation of CK was a questionnaire about recent physical activity, including the question “In the past 3 days, did you do any strenuous activity or heavy physical work.” If needed, this was clarified as “exercise or work that causes large increases in breathing or heart rate if they are done for at least 10 minutes continuously.” Values were considered missing if subjects refused to answer or did not know. This data is currently only available for 2011–2012.
2.3. Body composition measures
The body mass index (BMI), mid-upper arm circumference, and waist circumference were measured as described.[12] The addition of other anthropomorphic measures can better account for differences in muscle and fat composition than BMI alone. Waist circumference correlates with fat mass, and mid-upper arm circumference correlates more strongly with muscle mass.[13,14]
2.4. Comorbid conditions
Additional variables of interest were extracted from available questionnaire, examination, and laboratory data. Hypertension was defined as an average systolic blood pressure ≥140 or average diastolic blood pressure ≥90 or self-report that the subject is both prescribed medication of hypertension and is currently taking this medication.[15–17] Diabetes was hemoglobin A1c ≥6.5% or self-report of diabetes.[18] Smoking, current thyroid disease, and physical activity were based on self-report. Alcohol use was determined by multiplying the frequency of drinking by the quantity of drinking per episode.[19] Heavy drinking was defined as > 14 drinks/week for men and >7 drinks/week for women as defined in the 2010 Dietary Guidelines for Americans. The glomerular filtration rate (GFR) was calculated using the MDRD equation.[20] Cholesterol medication use was based on subject affirmation that medication had been prescribed and was currently being taken. In a sensitivity analysis, statin use was also determined for 2011–2012 based on prescription medications identified by the interviewer from prescription bottles or self-report if prescription bottles were not available.
2.5. Statistical analysis
Analysis was conducted using STATA 13.1 (StataCorp, 2015) accounting for NHANES sampling design using MEC weights, strata variables, and Taylor Series Linearization methods for variance estimation. Because it was highly skewed, CK was log transformed for regression analyses. Association of log(CK) with age, BMI, and GFR were nonlinear; these variables were categorized with improved model fit. Interaction terms for sex with age, race, and BMI were highly significant. Consequently, analyses were stratified by sex.
To evaluate whether the associations of CK with age and race-ethnicity were mediated by differences in body composition, linear regression models with age and race-ethnicity were compared to models with sequential adjustment for BMI, waist circumference, and arm circumference.
Multivariable linear and logistic regression was performed to assess independent associations with log(CK) and the odds of a CK above the assay reference range (334 IU/L for men, 199 IU/L for women). A-priori variables of interest were included in the final models. Backward elimination of covariates in subsequent models to select variables with P < 0.1 yielded similar associations. Because alcohol use and recent exercise data was only available for 2011–2012, chained, logistic multiple imputation accounting for survey sampling design was used to impute values for alcohol and recent exercise to avoid bias from missing data in these analyses.
Box plots were created by calculating percentiles accounting for frequency weights using the STATA pctile command, restricting the sample to NHANES 2011–2012 in subjects with no exercise in the past 3 days. Among this sample, estimated reference ranges were calculated as described in the Nordic Reference Interval Project (NORIP).[21] No outliers were identified qualitatively or using the Dixon range statistic.[7] Assessment of need for partitioning as previously described,[21,22] requiring groups size of at least 120, identified need to partition on race in men and women. Upper limit of normal was defined as the 97.5th percentile calculated with simple nonparametric methods using the STATA epctile command, accounting for weighting and sampling design. The 90th and 95th percentiles were similarly created. Because of the need to account for survey structure, confidence intervals were calculated based on standard errors.
3. Results
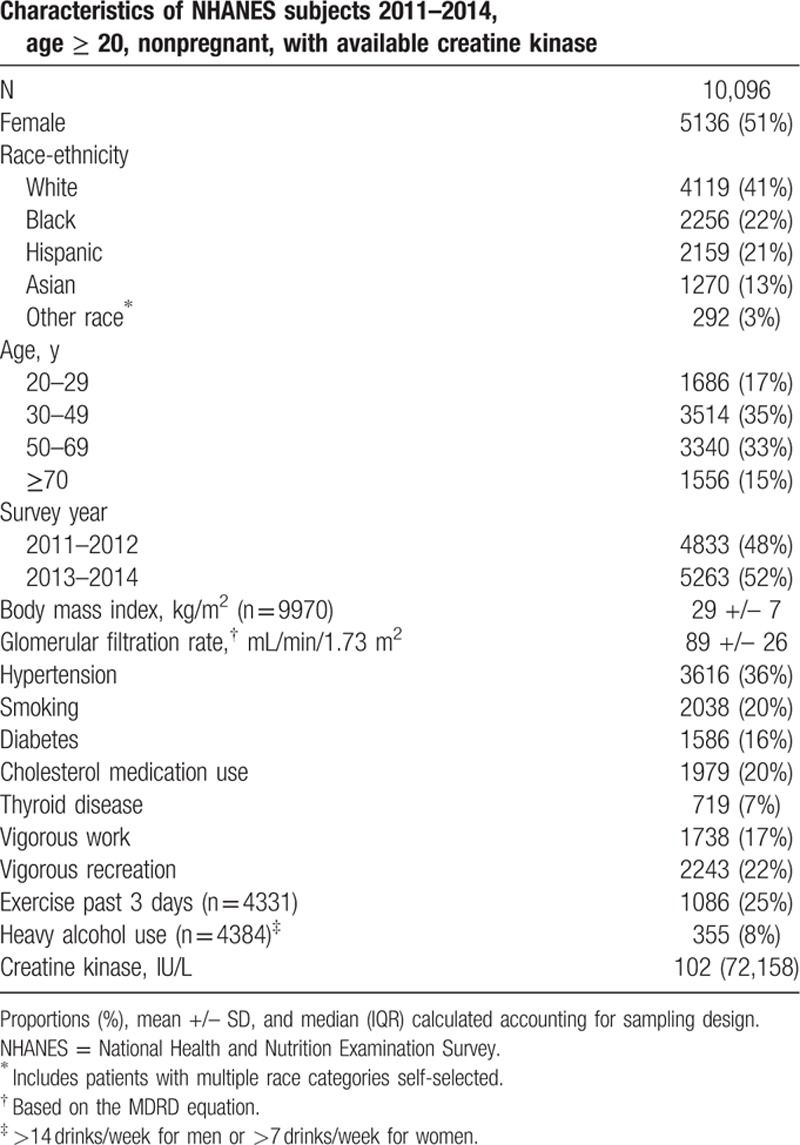
A total of 10,907 adults ≥20 years old were interviewed and examined in NHANES 2011–2014. CK was available in 10,203 adults and after exclusion of 107 pregnant women 10,096 subjects were included in further analysis, including 4119 non-Hispanic white, 2256 non-Hispanic black, 2159 Hispanic, and 1270 Asian subjects (Table 1).
Table 1.
Sample characteristics.
3.1. Impact of body composition on race and sex associations with CK
To evaluate the impact of body composition and muscle mass on associations between CK and race and between CK and age, multivariable linear regression models using log-transformed CK are shown separately in men and women (Table 2). Black men and women had significantly higher CK values than their white counterparts, although the magnitude of this association was larger in men (P for interaction < 0.001). Hispanic and Asian subjects had modestly higher CK values compared to white subjects. Lower CK levels were observed among individuals of older age. CK was lower in men 50 to 69 years old and lower among men and women ≥70. This association was of significantly greater magnitude among men (P for interaction < 0.001).
Table 2.
Multivariable linear regression models of log of creatine kinase assessing impact of body composition measures on age and race associations with creatine kinase.
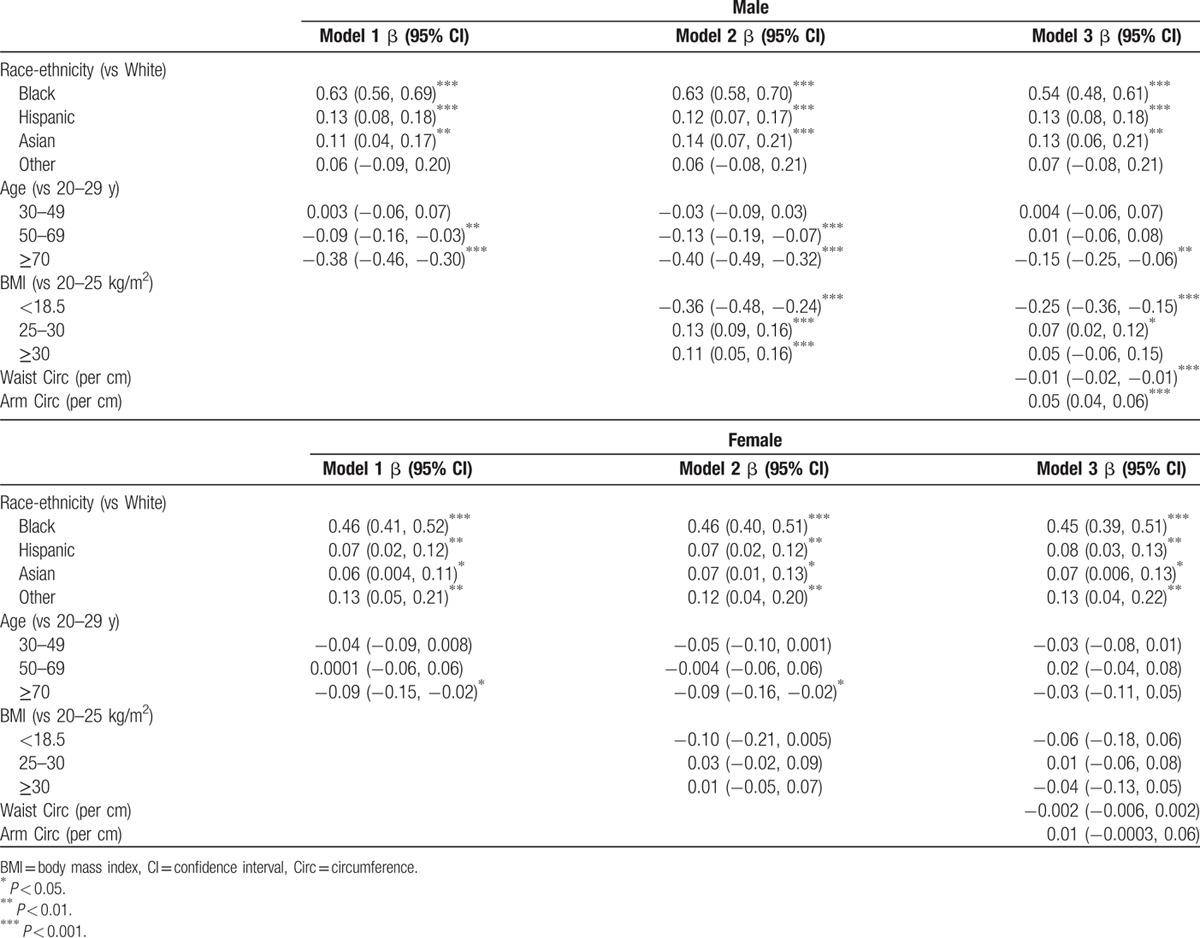
Adjustment for BMI in Model 2 (Table 2) had minimal impact on the race-ethnicity and age associations. Overweight and obese men had higher CK levels than men with normal BMI, and underweight men (BMI < 18.5) had substantially lower CK levels than men with normal BMI. BMI was not associated with CK levels among women (P = 0.01 for interaction).
Race-ethnicity associations with CK remained strong and of similar magnitude with the addition of mid-arm circumference (a correlate of muscle mass) and waist circumference (a correlate of abdominal fat mass) in Model 3. In contrast, the association between elderly age with low CK was attenuated by inclusion of these body composition measures. For men with similar BMI, greater arm circumference was associated with higher CK, whereas greater waist circumference was associated with lower CK. These associations were in the same direction in women but significantly weaker (P < 0.001 for sex interaction with arm and waist circumference) and not statistically significant.
3.2. Other clinical factors independently associated with CK
Associations between CK and several a-priori hypothesized factors were assessed in a multivariable model including smoking, diabetes, hypertension, thyroid disease, GFR, cholesterol medication use, alcohol use, exercise in the past 3 days, vigorous work, and vigorous recreation in a typical week in addition to age, race-ethnicity, and BMI (Table 3, full model not shown). Inclusion of these variables in multivariable models did not substantially change the associations of age, race-ethnicity, and BMI with CK shown in Table 2.
Table 3.
Multivariable linear regression of log of creatine kinase in men and women.
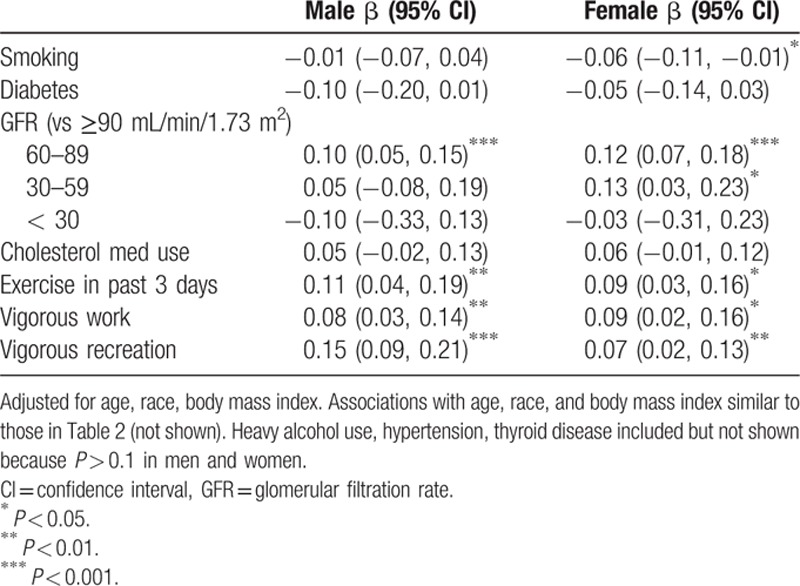
Exercise in the past 3 days as well as vigorous work and vigorous recreation performed in a typical week were associated with modestly higher CK in men and women. The associations identified were small in magnitude compared to the association between race-ethnicity and CK. Cholesterol lowering medication use, heavy alcohol use, hypertension, and thyroid disease were not associated with CK levels. Looking specifically at statin use based on the available prescription data for 2011–2012 did not change results; neither statin use nor self-reported hyperlipidemia was significantly associated with CK (data not shown). Stage 2 chronic kidney disease in men and stage 2 and 3 chronic kidney disease in women were associated with modestly greater CK. Few patients had stage 4 or 5 chronic kidney disease, limiting assessment.
3.3. Impact of demographics and clinical factors on risk of having an abnormal CK
Race-ethnicity was strongly associated with having an abnormal CK in men and women, with black women and black men having a 5-fold and 8-fold greater odds of having an elevated CK, respectively,—OR for black women: 5.08 (95% CI 3.65, 7.08), OR for black men: 8.39 (95% CI 6.11, 11.52) (Table 4). Although 5.6% of white males and 5.0% of white females had a CK above the upper limit of normal, 29.8% of black men and 19.3% of black women had a CK above the upper limit of normal.
Table 4.
Multivariable logistic regression of odds of having creatine kinase above the upper limit of normal (334 IU/L in males, 199 IU/L in females).
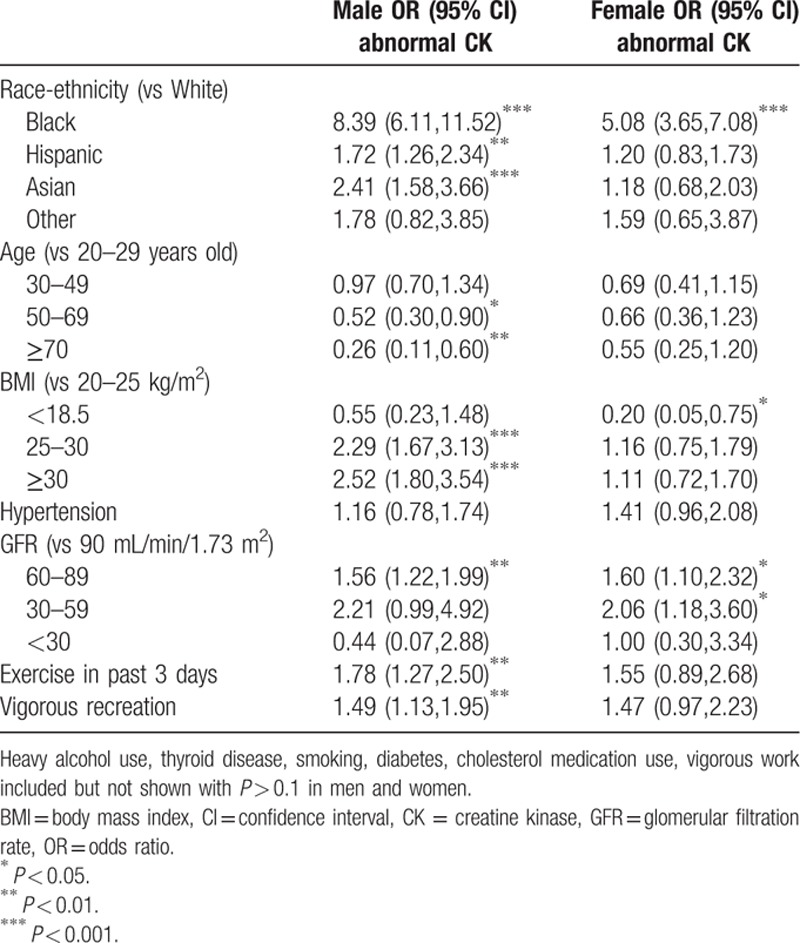
Older age, especially age ≥70 was associated with a substantially lower odds of having an elevated CK in men with OR 0.26 (95% CI 0.11, 0.60) (Table 4). Low BMI < 18.5 was associated with lower odds of having an elevated CK in women, and an overweight or obese BMI was associated with an almost 2-fold greater odds of elevated CK in men. Stage 2 and 3 CKD, exercise in the past 3 days, and vigorous exercise in a typical week were also associated with modest increases in the odds of having an elevated CK in men and women. Although CK was slightly lower in subjects who did not engage in moderate intensity recreation or who reported more minutes of sedentary activity, these subjects were not less likely to have an abnormal CK (data not shown).
CK was 3 times the upper limit of normal in 0.4% and 0.7% of white men and women, compared to 2.2% and 1.4% of black men and women. Multivariable model results were similar using this alternative threshold with adjusted OR for black men 5.97 (95% CI 2.22, 16.03) and black women OR 1.98 (95% CI 0.52, 7.48).
3.4. Sex and race-ethnicity specific CK values to guide reference ranges
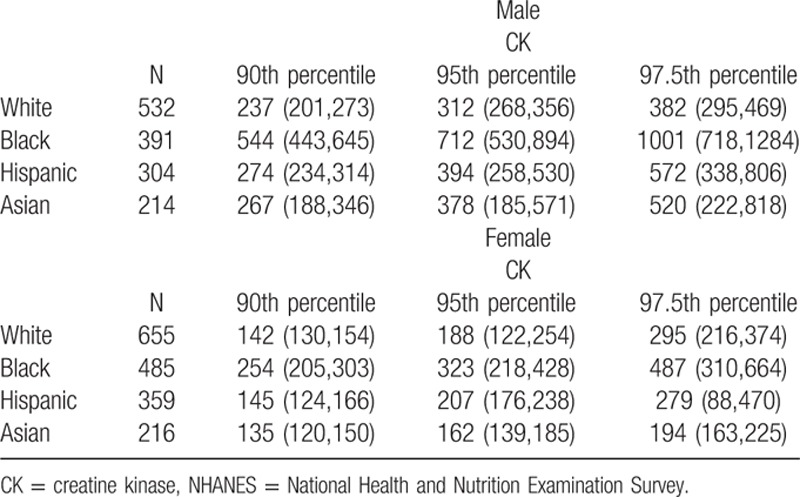
Because sex and race-ethnicity were the most important factors associated with CK and these subgroups met criteria for partitioning, CK values were evaluated in sex and race-ethnicity specific subgroups. Among 3156 subjects from 2011 to 2012 with no reported strenuous exercise in the past 3 days, CK was especially high among black men (Fig. 1). The estimated 97.5th percentile of CK for black men was 1001 IU/L (95% CI 718, 1284), more than twice that of white men—382 IU/L (95% CI 295, 469). The 97.5th percentile for black women was 487 (95% CI 310, 664) compared to 295 (216, 374) for white women. The 97.5th percentiles for Hispanic and Asian men and women were closer to those of white subjects. The 90th, 95th, and 97.5th percentiles are shown in Table 5.
Figure 1.
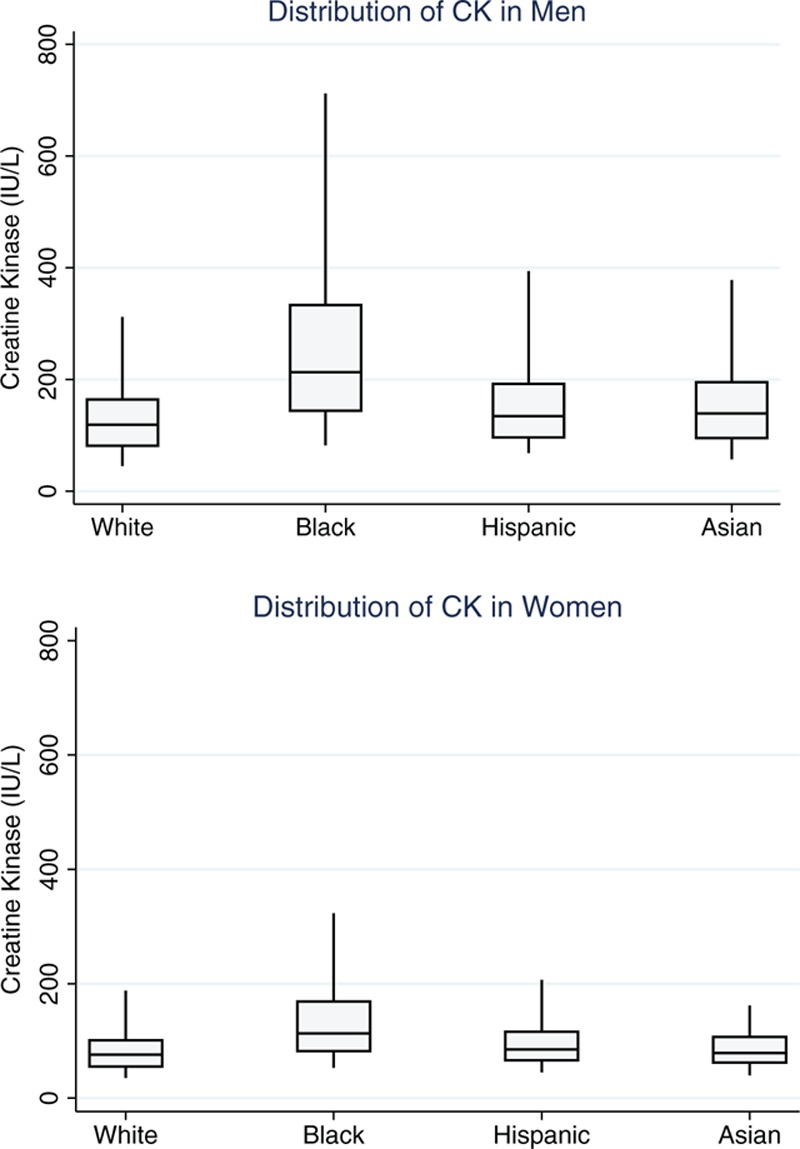
Box plots of creatine kinase values in nonpregnant subjects ≥20 years old with creatine kinase available and with no strenuous exercise in the past 3 days, NHANES 2011–2012 (n = 3156). Bars indicate 5th and 95th percentile. NHANES = National Health and Nutrition Examination Survey.
Table 5.
The 90th, 95th, 97.5th percentile creatine kinase for nonpregnant subjects ≥20 years old with creatine kinase available and with no strenuous exercise in the past 3 days, NHANES 2011–2012 (n = 3156).
Numbers were not sufficient to calculate age-specific reference ranges in most subgroups, although CK was lower in elderly men in all race-ethnic groups. The 97.5th percentile in the largest subgroup, white men >70 (n = 192), was 286 IU/L (95% CI 157, 415).
4. Discussion
This study evaluated CK levels in a large representative sample of the United States population, including a large number of patients across racial/ethnic groups. These data provide a better understanding of how race-ethnicity, age, body composition, and other clinical factors impact CK levels. The 97.5th and 95th percentiles presented provide guidance for nationally representative upper limits of normal to aid in the interpretation of CK in the clinical setting.
The most notable factor that contributed to higher CK levels was black race. Previous studies suggested that racial differences in CK may not be due to differences in height, weight, or body mass, but did not evaluate other body composition measures. This study evaluating BMI, waist circumference, and arm circumference, provides additional evidence that racial differences are not explained by differences in muscle mass. Higher CK levels among black individuals might instead be due to differential production or clearance of CK. Indeed, a small study found a 76% higher mean tissue CK activity in post-mortem tissue samples from black compared to white patients.[23]
In contrast, the decrease in CK with age may be largely explained by reduced muscle mass. Although adjustment for BMI alone did not explain the decrease in CK in elderly men, this association largely disappeared when waist and arm circumferences were included to better evaluate muscle mass.
Despite knowledge of racial differences in CK since the 1970s,[3] race-ethnicity-specific reference ranges are not widely available. The largest previous study examining data from 4 North American statin trials recommended such reference ranges but did not provide specific values.[8] Upper limits of normal based on the 97.5th percentiles were calculated in this study, excluding patients with recent exercise. Because the general population was studied rather than a confirmed healthy population, a small proportion of patients may have active muscle disease. The 95th percentile is also provided as a more conservative estimate of the upper limit of normal. Notably, the 95th percentiles for black men and women in this study (712 and 323 IU/L, respectively) are similar to 97.5th percentiles in smaller studies by Brewster (801 and 414 IU/L) and Wong (520 and 345 IU/L).[4,7] The specific values reported here may not be applicable to all assays but demonstrate the magnitude of differences between racial groups. Reference ranges should be validated in individual laboratories.
Alternative ranges are important when considering asymptomatic elevations in CK to reassure clinicians when suspicion for muscle disease is low. Some guidelines suggest discontinuing or avoiding statins if CK is 3 times the upper limit of normal.[1] This arbitrary cutoff may be appropriate in the setting of statins where true muscle pathology is quite rare and avoiding unnecessary statin discontinuation is important. This higher threshold does not account for individual contributors to CK, however, and may be too sensitive for some populations and not sensitive enough for others. Indeed black men were more likely to have CK more than 3 times the upper limit of normal. Notably, using a cutoff of 3 times the upper limit of normal may not be appropriate with race-specific reference ranges.
Other clinical factors are modestly associated with CK. Although numbers were not sufficient to calculate age-specific reference ranges, elderly age in men was associated with a substantially lower CK. Low BMI and smaller arm circumference were also associated with lower CK in men; among patients with low muscle mass, a normal CK is not necessarily reassuring if muscle disease is suspected clinically. Similarly, in an asymptomatic patient with substantial muscle mass, a modest elevation in CK may be of less concern. Recent strenuous exercise was associated with almost twice the odds of having an abnormal CK. Counseling patients to avoid strenuous activity in the 3 days prior to CK measurement is likely to allow more accurate interpretation of results.
There are several limitations worth noting. Although laboratory studies and body composition measures were directly measured, some comorbidities were self-reported. Recent strenuous activity was also self-reported, although the high frequency (25%) suggests, if anything, over-reporting of activity. It was not possible to further evaluate patients with an elevated CK. Because some patients may have muscle disease that was not recorded in NHANES, the 95th percentile is also provided as a more conservative estimate of the upper limit of normal. Patients with thyroid disease, cholesterol medication use and heavy alcohol use were not excluded as these variables were not associated with CK levels. Exclusion of these patients did not substantially change percentile estimates.
In conclusion, CK levels are impacted by many clinical factors, most importantly sex and race-ethnicity. Decreases in muscle mass with age may explain lower CK in elderly patients, especially men. Differences in CK by race-ethnicity, however, are unlikely to be explained by muscle mass differences. Use of sex and race-ethnicity specific reference-ranges is critical to more accurately interpret CK values.
Footnotes
Abbreviations: CK = creatine kinase, NHANES = National Health and Nutrition Examination Survey, GFR = glomerular filtration rate, BMI = body mass index, CKD = chronic kidney disease, CDC = Centers for Disease Control and Prevention, NCHS = National Center for Health Statistics.
Funding: Dr. George is funded by an NIH T32 training grant (5T32AR007442-28). Dr. Baker is funded by a Veterans Affairs Clinical Science Research & Development Career Development Award (IK2 CX000955). The contents of this work do not represent the views of the Department of the Veterans Affairs or the United States Government.
The authors have no conflicts of interest to disclose.
References
- 1.Stone NJ, Robinson JG, Lichtenstein AH, et al. 2013 ACC/AHA guideline on the treatment of blood cholesterol to reduce atherosclerotic cardiovascular risk in adults: a report of the American College of Cardiology/American Heart Association Task Force on Practice Guidelines. J Am Coll Cardiol 2014; 63 (25 Pt B):2889–2934. [DOI] [PubMed] [Google Scholar]
- 2.Ganga HV, Slim HB, Thompson PD. A systematic review of statin-induced muscle problems in clinical trials. Am Heart J 2014; 168:6–15. [DOI] [PubMed] [Google Scholar]
- 3.Meltzer HY. Factors affecting serum creatine phosphokinase levels in the general population: the role of race, activity and age. Clin Chim Acta Int J Clin Chem 1971; 33:165–172. [DOI] [PubMed] [Google Scholar]
- 4.Wong ET, Cobb C, Umehara MK, et al. Heterogeneity of serum creatine kinase activity among racial and gender groups of the population. Am J Clin Pathol 1983; 79:582–586. [DOI] [PubMed] [Google Scholar]
- 5.Black HR, Quallich H, Gareleck CB. Racial differences in serum creatine kinase levels. Am J Med 1986; 81:479–487. [DOI] [PubMed] [Google Scholar]
- 6.Gledhill RF, van Niekerk MM, van der Merwe CA. Racial differences in serum creatine kinase levels. Am J Med 1987; 83:365–366. [DOI] [PubMed] [Google Scholar]
- 7.Brewster LM, Mairuhu G, Sturk A, et al. Distribution of creatine kinase in the general population: implications for statin therapy. Am Heart J 2007; 154:655–661. [DOI] [PubMed] [Google Scholar]
- 8.Neal RC, Ferdinand KC, Ycas J, et al. Relationship of ethnic origin, gender, and age to blood creatine kinase levels. Am J Med 2009; 122:73–78. [DOI] [PubMed] [Google Scholar]
- 9.Johnson CL, Dohrmann SM, Burt VL, Mohadjer LK. National Health and Nutrition Examination Survey: Sample design, 2011–2014. Vital and Health Statistics. 2014; 2(162):1-33. http://www.cdc.gov/nchs/data/series/sr_02/sr02_162.pdf Accessed January 27, 2015. [PubMed] [Google Scholar]
- 10.Centers for Disease Control and Prevention (CDC). National Center for Health Statistics (NCHS). National Health and Nutrition Examination Survey Data. Hyattsville, MD: U.S. Department of Health and Human Services, Centers for Disease Control and Prevention, 2011–2014. http://www.cdc.gov/nchs/nhanes/nhanes_questionnaires.htm Accessed January 27, 2015. [Google Scholar]
- 11.Centers for Disease Control and Prevention (CDC). National Center for Health Statistics (NCHS). National Health and Nutrition Examination Survey Laboratory Protocol. Hyattsville, MD: U.S. Department of Health and Human Services, Centers for Disease Control and Prevention, 2011–2014. http://www.cdc.gov/nchs/data/nhanes/nhanes_11_12/biopro_g_met_creatine_kinase.pdf Accessed January 27, 2015. [Google Scholar]
- 12.Centers for Disease Control and Prevention (CDC). National Center for Health Statistics (NCHS). National Health and Nutrition Examination Survey Anthropometry Procedures Manual. Hyattsville, MD: U.S. Department of Health and Human Services, Centers for Disease Control and Prevention, 2011–2014. http://www.cdc.gov/nchs/data/nhanes/nhanes_11_12/Anthropometry_Procedures_Manual.pdf Accessed January 27, 2015. [Google Scholar]
- 13.Clasey JL, Bouchard C, Teates CD, et al. The use of anthropometric and dual-energy X-ray absorptiometry (DXA) measures to estimate total abdominal and abdominal visceral fat in men and women. Obes Res 1999; 7:256–264. [DOI] [PubMed] [Google Scholar]
- 14.Kwon HR, Han KA, Ahn HJ, et al. The correlations between extremity circumferences with total and regional amounts of skeletal muscle and muscle strength in obese women with type 2 diabetes. Diabetes Metab J 2011; 35:374–383. [DOI] [PMC free article] [PubMed] [Google Scholar]
- 15.Yoon SS, Burt V, Louis T, Carroll MD. Hypertension among adults in the United States, 2009–2010. NCHS data brief, no 107. Hyattsville, MD: National Center for Health Statistics; 2012. [PubMed] [Google Scholar]
- 16.Nwankwo T, Yoon SS, Burt V, Gu Q. Hypertension among adults in the United States: National Health and Nutrition Examination Survey, 2011–2012. NCHS data brief, no 133. Hyattsville, MD: National Center for Health Statistics; 2013. [PubMed] [Google Scholar]
- 17.Fryar CD, Hirsch R, Eberhardt MS, Yoon SS, Wright JD. Hypertension, high serum total cholesterol, and diabetes: Racial and ethnic prevalence differences in U.S. adults, 1999–2006. NCHS data brief, no 36. Hyattsville, MD: National Center for Health Statistics; 2010. [PubMed] [Google Scholar]
- 18.Cowie CC, Rust KF, Byrd-Holt DD, et al. Prevalence of diabetes and impaired fasting glucose in adults in the U.S. population: National Health And Nutrition Examination Survey 1999–2002. Diabetes Care 2006; 29:1263–1268. [DOI] [PubMed] [Google Scholar]
- 19.Breslow RA, Guenther PM, Juan W, et al. Alcoholic beverage consumption, nutrient intakes, and diet quality in the US adult population, 1999–2006. J Am Diet Assoc 2010; 110:551–562. [DOI] [PMC free article] [PubMed] [Google Scholar]
- 20.Levey AS, Bosch JP, Lewis JB, et al. A more accurate method to estimate glomerular filtration rate from serum creatinine: a new prediction equation. Modification of Diet in Renal Disease Study Group. Ann Intern Med 1999; 130:461–470. [DOI] [PubMed] [Google Scholar]
- 21.Rustad P, Felding P, Lahti A, et al. Descriptive analytical data and consequences for calculation of common reference intervals in the Nordic Reference Interval Project 2000. Scand J Clin Lab Invest 2004; 64:343–370. [DOI] [PubMed] [Google Scholar]
- 22.Lahti A, Hyltoft Petersen P, Boyd JC, et al. Objective criteria for partitioning Gaussian-distributed reference values into subgroups. Clin Chem 2002; 48:338–352. [PubMed] [Google Scholar]
- 23.Brewster LM, Coronel CMD, Sluiter W, et al. Ethnic differences in tissue creatine kinase activity: an observational study. PLoS One 2012; 7:e32471. [DOI] [PMC free article] [PubMed] [Google Scholar]


