

Supplemental Digital Content is available in the text
Keywords: biomarker, disease marker, growth factor, neurotrophic factor, oxidative stress
Abstract
Background:
In vivo and in vitro studies demonstrate the important roles of fibroblast growth factor (FGF) and FGF receptors (FGFRs) in neural survival, neurogenesis, oxidative stress, and emotional behavior. However, evidence on the role of FGF and FGFR in the pathophysiology of major depressive disorder (MDD) remains limited and inconclusive.
Objectives:
This preliminary meta-analysis aimed to examine changes in peripheral or central FGF and FGFR levels in patients with MDD.
Data sources:
Electronic research through platform of PubMed and ClinicalTrials.gov.
Study eligibility criteria, participants, and interventions:
We used the inclusion criteria: articles discussing the comparisons of FGF levels, either in peripheral or central environment, in patients with MDD and in healthy controls (HC); articles on clinical trials in humans; and case–control trials. Case reports or series and nonclinical trials were excluded.
Study appraisal and synthesis methods:
Using a thorough literature search, the FGF/FGFR levels in patients with MDD and HC were compared. Four studies on peripheral FGF-2 and 3 on central FGF-2 and FGFR1 levels were included.
Results:
The findings reveal significantly higher peripheral FGF-2 protein and central FGFR1 RNA levels in patients with MDD than in HC (P = 0.005 and 0.006, separately), but no significant association with clinical variables. There was also no significant difference in the central FGF-2 levels in patients with MDD and in HC (P = 0.180).
Limitation:
The study has limitations of a small number of included studies, lack of meta-analysis of the FGF changes along with treatment, and lack of direct evidence on correlation of peripheral FGF-2 with central FGF-2 levels.
Conclusions and implications of key findings:
This preliminary meta-analysis points out a new direction for future studies investigating the relationship among MDD, oxidative stress, and the FGF family.
1. Introduction
Major depressive disorder (MDD) contributes to a significant socioeconomic burden across the world.[1–3] Little is known about the pathophysiology of major affective disorders. Evidence suggests neurodegeneration, dysfunction of neurotrophic factors, and oxidative stress are a part of the pathophysiology of MDD.[4–6] Nevertheless, there has been no definitive or conclusive mechanism found.
The fibroblast growth factor (FGF) family has been found for decades. However, the role of the FGF family in neural function has not been explored until the 1990s.[7–9] Some have presented benefits in neural proliferation (e.g., FGF-2),[10] maturation and maintenance of neuron cells (FGF-1),[11] and neuronal excitability (FGF-14),[12] among others.[13] FGF receptors (FGFRs) also play important roles in neural function. For example, FGFR1 helps with neural proliferation and long-term potentiation in the hippocampus.[14] FGFR2 has important functions in neurogenesis and learning in the hippocampus.[15]
However, most of these extensive investigations are animal studies. Furthermore, the roles of FGF and FGFR in the pathophysiology of MDD, one of the disorders with neurodegeneration, remain unclear. To date, few literatures have attempted to investigate the roles and changes in FGF or FGFR among patients with MDD, and the results are inconsistent. In the report by Lu et al,[16] there is significantly higher peripheral FGF-2 in patients with MDD than in healthy controls (HC). However, contradictory findings are reported by He et al,[17] with significantly lower FGF-2 in patients with MDD than in HC. In earlier reports, differences in FGF-2 between patients with MDD and HC are insignificant.[18,19]
Inconsistent findings exist in studies about not only peripheral FGF levels but also the central nervous system (CNS). In an earlier report, FGF-2 levels in the postmortem brain of patients with MDD are significantly lower than those in the postmortem brain of HC, but without significant difference in FGFR1 levels between the 2 groups.[20] In a newer study by Goswami et al,[21] there is only significant difference in the comparison of FGFR1 levels, not with FGF-2 levels, in the postmortem brains of patients with MDD and of HC. Such inconsistencies may be due to different sample sources (e.g., serum vs plasma and prefrontal cortex vs anterior cingulated gyrus [AnCG]), different ages, or different subject resources.
A recent review article by Turner et al[13] tries to summarize current evidence of FGF functions in the pathophysiology of MDD. However, most of the studies used in this review article are animal or in vitro studies rather than human ones. Fortunately, in recent years, there have been some newer clinical reports regarding FGF levels in MDD.[16,17,21]
The present study aimed to update current evidence on changes in the FGF and FGFR family in patients with MDD, and to investigate such changes before and after treatment.
2. Materials and methods
2.1. Literature search and screening
The current research strategy and protocol of meta-analysis (MA) followed Meta-analysis Of Observational Studies in Epidemiology (MOOSE) guidelines[22] and was adapted from recent MA reports.[4,5] The target included literatures about any observational studies or related trials about the FGF levels in patients with MDD. In the initial stage, 2 independent psychiatrists performed a systematic literature search in the electronic databases of PubMed, ScienceDirect Online, and ClinicalTrials.gov. After the initial screening, these 2 authors cross-checked the screening results. In cases of inconsistent selection and lack of agreement, a final decision was attained through consensus. The keywords of “(FGF OR fibroblast growth factor) AND (depression OR mood disorder)” were used in the search process, which was limited to articles written in English and was conducted on April 8, 2016. Literatures published in languages other than English were excluded at this stage. Initially, 2 authors screened the titles and abstracts. Reports not related to FGF in patients with MDD were excluded. Furthermore, the 2 independent psychiatrists manually inspected the reference lists in the recruited literatures to expand the number of the included literatures.
The remaining studies were then examined using the inclusion criteria: articles discussing the comparisons of FGF levels, in the forms of either peripheral protein or messenger ribonucleic acid/protein in CNS, in patients with MDD and in HC; articles on clinical trials in humans; and case–control trials. Case reports or series and nonclinical trials were excluded. Furthermore, to achieve high-quality recruited studies, the studies which did not fulfill the followed criteria would be excluded: providing information about the FGF levels in both patients and control subjects. To evaluate the quality of the clinical trials, Jadad scale were used in the MA.[23]
The primary outcome was FGF concentration in the peripheral environment or in the CNS. All primary outcomes and clinical variables in the studies were extracted. If data were unavailable, the authors were contacted for the original data. The entire screening process is shown in Fig. 1.
Figure 1.
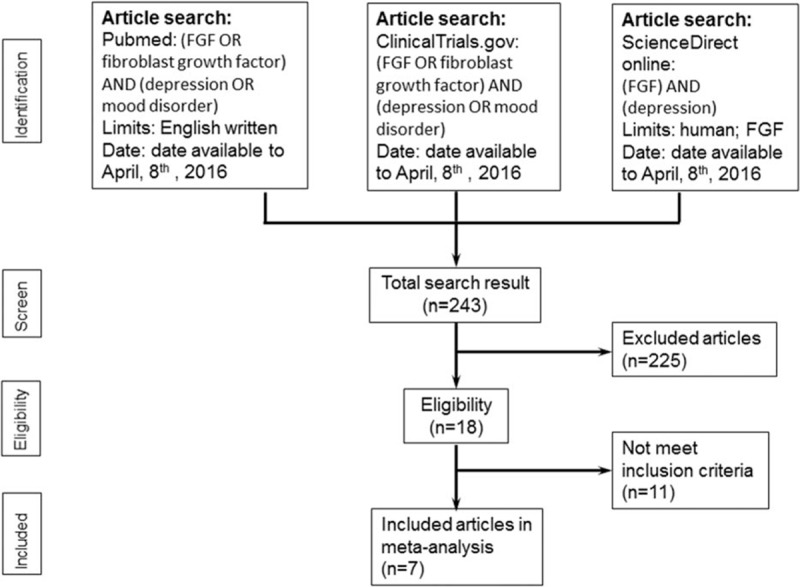
Flowchart of the selection strategy and inclusion/exclusion criteria for current meta-analysis.
There was no need for ethical approval for this study because we did not use detailed personal data of any patient.
2.2. Methods of MA and data extraction
The effect size (ES) was defined as the difference in peripheral or CNS FGF levels between patients with MDD and HC. The ES was set as the standardized mean difference based on Hedges adjusted g, which was defined as ES > 0, signifying “higher FGF levels in patients with MDD than in HC.” In case of absent actual FGF levels in the literature or no response from the authors, the ES was derived from other statistical parameters such as the t or P values, with the sample size. All of the ES were treated with a random-effects model in every MA.
All of the MA procedures were performed using the Comprehensive Meta-Analysis software, version 2 (Biostat, Englewood, NJ). Statistical significance was set at a 2-tailed P < 0.05. Heterogeneity within the recruited studies was examined via Q statistics, related P values, and I2 statistics. Publication bias was evaluated by visual examination of funnel plots and through Egger regression analysis.[24]
Subgroup MA and meta-regression were performed to evaluate the possible confounding effects of clinical variables. Meta-regression was performed through the unrestricted maximum likelihood method. The clinical variables for meta-regression were mean age, sex, body mass index, duration of illness, age at disease onset, disease severity, brain tissue pH, and postmortem interval.
3. Results
3.1. Studies included in each MA
A total of 18 articles were screened, including 2 that focused on genetic polymorphism rather than FGF concentration[25,26] and 6 that were review articles.[13,27–31] There was 1 article on the concentration of FGF in patients with BD,[32] 1 article discussing the concentration of FGFR3 in postmortem brains,[33] and 1 discussing FGF-23 levels in acute depression.[34] Hence, MA could not be performed on such topics.
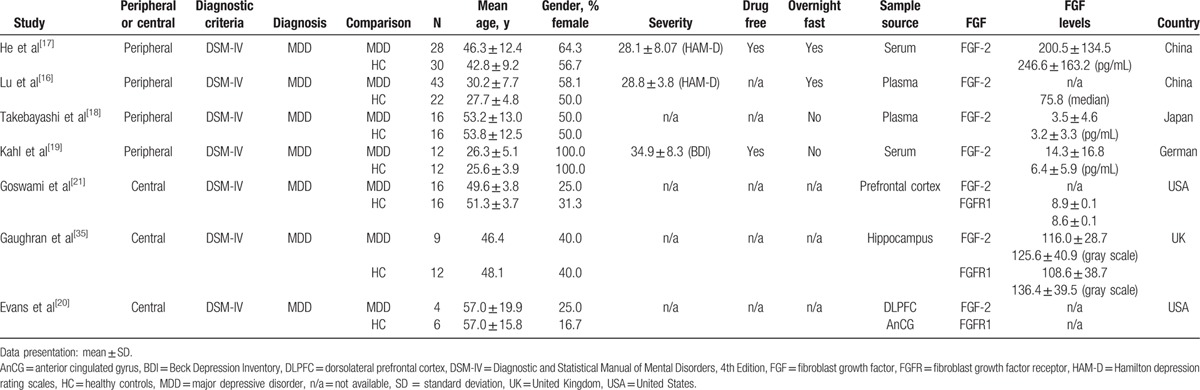
The 7 remaining studies were entered into the MA procedure (Table 1).[16–21,35] These included 4 articles providing peripheral FGF levels in patients with MDD and in HC,[16–19] and 3 articles on the FGF levels in the CNS of patients with MDD and HC.[20,21,35] For the quality of the clinical trials, the average Jadad score was 1.0 (Supplemental Table 1). For information about the MOOSE guideline checklist, please refer to Supplemental Table 2.
Table 1.
Summary of characteristics of studies in current meta-analysis.
3.2. MA of peripheral FGF levels in patients with MDD
The 4 studies that compared different levels of peripheral FGF included 99 patients with MDD and 80 HC. The detected FGF samples were FGF-2 proteins. The peripheral FGF-2 proteins were significantly higher in patients with MDD than in HC (ES: 0.43; 95% confidence interval (CI): 0.13–0.73; P = 0.005) (Fig. 2A). There was no significant heterogeneity within these studies (Q = 2.42; df = 3; I2 = 0.00%; P = 0.491). There was no potential publication bias detected using visual examination of the funnel plot (Fig. 3). The Egger test could not be performed to detect possible publication bias because of the small number of recruited studies.[24,36] About the methods of determining peripheral FGF levels used in each included studies, 3 used method of enzyme-linked immunosorbent assay[17–19] and the other 1 used protein antibody array methodology.[16] However, there had not been consensus about which one provide better specific rate/sensitivity rate than the other one.
Figure 2.
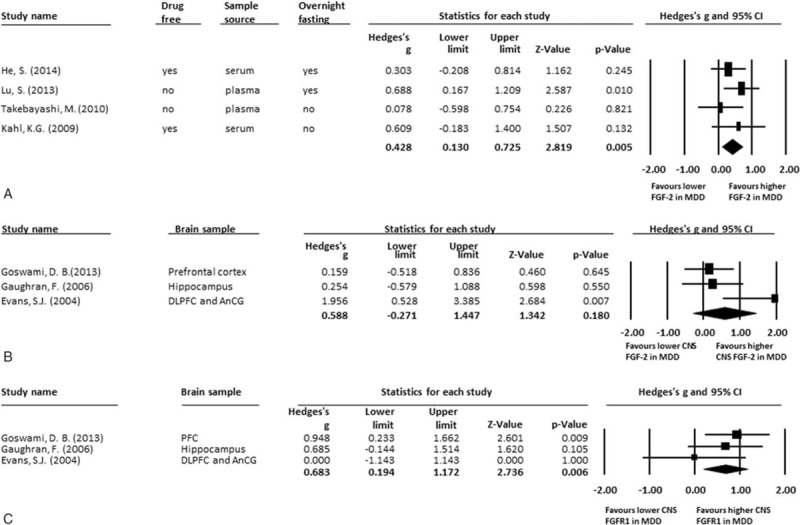
(A) MA of comparisons of peripheral FGF-2 in patients with MDD and HC; (B) MA of comparisons of CNS FGF-2 levels in patients with MDD and HC; (C) MA of comparisons of CNS FGFR1 levels in patients with MDD and HC. (A) The peripheral FGF-2 levels were significantly higher in patients group than HC group (P = 0.005). (B) There was no any significant difference in CNS FGF-2 levels in patients group and HC (P = 0.180). (C) There were significantly higher CNS FGFR1 levels in patients group than those in HC (P = 0.006). CNS = central nervous system, FGF = fibroblast growth factor, FGFR = fibroblast growth factor receptor, HC = healthy controls, MA = meta-analysis, MDD = major depressive disorder.
Figure 3.
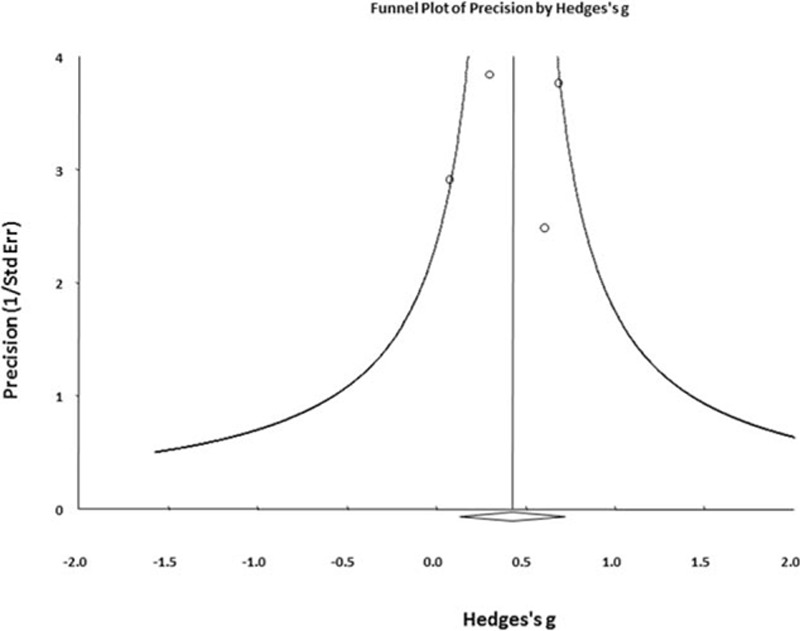
Funnel plot of comparisons of peripheral FGF-2 in patients with MDD and HC in current meta-analysis by Hedges g. FGF-2 = fibroblast growth factor-2, HC = health controls, MDD = major depressive disorder.
The meta-regression could only be performed in clinical variables of mean age and sex (female) proportion because of a lack of data. The results revealed no statistically significant associations between peripheral FGF-2 levels and mean age or sex (female) proportion (P = 0.128 and 0.587, respectively).
For subgroup MA, the studies were grouped according to the criteria of “drug-free or not,” “different sample source,” or “overnight fasting before sample collection.” However, after subgrouping, there were <3 studies per subgroup, so subgroup MA was not performed.
Among the included studies, only 1 report discussed changes in peripheral FGF-2 proteins in patients with MDD before and after treatment.[17] In that report, the peripheral FGF-2 proteins in patients with MDD were significantly decreased after treatment. However, further MA of changes in the pre- and post-treatment peripheral FGF-2 protein levels was not performed.
3.3. MA of central FGF levels in patients with MDD
The 3 studies that compared different levels of FGF in the CNS included 31 patients with MDD and 33 HC. Our analysis found that there were significantly higher central FGFR1 RNA levels in patients with MDD than those in HC (ES: 0.68; 95% CI: 0.19–1.17; P = 0.006; Fig. 2C), but no significant difference in central FGF-2 RNA (ES: 0.59; 95% CI: −0.27 to 1.45; P = 0.180; Fig. 2B). About the methods of determining the central FGF levels used in each included studies, they were diversity in each studies, including NanoString assay[21] or Microarray Data Analysis.[20] Therefore, it was difficult to perform further subgroup MA to compare the difference of central FGF levels using different methods.
In the reports, the FGF-2 and FGFR1 were extracted from distinct parts of the cerebellum, including the prefrontal cortex,[21] dorsolateral prefrontal cortex,[20] hippocampus,[35] and AnCG.[20] Due to the small number of cases, subgroup MA of the different parts of the cerebrum was not performed.
4. Discussion
The main findings of the preliminary MA indicate that peripheral FGF-2 proteins and central FGFR1 RNA are significantly higher in patients with MDD than in HC. However, there is no statistically significant difference in the FGF-2 RNA levels between patients with MDD and HC.
In reviews by van Scheltinga et al[28] and Turner et al,[31] the authors summarize current evidence of the FGF family in the pathophysiology of affective disorder. However, the evidence recruited in these articles is mostly from animal studies rather than human studies. This may be due to the limited published literature on human studies.[18–20,35] In recent years, there have been some newer articles regarding FGF levels in human studies.[16,17,21] Based on the newer evidence, the present study performed further MA of the difference in FGF between patients with MDD and HC, either in the peripheral environment or in the CNS.
At first, without significant heterogeneity, there are significantly higher FGF-2 proteins and FGFR1 RNA levels in patients with MDD than in HC, without significant association with mean age and sex. This finding is surprising under the current hypothesis of the neurotrophic factor's role in the pathophysiology of MDD, such as nerve growth factor (NGF)[5] or glial cell line-derived neurotrophic factor (GDNF).[6] In theory, decreased neurotrophic factors or growth factors in patients with MDD are responsible for the pathophysiology of MDD. On the other hand, the roles of FGF-2 (also known as basic FGF), including those in angiogenesis[11] and neurogenesis,[7,31,37] may be similar to another angiogenesis factor, the vascular endothelial growth factor (VEGF). In fact, changes in VEGF among patients with MDD are similar to those of FGF-2, which is significantly increased in patients with MDD compared with HC.[4] Thus, changes in FGF-2 may share a similar pathophysiology to changes in VEGF among patients with MDD.
There is evidence proving the benefit of FGF-2 in the blood–brain barrier (BBB) integrity[38,39] and in helping cell survival under oxidative stress by attenuating endoplasmic reticulum stress and mitochondrial injury.[40,41] In addition, MDD is believed to be a neurodegenerative disease with a possible etiology of inflammation and increased oxidative stress,[4,42] which may induce BBB dysfunction and cell apoptosis.[43,44] Increased peripheral FGF-2 proteins may therefore be the consequence of the compensating effect of FGF-2, which increases to counter the increased oxidative stress and BBB dysfunction in MDD. This hypothesis can be indirectly explained by the phenomenon found in another study in which peripheral FGF-2 levels in patients with MDD are significantly decreased after treatment.[17] Although the aforementioned hypothesis cannot be proven by the current MA, this suggests a new direction for future studies.
The roles of FGFR1 have been found in aspects of neurogenesis,[45] memory consolidation,[14] and affective disorders.[13] However, in the current MA, the central FGFR1 RNA levels were significantly higher in patients with MDD. Although the expression of FGFR1 would alter with the sites of the brain samples, including the hippocampus, prefrontal cortex, and AnCG,[7] the altered FGFR1 in CNS environment might have some pathophysiologic meanings. In report by Gaughran et al,[35] the authors suggested that the increased central FGFR1 RNA levels might be derived from, at least partially, the prolonged decrease in FGF-2 secretion.
5. Limitations
The study has several limitations that must be considered. First, the total number of studies included in this analysis is small and only 3 databases were used, which may have undermined its clinical significance. This is especially apparent in the MA of the postmortem brain FGF/FGFR levels. Second, an MA of the FGF changes along with treatment could not be done because only 1 study provided such information. Furthermore, there is a lack of direct evidence on whether peripheral FGF-2 levels are correlated with FGF-2 levels in the CNS. There is also no evidence to prove the permeability of FGF-2 across the BBB, which affects the application of this study to the pathophysiology of MDD. In addition, we could not perform further subgroup MA to compare the difference of peripheral/central FGF levels between different methods. Lastly, specific MA of changes in other FGF families was not performed because of limited literature with such information.
6. Conclusions
This MA provides evidence of significantly higher peripheral FGF-2 proteins and central FGFR1 RNA levels in patients with MDD than in HC. The FGF-2 levels in the postmortem brains of patients with MDD do not significantly differ from those of HC. These findings point to new directions of future studies investigating the relationship among MDD, oxidative stress, and the FGF family.
Supplementary Material
Footnotes
Abbreviations: AnCG = anterior cingulated gyrus, BBB = blood–brain barrier, CI = confidence interval, CNS = central nervous system, ES = effect size, FGF = fibroblast growth factor, FGFR = fibroblast growth factor receptor, HC = healthy controls, MA = meta-analysis, MDD = major depressive disorder, MOOSE = Meta-analysis Of Observational Studies in Epidemiology, VEGF = vascular endothelial growth factor.
C-KW and P-TT performed literature search and wrote the initial manuscript. P-TT conducted the data analysis. Y-WC surveyed the literature, summarized the extracted data, and provided excellent suggestions about the roles of FGF in the neural system. K-YT interpreted the analyzed data and revised the manuscript. P-YL interpreted the statistical results and worked as corresponding author. All authors reviewed and approved the final manuscript.
C-KW, P-TT, and Y-WC contribute equally as the first author.
The authors have no funding and conflicts of interest to disclose.
Supplemental Digital Content is available for this article.
References
- 1.Santric-Milicevic M, Jankovic J, Trajkovic G, et al. Socioeconomic inequalities in mental health of adult population: Serbian National Health Survey. Balkan Med J 2016; 33:36–44. [DOI] [PMC free article] [PubMed] [Google Scholar]
- 2.Topuzoglu A, Binbay T, Ulas H, et al. The epidemiology of major depressive disorder and subthreshold depression in Izmir, Turkey: prevalence, socioeconomic differences, impairment and help-seeking. J Affect Disord 2015; 181:78–86. [DOI] [PubMed] [Google Scholar]
- 3.Rizvi SJ, Cyriac A, Grima E, et al. Depression and employment status in primary and tertiary care settings. Can J Psychiatry 2015; 60:14–22. [DOI] [PMC free article] [PubMed] [Google Scholar]
- 4.Tseng PT, Cheng YS, Chen YW, et al. Increased levels of vascular endothelial growth factor in patients with major depressive disorder: a meta-analysis. Eur Neuropsychopharmacol 2015; 25:1622–1630. [DOI] [PubMed] [Google Scholar]
- 5.Chen YW, Lin PY, Tu KY, et al. Significantly lower nerve growth factor levels in patients with major depressive disorder than in healthy subjects: a meta-analysis and systematic review. Neuropsychiatr Dis Treat 2015; 11:925–933. [DOI] [PMC free article] [PubMed] [Google Scholar]
- 6.Lin PY, Tseng PT. Decreased glial cell line-derived neurotrophic factor levels in patients with depression: a meta-analytic study. J Psychiatr Res 2015; 63:20–27. [DOI] [PubMed] [Google Scholar]
- 7.Gomez-Pinilla F, Lee JW, Cotman CW. Distribution of basic fibroblast growth factor in the developing rat brain. Neuroscience 1994; 61:911–923. [DOI] [PubMed] [Google Scholar]
- 8.Riedel B, Friauf E, Grothe C, et al. Fibroblast growth factor-2-like immunoreactivity in auditory brainstem nuclei of the developing and adult rat: correlation with onset and loss of hearing. J Comp Neurol 1995; 354:353–360. [DOI] [PubMed] [Google Scholar]
- 9.Temple S, Qian X. bFGF, neurotrophins, and the control or cortical neurogenesis. Neuron 1995; 15:249–252. [DOI] [PubMed] [Google Scholar]
- 10.Vaccarino FM, Schwartz ML, Raballo R, et al. Changes in cerebral cortex size are governed by fibroblast growth factor during embryogenesis. Nat Neurosci 1999; 2:848. [DOI] [PubMed] [Google Scholar]
- 11.Ford-Perriss M, Abud H, Murphy M. Fibroblast growth factors in the developing central nervous system. Clin Exp Pharmacol Physiol 2001; 28:493–503. [DOI] [PubMed] [Google Scholar]
- 12.Laezza F, Lampert A, Kozel MA, et al. FGF14 N-terminal splice variants differentially modulate Nav1.2 and Nav1.6-encoded sodium channels. Mol Cell Neurosci 2009; 42:90–101. [DOI] [PMC free article] [PubMed] [Google Scholar]
- 13.Turner CA, Watson SJ, Akil H. The fibroblast growth factor family: neuromodulation of affective behavior. Neuron 2012; 76:160–174. [DOI] [PMC free article] [PubMed] [Google Scholar]
- 14.Zhao M, Li D, Shimazu K, et al. Fibroblast growth factor receptor-1 is required for long-term potentiation, memory consolidation, and neurogenesis. Biol Psychiatry 2007; 62:381–390. [DOI] [PubMed] [Google Scholar]
- 15.Stevens HE, Jiang GY, Schwartz ML, et al. Learning and memory depend on fibroblast growth factor receptor 2 functioning in hippocampus. Biol Psychiatry 2012; 71:1090–1098. [DOI] [PMC free article] [PubMed] [Google Scholar]
- 16.Lu S, Peng H, Wang L, et al. Elevated specific peripheral cytokines found in major depressive disorder patients with childhood trauma exposure: a cytokine antibody array analysis. Compr Psychiatry 2013; 54:953–961. [DOI] [PubMed] [Google Scholar]
- 17.He S, Zhang T, Hong B, et al. Decreased serum fibroblast growth factor-2 levels in pre- and post-treatment patients with major depressive disorder. Neurosci Lett 2014; 579:168–172. [DOI] [PubMed] [Google Scholar]
- 18.Takebayashi M, Hashimoto R, Hisaoka K, et al. Plasma levels of vascular endothelial growth factor and fibroblast growth factor 2 in patients with major depressive disorders. J Neural Transm (Vienna) 2010; 117:1119–1122. [DOI] [PubMed] [Google Scholar]
- 19.Kahl KG, Bens S, Ziegler K, et al. Angiogenic factors in patients with current major depressive disorder comorbid with borderline personality disorder. Psychoneuroendocrinology 2009; 34:353–357. [DOI] [PubMed] [Google Scholar]
- 20.Evans SJ, Choudary PV, Neal CR, et al. Dysregulation of the fibroblast growth factor system in major depression. Proc Natl Acad Sci USA 2004; 101:15506–15511. [DOI] [PMC free article] [PubMed] [Google Scholar]
- 21.Goswami DB, Jernigan CS, Chandran A, et al. Gene expression analysis of novel genes in the prefrontal cortex of major depressive disorder subjects. Prog Neuropsychopharmacol Biol Psychiatry 2013; 43:126–133. [DOI] [PMC free article] [PubMed] [Google Scholar]
- 22.Stroup DF, Berlin JA, Morton SC, et al. Meta-analysis of observational studies in epidemiology: a proposal for reporting. Meta-analysis Of Observational Studies in Epidemiology (MOOSE) group. JAMA 2000; 283:2008–2012. [DOI] [PubMed] [Google Scholar]
- 23.Jadad AR, Moore RA, Carroll D, et al. Assessing the quality of reports of randomized clinical trials: is blinding necessary? Control Clin Trials 1996; 17:1–12. [DOI] [PubMed] [Google Scholar]
- 24.Egger M, Smith GD, Schneider M, et al. Bias in meta-analysis detected by a simple, graphical test. BMJ 1997; 315:629–634. [DOI] [PMC free article] [PubMed] [Google Scholar]
- 25.Kato M, Okugawa G, Wakeno M, et al. Effect of basic fibroblast growth factor (FGF2) gene polymorphisms on SSRIs treatment response and side effects. Eur Neuropsychopharmacol 2009; 19:718–725. [DOI] [PubMed] [Google Scholar]
- 26.Wang T, Zeng Z, Hu Z, et al. FGFR2 is associated with bipolar disorder: a large-scale case-control study of three psychiatric disorders in the Chinese Han population. World J Biol Psychiatry 2012; 13:599–604. [DOI] [PubMed] [Google Scholar]
- 27.Riva MA, Molteni R, Bedogni F, et al. Emerging role of the FGF system in psychiatric disorders. Trends Pharmacol Sci 2005; 26:228–231. [DOI] [PubMed] [Google Scholar]
- 28.van Scheltinga AFT, Bakker SC, Kahn RS, et al. Fibroblast growth factors in neurodevelopment and psychopathology. Neuroscientist 2013; 19:479–494. [DOI] [PubMed] [Google Scholar]
- 29.Anisman H, Hayley S. Inflammatory factors contribute to depression and its comorbid conditions. Sci Signal 2012; 5:e45. [DOI] [PubMed] [Google Scholar]
- 30.Akil H, Evans SJ, Turner CA, et al. The fibroblast growth factor family and mood disorders. Novartis Found Symp 2008; 289:94–96. [DOI] [PubMed] [Google Scholar]
- 31.Turner CA, Akil H, Watson SJ, et al. The fibroblast growth factor system and mood disorders. Biol Psychiatry 2006; 59:1128–1135. [DOI] [PubMed] [Google Scholar]
- 32.Liu X, Zhang T, He S, et al. Elevated serum levels of FGF-2, NGF and IGF-1 in patients with manic episode of bipolar disorder. Psychiatry Res 2014; 218:54–60. [DOI] [PubMed] [Google Scholar]
- 33.Sibille E, Arango V, Galfalvy HC, et al. Gene expression profiling of depression and suicide in human prefrontal cortex. Neuropsychopharmacology 2004; 29:351–361. [DOI] [PubMed] [Google Scholar]
- 34.Fakhri H, Ricken R, Adli M, et al. Impact of lithium treatment on FGF-23 serum concentrations in depressive patients. J Clin Psychopharmacol 2014; 34:745–747. [DOI] [PMC free article] [PubMed] [Google Scholar]
- 35.Gaughran F, Payne J, Sedgwick PM, et al. Hippocampal FGF-2 and FGFR1 mRNA expression in major depression, schizophrenia and bipolar disorder. Brain Res Bull 2006; 70:221–227. [DOI] [PubMed] [Google Scholar]
- 36.Sterne JA, Egger M, Moher D. Higgins JP, Green S. Addressing reporting biases. John Wiley & Sons, Ltd, Cochrane Handbook for Systematic Reviews of Interventions: Cochrane Book Series. Chichester, UK:2008. [Google Scholar]
- 37.Delgado-Rivera R, Harris SL, Ahmed I, et al. Increased FGF-2 secretion and ability to support neurite outgrowth by astrocytes cultured on polyamide nanofibrillar matrices. Matrix Biol 2009; 28:137–147. [DOI] [PubMed] [Google Scholar]
- 38.Toyoda K, Tanaka K, Nakagawa S, et al. Initial contact of glioblastoma cells with existing normal brain endothelial cells strengthen the barrier function via fibroblast growth factor 2 secretion: a new in vitro blood–brain barrier model. Cell Mol Neurobiol 2013; 33:489–501. [DOI] [PMC free article] [PubMed] [Google Scholar]
- 39.Huang B, Krafft PR, Ma Q, et al. Fibroblast growth factors preserve blood–brain barrier integrity through RhoA inhibition after intracerebral hemorrhage in mice. Neurobiol Dis 2012; 46:204–214. [DOI] [PMC free article] [PubMed] [Google Scholar]
- 40.Wang Z, Wang Y, Ye J, et al. bFGF attenuates endoplasmic reticulum stress and mitochondrial injury on myocardial ischaemia/reperfusion via activation of PI3K/Akt/ERK1/2 pathway. J Cell Mol Med 2015; 19:595–607. [DOI] [PMC free article] [PubMed] [Google Scholar]
- 41.Yafai Y, Iandiev I, Lange J, et al. Basic fibroblast growth factor contributes to a shift in the angioregulatory activity of retinal glial (Muller) cells. PLoS ONE 2013; 8:e68773. [DOI] [PMC free article] [PubMed] [Google Scholar]
- 42.Slavich GM, Irwin MR. From stress to inflammation and major depressive disorder: a social signal transduction theory of depression. Psychol Bull 2014; 140:774–815. [DOI] [PMC free article] [PubMed] [Google Scholar]
- 43.Bittner S, Ruck T, Fernandez-Orth J, et al. TREK-king the blood–brain-barrier. J Neuroimmune Pharmacol 2014; 9:293–301. [DOI] [PubMed] [Google Scholar]
- 44.Najjar S, Pearlman DM, Devinsky O, et al. Neurovascular unit dysfunction with blood–brain barrier hyperpermeability contributes to major depressive disorder: a review of clinical and experimental evidence. J Neuroinflammation 2013; 10:142. [DOI] [PMC free article] [PubMed] [Google Scholar]
- 45.Frinchi M, Bonomo A, Trovato-Salinaro A, et al. Fibroblast growth factor-2 and its receptor expression in proliferating precursor cells of the subventricular zone in the adult rat brain. Neurosci Lett 2008; 447:20–25. [DOI] [PubMed] [Google Scholar]
Associated Data
This section collects any data citations, data availability statements, or supplementary materials included in this article.