

Abstract
We demonstrate a photonic crystal biosilica surface-enhanced Raman scattering (SERS) substrate based on a diatom frustule with in-situ synthesized silver nanoparticles (Ag NPs) to detect explosive molecules from nanoliter (nL) solution. By integrating high density Ag NPs inside the nanopores of diatom biosilica, which is not achievable by traditional self-assembly techniques, we obtained ultra-high SERS sensitivity due to dual enhancement mechanisms. First, the hybrid plasmonic-photonic crystal biosilica with three dimensional morphologies was obtained by electroless-deposited Ag seeds at nanometer sized diatom frustule surface, which provides high density hot spots as well as strongly coupled optical resonances with the photonic crystal structure of diatom frustules. Second, we discovered that the evaporation-driven microscopic flow combined with the strong hydrophilic surface of diatom frustules is capable of concentrating the analyte molecules, which offers a simple yet effective mechanism to accelerate the mass transport into the SERS substrate. Using the inkjet printing technology, we are able to deliver multiple 100 pico-liter (pL) volume droplets with pinpoint accuracy into a single diatom frustule with dimension around 30 μm × 7 μm × 5 μm, which allows for label-free detection of explosive molecules such as trinitrotoluene (TNT) down to 10−10 M in concentration and 2.7 × 10⁻¹⁵ g in mass from 120 nL solution. Our research illustrates a new paradigm of SERS sensing to detect trace level of chemical compounds from minimum volume of analyte using nature created photonic crystal biosilica materials.
Keywords: Surface-enhanced Raman scattering, Diatom biosilica, Photonic crystal, Hydrophilic surface, Inkjet printing
1. Introduction
The detection of a small number of molecules in miniature amount of solution is of pivotal significance in many practical applications including biomedicine, homeland security, forensics, and environmental protection (Liu et al., 2010), among which ultra-sensitive detection of trace amount of explosive chemicals has the top priority. 2, 4, 6-Trinitrotoluene (TNT) is a typical explosive material and is widely used in military as well as for terrorist activities (recent terrorist attacks in Europe and Pakistan). In addition, TNT is also widely used in underwater explosion and many other industrial applications, which could lead to the contamination of soil and ground water (Yang et al., 2010). A variety of technologies such as mass spectroscopy, photoluminescence (PL), chromatography and Raman spectroscopy (GrahamáCooks, 2005; Harvey et al., 1990; He et al., 2015; Zhen et al., 2016) are currently employed to detect TNT in the environment, among which surface-enhanced Raman scattering (SERS) is one of the most popular detection techniques (Dasary et al., 2009; Hamad et al., 2014; Jamil et al., 2015a, 2015b; Zapata et al., 2016). Although ultra-high detection sensitivity has been reported, surface functionalization of the SERS substrates sometimes are required and the Raman signals actually come from the probe molecules rather than TNT itself (Hakonen et al., 2015; He et al., 2015; Yang et al., 2010) because the binding affinity of TNT toward metallic nanoparticle surfaces is very low. Ultra-sensitive label-free detection of TNT with finger print Raman spectra still remains a grand challenge.
SERS spectroscopy is a powerful analytical technique due to its high selectivity and its ability to gather fingerprint information of analytes at trace concentration, even down to single molecules (Kneipp et al., 1997; Nie and Emory, 1997) for some chemical species. In SERS effect, the Raman enhancement are primarily attributed to the electromagnetic field induced by localized surface plasmon resonance (LSPR) as well as chemical interactions between the analyte and metallic substrate (Kong et al., 2013; Willets and Van Duyne, 2007). The LSPR is closely associated with the dielectric environment and the morphology of the nanostructure. The sharp edges, clusters, and narrow gaps of metallic nanostructures can significantly enhance localized electromagnetic fields, which generates ‘hot spots’ with large SERS enhancement factors (EFs) (Driskell et al., 2006). The fabrication of well-defined plasmonic nanostructures to obtain maximum ‘hot spots’ is one of the most critical aspects in SERS substrate design. Numerous reports have been focused on the design of plasmonic SERS substrates utilizing metallic or bimetallic materials (Chen et al., 2010; Gómez-Graña et al., 2013; Pei et al., 2013; Wu et al., 2012). Porous materials have long been the focus as well because of their unique physical and chemical properties, the rapid mass transport inside the micro-channels, and exceptionally high surface areas that enable them as efficient adsorbents in the liquid phase (Deng et al., 2008). When depositing metallic NPs in the pores of porous materials to form three dimensional (3-D) SERS substrates, it would bring exclusive advantages including large surface area to maximize the number of hot spots and adsorption sites for analyte compared with the planar metallic nanostructures (Ko et al., 2008b). Tsukruk’s group has conducted advanced work on fabricating 3-D porous SERS substrates through loading metallic NPs in the micro-channels of porous alumina membranes (PAMs) (Chang et al., 2010; Ko et al., 2008a, 2008b). Silicon, glass and polyoxometalate materials with porous structures were also employed to prepare 3-D SERS substrates by depositing metallic NPs (Lee et al., 2007; Lu et al., 2009; Xu et al., 2013; Zhang et al., 2015). These substrates possess excellent SERS sensitivity for various analytes.
In most practical SERS sensing applications, the target molecules are dispersed in solutions and are free to diffuse into the liquid volume. During the process of mass transport into the SERS substrate, the surface property of SERS substrate may lead to the spread of the aqueous sample over a bigger area than that of the plasmonic sensing surface (Shao et al., 2015), which makes it difficult to concentrate the analyte molecules for high detection sensitivity. Therefore, much recent attention has been paid toward the surface wettability of SERS substrates (De Angelis et al., 2011; Hakonen et al., 2016; Shao et al., 2015). Fabrizio and co-workers reported SERS substrates with super-hydrophobic artificial surfaces (De Angelis et al., 2011), which could concentrate target samples at the SERS sensing area and enable the detection of Rhodamine 6G (R6G) at atto-molar concentration. The SERS active metallic colloids with hydrophilic surface were also employed to confine analyte molecules by spotting them onto a hydrophobic substrate. But these approaches require specific fabrication processes such as optical lithography and ion etching or functional polymers to modify the surface of the SERS substrates.
Diatoms are unicellular, photosynthetic biomineralization marine organisms that possess a biosilica shell called a frustule. PL-based diatom biosensors have been successfully developed, including the detection of TNT down to 3.5 × 10⁻⁸ M (Zhen et al., 2016). Compared with traditional porous substrates, the two dimensional (2-D) periodic pores on the 3-D diatom frustule with hierarchical nanoscale photonic crystal features can enhance the local optical fields at the surface of and inside diatom frustules (Jeffryes et al., 2008b; Yang et al., 2011). Our previous studies have shown that such unique photonic crystal features are capable of enhancing LSPRs of self-assembled metal NPs on the surface of diatom frustules, which will enable additional enhancement of SERS signals of the molecules adsorbed on the metallic NPs (Ren et al., 2014; Ren et al., 2013; Yang et al., 2014). In this work, we demonstrated a simple and fast method to integrate Ag NPs by an in-situ growth method from electroless deposited seeds within the photonic nanoporous diatom for the fabrication of 3-D hybrid plasmonic-photonic crystal biosilica SERS substrates. The advantages of in-situ growth diatom-Ag NPs compared with self-assembled diatom-Ag NPs come from two aspects: 1) the higher density Ag NPs at the surface that will introduce more hot-spots; and 2) many more Ag NPs in the pores of diatom frustules as our numerical simulation results have proved that in-pore Ag NPs can provide even higher SERS enhancement factors (Ren et al., 2013). In addition to the well-known photonic crystal effect, diatom also offers unique surface properties, which have been rarely investigated before. Compared with conventional flat glass slides, the abundant hydroxyl groups on the surface make diatom biosilica very hydrophilic. The highly hydrophilic surface and highly ordered nanopores of diatom frustules could drive the liquid flow from glass towards the diatom frustule due to capillary forces. Continuous mass transport can be sustained as the liquid evaporates (Buffone and Sefiane, 2004; Sefiane and Ward, 2007). As a result, the highly hydrophilic and porous diatom frustule provides a driving force to concentrate the target molecules, which can help to improve the detection limit by orders of magnitudes.
In addition to the optimization of SERS substrates, another practical challenge of biosensors is how to efficiently deliver miniature amount of analyte solution to the sensor surface. Microfluidic devices could perform assays at nanoliter-volume scale. However, the complicated microfluidic chips, expensive control systems, and assay-specific surface modifications are indispensable. Inkjet printing is a fast, simple and cost effective technology, which provides the possibility of pinpoint accuracy and miniature amount of analyte consumption (Baluya et al., 2007; Wang et al., 2009). When combined with diatom frustules that have comparable size as the inkjet droplets, inkjet printing could effectively accumulate the analyte molecules into a single or a few diatom frustules, and therefore improve the detection limit. We developed a novel strategy to precisely dispense miniature amount of analyte into a single diatom by inkjet printing as shown in Fig. 1. Each analyte droplet is controlled around 100 pico-liter (pL) and multiple droplets can be precisely delivered to the same diatom frustule. The multiple cycles of droplet dispense-evaporation provide a simple yet effective mechanism to accelerate the mass transport into the hybrid plasmonic-biosilica SERS substrate. The hydrophilic porous nanochannels and the photonic-plasmonic coupling effect of diatom biosilica are combined in a synergistic way to allow ultra-sensitive TNT detection in miniature volume of solutions.
Fig. 1.
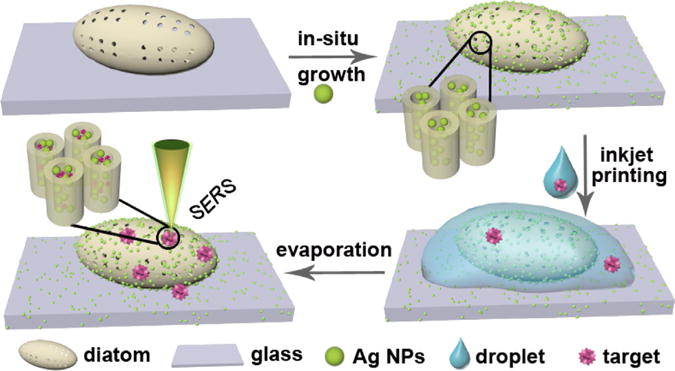
Illustration of in-situ growth of Ag NPs in pores of the diatom frustule with hydrophilic surface and combined with inkjet printing technology for ultrasensitive TNT detection at nanoliter volume scale.
2. Experimental section
2.1. Materials and reagents
Silver nitrate (AgNO3) was obtained from Alfa Aesar. Ethylene-diaminetetraacetic acid (EDTA), Tin (II) chloride (SnCl2), ascorbic acid and poly-diallyldimethylammonium chloride (PDDA) were purchased from Sigma-Aldrich. Trisodium citrate (Na3C6H5O7), hydrochloric acid (HCl), sodium hydroxide (NaOH), ethanol and acetone were purchased from Macron. Rhodamine6G (R6G) was obtained from TCI. All the reagents were used as received without further purification. Water used in all experiments was deionized and further purified by a Millipore Synergy UV Unit to a resistivity of ~ 18.2 MΩ cm.
2.2. Fabrication of diatom biosilica substrates
Diatom cells were (Pinnularia sp.) cultivated according traditional microbiological cultivation with modification (Jeffryes et al., 2008a). Diatoms were cultured in flasks for 7 days, 400 mL of diatom suspension were centrifuged and dispersing with 40 mL of sterile filtered artificial seawater. The suspended cells were transferred into new centrifuge tube using a 20 μm mesh filter to collect isolated cells, the cell density was diluted to 2.5 × 10⁵ cells/mL for seeding. Each coverslip was placed into individual petri dish separately, and 15 mL of diatom cell suspension were pipetted onto the substrate. The substrates were incubated in humidifier chamber for an hour to allow cells to settle on the surface, the coverslip was removed from each petri dish and put into a fresh petri dish. The samples were left in humidifier for 24 h and immersed in 70% EtOH for 4 h, and then immersed in 100% EtOH for 4 more hrs. The samples were dried in air and treated by use the UV ozone cleaner at 90 °C for 24 h, after that the prepared substrates were ready for future use after cooling down.
2.3. In-situ growth Ag NPs in diatom substrate
The integration of the AgNPs in the daitom substrate was achieved by the method proposed by Tsukruk’ group with a slight modification (Chang et al., 2010). Briefly, the glass slides coated with diatom frustules were immersed in an aqueous solution of SnCl2 (20 mM) and HCl (20 mM) for 5 min to deposit Sn2+ on the pore walls, and then rinsed with milli-Q water thoroughly and subsequently rinsed with acetone and dried with nitrogen. Then the glass slides with diatom frustules were immersed in a 20 mM aqueous solution of AgNO3 for 5 min to deposit Ag seeds on the diatom frustules followed by a second rinsing step. After Ag seeds deposition, the glass slides with diatom frustules were immersed in 1 mL of AgNO3 solution with different concentrations (2.5 mM, 5 mM and 10 mM) and 0.5 mL of 50 mM ascorbic acid. The glass slides with diatom frustules were then removed from the solution and rinsed with milli-Q water after 10 min.
2.4. Ag NPs synthesis and self-assembly the diatom substrate
Ag NPs with an average diameter of 40 nm were prepared according to procedures available in the scientific literature (Stokes et al., 2008). For assembly of Ag NPs on diatom substrate, the surface of the diatom substrate was firstly cationized by PDDA (1%) and then immersed into colloidal Ag NPs suspension for 6 h, and then thoroughly washed with water.
2.5. SERS measurement
SERS measurements on the diatom substrate coated with Ag NPs were performed using Rhodamine 6G (R6G), a typical Raman reporter. The substrates were soaked in 1 mL of R6G solutions with varying concentrations for 5 min, and then were taken out for SERS measurement. For TNT detection, a similar procedure was followed. Raman spectra were acquired at ambient conditions using a Horiba Jobin Yvon Lab Ram HR800 Raman microscope equipped with a CCD detector, and a 50 × objective lens was used for the spectral measurement. Each spectrum was based on the average of 25 measured spectra: we chose five different diatoms, and measured the SERS spectra from five different spots on each diatom. The excitation wavelength was 532 nm, and the laser spot size is 2 μm in diameter. The confocal pinhole was set to a diameter of 100 μm.
2.6. Inkjet device
Printing experiments were carried out using a single-jet stationary thermal inkjet print-head Microjet (HP Inc., OR, USA). The printing processes were controlled by the software from HP, and the volume of the droplet and interval time between droplets could be controlled during the process of printing. The droplet volume and the diameter of droplet spread area after impact onto substrate were about 100 pL and 50 μm, respectively. The interval time between two droplets is 2 s to allow evaporation of the printed droplets.
2.7. Other measurements
UV–vis absorption spectra were recorded on NanoDrop 2000 UV-vis spectrophotometer (Thermo Scientific) using quartz cells of 1 cm optical path. Scanning electron microscopy (SEM) images were acquired on FEI Quanta 600 FEG SEM with 15–30 kV accelerating voltage. Breifly: we point to a diatom substrate surface with the 50 × objective lens, with the Horiba Jobin Yvon Lab Ram HR800 Raman system using the 532 nm laser line. Fluorescence microscopy images were obtained using Olympus IX73 microscope equipped with X-cite 120 LED fluorescence microscope light source, and green laser was used as the excitation light source.
3. Results and discussion
3.1. Integration and characterization of Ag NPs on diatom biosilica
The deposition of the Ag NPs onto diatom frustule was characterized by scanning electron microscopy (SEM) images as shown in Fig. 2. The morphology and fine structures of diatom are presented in Fig. 2a–b. The semi-ellipsoidal cell dimensions for Pinnularia sp. are nearly 30 μm along the major axis, 7 μm along the minor axis and 5 μm in height. The diatom frustule consists of two-dimensional arrays of sub-micron pores with average diameters of 200 nm (Fig. 2b). After immobilizing the Ag seeds on diatoms by electroless deposition, the surface roughness of the diatom frustule increased. Ag NPs with extremely small size were immobilized on the diatom surface. When the diatom frustule was dipped in an aqueous solution containing mixture of SnCl2 and HCl, the Sn2+ ions could adsorbed on the pore walls of diatom as the affinity between them (Chang et al., 2010; Lopez and Ortiz, 1994). Then the diatom was immersed in aqueous solution of AgNO3 to deposit Ag seeds on the entire surface of diatom as shown in Fig. 2c. This was achieved through the reduction of Ag on the surface of the pores via the reduction reaction from the aqueous solution, which could penetrate into all pores.
Fig. 2.
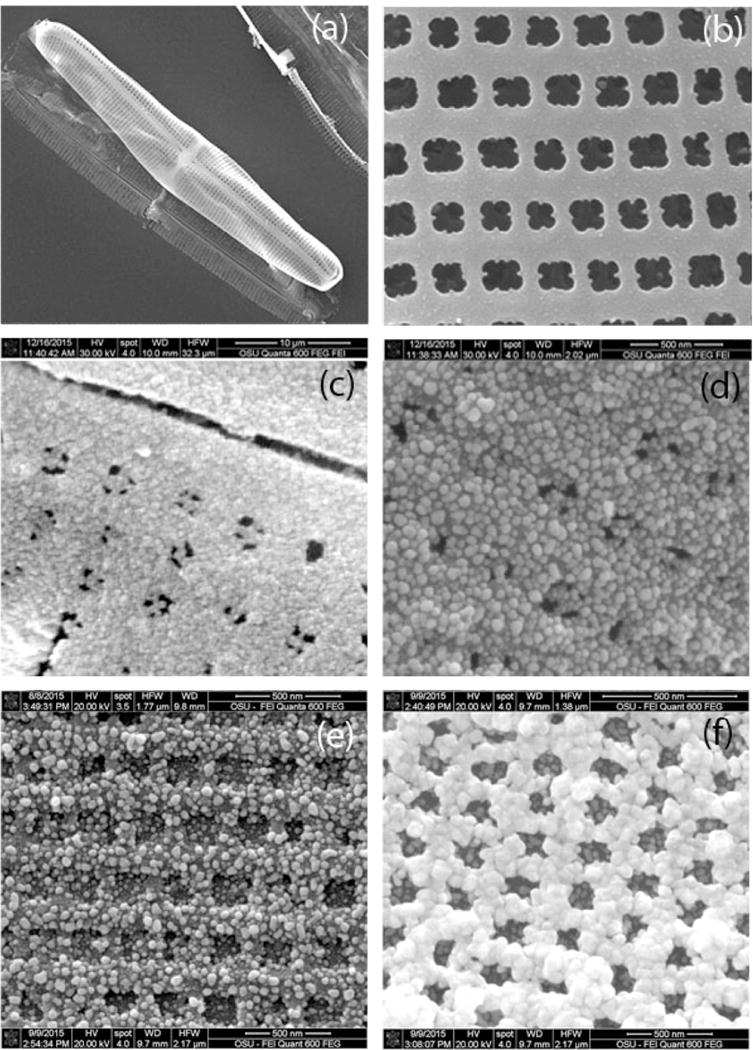
SEM images of (a) an overview of a single diatom frustule, (b) primary pores on a frustule, (c) deposited Ag seeds on the diatom frustule and Ag NPs in-situ growth from the seeds with (d) 2.5 mM, (e) 5 mM and (e) 10 mM AgNO3 added in the growth media.
In-situ growth of larger Ag NPs based on the small Ag seeds was employed to complete the controlled deposition of Ag NPs on the interior walls of the pores. Following the deposition of Ag seeds with small size on the surfaces of the pores, large and highly condensed Ag NPs were obtained through a heterogeneous nucleation and growth mechanism. During the process of Ag seeds growth to larger Ag NPs in the salt solution, the nucleation and growth are dependent on several parameters including the free energy of different phases, the concentration of nuclei and growth species in solution, and the surface energy of the growing particles (Chang et al., 2010; Finney and Finke, 2008). For the homogeneous growth in our study, the growth step is limited only by the diffusion of growing species in the growth media to the surface of the growing seed. In this way, the preliminary seeded wall regions provide controlled growth of Ag NPs on the inner pore surface based on the concentration of growth species present in the solution. Therefore, we investigated the actual size of the Ag NPs growth on the diatom under different concentrations of AgNO3.
Five different concentrations of AgNO3 were added into the growth media for optimizing the SERS performance of Ag NPs during the process of in-situ growth. The SEM images (Fig. 2d–f for AgNO3 of 2.5 mM, 5 mM and 10 mM, 1 mM and 15 mM of AgNO3 used in the in-situ growth process shown in Fig. S1.) show that the Ag NPs in-situ grew to bigger size from electroless-deposited seeds on diatom template following exposure to a growth media (an aqueous mixture of AgNO3 and ascorbic acid). The top-view through the periodic pores of diatoms are presented to show the distribution of Ag NPs. It is clearly observed that the Ag NPs immobilized on diatom were nearly spherical and uniform, and their diameters increased with increasing concentrations of AgNO3. It is clearly seen from these images that, as 2.5 mM of AgNO3 solution added into the growth solution, it generates fairly small NPs with diameters of 30 nm (Fig. 2e). The diameter of the Ag NPs increased to about 50 nm as the AgNO3 concentration increased to 5 mM. When AgNO3 solution is 10 mM, the size of NPs increased to bigger size nearly at 100 nm and the Ag NPs were connected to form a film on top of the diatom, which will degrade the SERS EFs. It was observed that as the concentration of AgNO3 added into the growth solution increases, the diameter of the Ag NPs growth on the porous diatom also gradually increases. The hybrid structure of diatom-Ag NPs can also be prepared by directly self-assembling Ag NPs onto the diatom because the diatom was positively charged due to poly-diallyldimethylammonium chloride (PDDA) modification. The Ag NPs synthesized with negatively charged capping agents can be self-assembled on the surface via electrostatic interaction. Because of the limited mass transport throughout the microscopic channels on diatom, it is difficult to fill the Ag NPs inside the nanosized pores of diatom. The lower particle density on diatom by self-assembly compared to the in-situ growth method was a result of the repulsion between negatively charged Ag NPs and the low concentration of Ag NPs from as prepared Ag colloid, result in the decreasing of the amount of hot spots (Fig. S2, S3 and S4).
3.2. SERS performance of the diatom-Ag substrate
We first investigated the potential use of the SERS substrate with a typical SERS active analyte, R6G, as the probe molecules. The SERS spectra were collected using the excitation light at 532 nm wavelength. In our SERS measurement, the substrates were soaked in 1 mL of R6G solutions for 2 min and then dried in air. The peaks at 1308, 1360, 1504 and 1647 cm−1 are associated with aromatic C-C stretching vibrations of R6G. From the comparison of relative SERS intensities of R6G on each substrate, the substrate decorating Ag NPs grown with 5 mM AgNO3 solution adding was observed to get the largest SERS enhancement (Fig. 3). Under these conditions, Ag NPs with an average diameter of 50 nm were grown inside the pores of diatom and utilized for further studies.
Fig. 3.
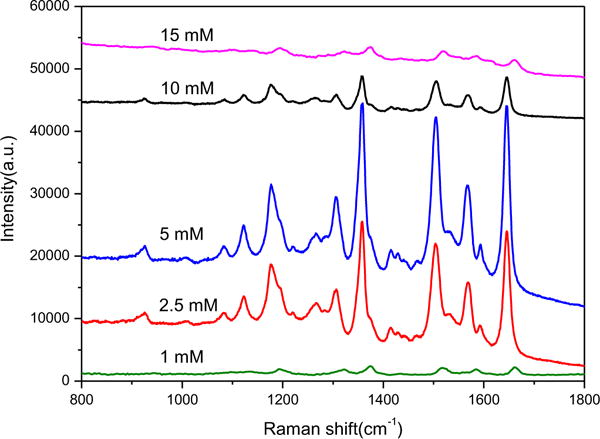
Raman spectra ofR6G (10−6 M) on diatom-Ag NPs through in-situ growth at various AgNO3 concentrations.
To compare the Raman enhancement of the hybrid plasmonic-biosilica SERS substrates fabricated by the in-situ growth method to that fabricated by the self-assembly process via electrostatic interaction, both SERS substrates were dipped into aqueous R6G solutions at different concentrations (1 μM to 0.1 nM) and compared the SERS signals after drying under the same condition. As shown in Fig. 4, all the characteristic bands of the R6G exhibited a monotonous decrease in intensity following the decrease of the R6G concentration. The SERS substrate fabricated by the in-situ growth method provides higher Raman peak intensity than that fabricated by self-assembly of Ag NPs. The limit of detection (defined as a signal to noise (S/N) ratio of 3) for R6G was 0.46 × 10⁻¹⁰ M with the substrate via in-situ growth method and 1.4 × 10⁻¹⁰ M with substrate via self-assembly. The SERS enhancement factor of the hybrid plasmonic diatom-Ag is nearly 109 using the calculation method reported by Chaney et al. (2005). The superior performance could be attributed to two improved aspects: First, the optical coupling of the guided-mode resonance (GMR) of the diatom frustules and the localized surface plasmons (LSPs) of the Ag NPs are stronger for NPs in the pores (Ren et al., 2013); Second, the 3-D morphology of the porous diatom biosilica would have advantages of larger surface areas to maximize the number of hot spots and adsorption sites of analyte compared with the planar 2D SERS substrate. The hybrid plasmonic diatom-Ag NPs substrate fabricated by in-situ growth also has good uniformity and the reproducibility from the Raman mapping image (Fig. S5).
Fig. 4.
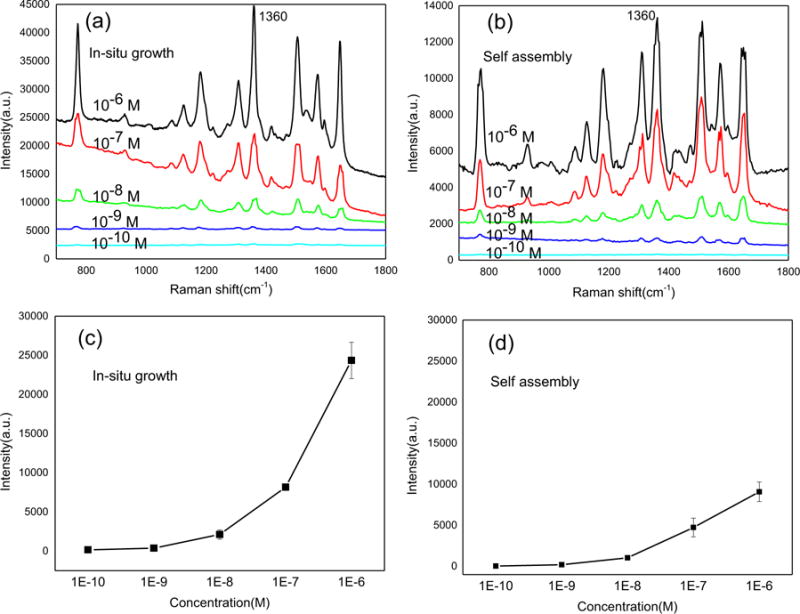
SERS spectra of R6G on diatom with in-situ growth (a) and self-assembled Ag NPs (b) dipped in R6G solutions of different concentrations. SERS intensity as a function of R6G concentrations on diatom with in-situ growth (c) and self-assembled NPs (d).
Some reported SERS sensing results for TNT detection need the surface functionalization of the metal nanostructures because of the low binding affinity between TNT and the metal NPs. Interestingly, we found that the porous structure of diatom could help to concentrate TNT into the SERS substrates in the process of solution evaporation. Thus, the development of ultra-sensitive and functionalization-free methods for TNT is possible using hybrid plasmonic-biosilica SERS substrates. Fig. 5(a) shows the SERS spectra obtained by dipping the in-situ growth diatom-Ag NPs out from aqueous TNT solutions at various concentrations. The prominent peak at 1386 cm−1 is assigned to the NO2 stretching mode of TNT and it can be used as the characteristic SERS peak for TNT detection. It can be observed that the intensity of the peak decreases gradually with the decrease of TNT concentrations from 5 × 10⁻⁴ M to 1 × 10⁻⁶ M (Fig. 5b). To investigate the interference from other molecules, we added 4-mercaptobenzoic acid (MBA) into the TNT solution and measured the SERS spectra of the mixed sample. Since the Raman peaks of MBA and TNT have no overlap, both of these two compounds can be detected with featured Raman spectra shown in Fig. S6. To further improve the selectivity from even more complex samples, either a separation (such as thin layer chromatography) or a surface functionalization method is required.
Fig. 5.
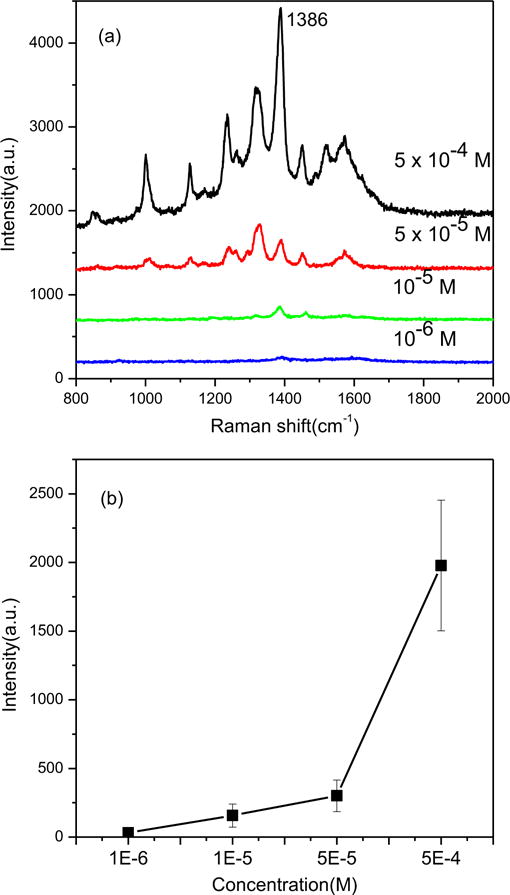
SERS spectra of TNT on diatom with in-situ growth Ag NPs dipped in TNT solutions with different concentrations (a) and SERS intensity as a function of TNT concentrations (b).
3.3. TNT sensing on the hydrophilic diatom-Ag SERS substrate by inkjet printing
After the diatom is settled on the surface of glass, the diatom frustules are still highly hydrophilic compared to the planar glass slide due to the abundant hydroxyl groups and the porous structure. The glass-diatom substrate has relatively large difference in wettability (Fig. S7), the liquid will flow from the planar glass surface towards the nanoporous diatom frustule during the evaporation process because of the relative hydrophilic/hydrophobic surfaces and capillary forces. The analyte enrichment effect of the diatom with strong hydrophilic surface was investigated by Rhodamine 6G (R6G) as the typical probe molecules due to its fluorescence color (Fig. S8). As the solution evaporates, the analyte molecules therefore become more and more concentrated in the solution on the diatom surface. At the end of the evaporation, when the solvent (water) disappears completely, the analyte molecules on the diatom surface will have a higher density compared to those on the glass slide. The multiple cycles of droplet dispensing-evaporation on diatom frustule can further enhanced analyte concentration effect. To achieve TNT detection from nanoliter (nL) volume solution, inkjet printing technology was employed to dispense aqueous TNT solution onto the diatom-Ag NPs SERS substrate. The volume of one droplet from the inkjet printer was around 100 picoliter (pL). To improve the detection limit, multiple droplets were precisely dispensed onto the same diatom frustule with the time interval between two droplets of 2 s to allow water evaporation. The detection results were shown in Fig. 6. For the TNT solution at 10−7 M, we could clearly obtain the SERS signals from 100 droplets onto the diatom-Ag NPs SERS substrate, corresponding to 2.27 × 10⁻¹² g TNT as shown in Fig. 6a. But the SERS signals of 50 droplets are barely above the noise level. As a comparison, there were no SERS signals of TNT on the SERS substrate without diatom, although these regions were also covered by the same droplets (Fig. S9). Interestingly, we found that increasing the number droplets dispensed onto the diatom-Ag NPs SERS substrate could achieve lower detection limit of TNT. The results in Fig. 6(b) and (c) corresponds to 4.54 × 10⁻¹³g TNT from 200 droplets and 9.08 × 10⁻¹⁴ g TNT from 400 droplets, respectively. When 1200 droplets of solution were dispensed onto the diatom-Ag NPs SERS substrate, the detected TNT in aqueous solution was 0.1 nM and the total consumed volume of the solution was only 120 nL, corresponding to 2.7 × 10⁻¹⁵ g of TNT as shown in Fig. 6 (d). Our experimental results suggest that the inkjet technology could further enhance the analyte enrichment effect of diatom by continuously dispensing multiple droplets onto the same diatom frustule.
Fig. 6.
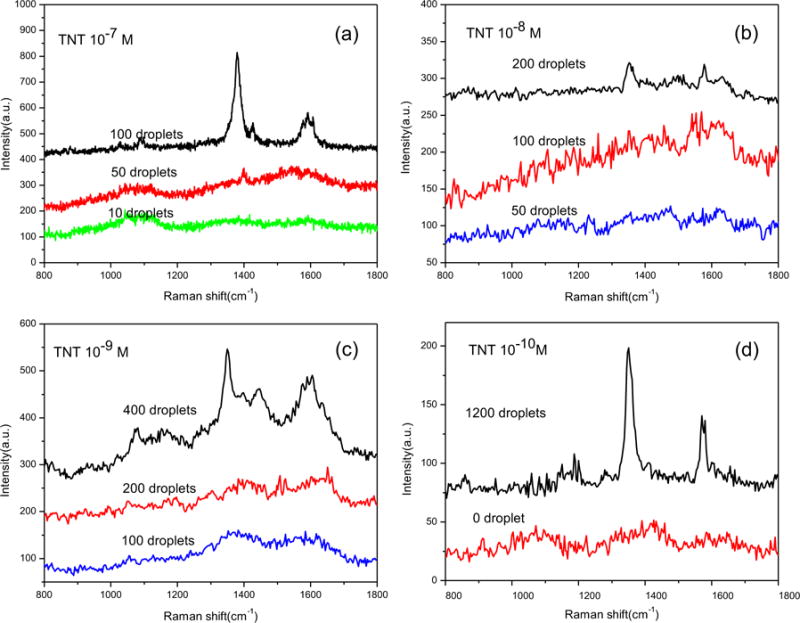
SERS spectra of different droplets of TNT at various concentrations cast onto a single diatom frustule with in-situ growth Ag NPs by inkjet printing.
4. Conclusions
In summary, we have presented a new 3-D nanoporous SERS substrate based on photonic crystal biosilica with molecule concentrating effect by integrating Ag NPs into micro-channels of diatom frustules. The Ag NPs decorated porous diatoms were fabricated via in-situ growth of Ag NPs on diatom biosilica. In comparison with the diatom SERS substrate by conventional selfassembly techniques, the diatom-Ag NPs by in-situ growth is more advance with higher optical field enhancement and more hot spots and negligible background interference under Raman laser excitation. The overall SERS signals were further improved by 2.5 times. The hybrid plasmonic diatom-Ag NPs substrate fabricated by in-situ growth could easily detect R6G down to 0.1 nM by simple dipping methods. In addition, we discovered that the hydrophilic surface of diatom with porous nanostructures can concentrate analyte molecules by the liquid flow towards the diatom frustule from the glass surface during the evaporating process of the liquid droplets, which offers a simple yet effective mechanism to accelerate the mass transport into the SERS substrate. Using an inkjet printer to dispense miniature amount of analyte solution, we are able to deliver target molecules from nanoliter samples into a single diatom frustule with pinpoint accuracy. The effect of analyte molecule concentration could be enhanced by multi-cycles of droplet delivered from the inkjet printer, which allows for label-free detection of TNT down to 10−10 M in concentration or 2.7 × 10⁻¹⁵ g in mass from 120 nL solution. Our research illustrates a new paradigm of SERS sensing to detect trace level of chemical compounds with minimum analyte consumption using nature created nanophotonic materials.
Supplementary Material
Acknowledgments
The authors would like to acknowledge the support from the National Institutes of Health, United States under Grant no. 1R03EB018893 and 9R42ES024023. This work was also supported by the U.S. Department of Defense, United States, Office of Naval Research, Synthetic Biology Program, award Number N000141210313. We also thank Prof. Hua Tan at Washington State University Vancouver for the helpful discussion of the microfluidics.
Appendix A. Supporting information
Supplementary data associated with this article can be found in the online version at http://dx.doi.org/10.1016/j.bios.2016.07.062.
References
- Baluya DL, Garrett TJ, Yost RA. Anal Chem. 2007;79(17):6862–6867. doi: 10.1021/ac070958d. [DOI] [PubMed] [Google Scholar]
- Buffone C, Sefiane K. Int J Multiph Flow. 2004;30(9):1071–1091. [Google Scholar]
- Chaney SB, Shanmukh S, Dluhy RA, Zhao YP. Appl Phys Lett. 2005;87(3):031908. [Google Scholar]
- Chang S, Combs ZA, Gupta MK, Davis R, Tsukruk VV. ACS Appl Mater Interfaces. 2010;2(11):3333–3339. doi: 10.1021/am100758k. [DOI] [PubMed] [Google Scholar]
- Chen G, Wang Y, Yang M, Xu J, Goh SJ, Pan M, Chen H. J Am Chem Soc. 2010;132(11):3644–3645. doi: 10.1021/ja9090885. [DOI] [PubMed] [Google Scholar]
- Dasary SS, Singh AK, Senapati D, Yu H, Ray PC. J Am Chem Soc. 2009;131(38):13806–13812. doi: 10.1021/ja905134d. [DOI] [PubMed] [Google Scholar]
- De Angelis F, Gentile F, Mecarini F, Das G, Moretti M, Candeloro P, Coluccio M, Cojoc G, Accardo A, Liberale C. Nat Photonics. 2011;5(11):682–687. [Google Scholar]
- Deng Y, Qi D, Deng C, Zhang X, Zhao D. J Am Chem Soc. 2008;130(1):28–29. doi: 10.1021/ja0777584. [DOI] [PubMed] [Google Scholar]
- Driskell JD, Lipert RJ, Porter MD. J Phys Chem B. 2006;110(35):17444–17451. doi: 10.1021/jp0636930. [DOI] [PubMed] [Google Scholar]
- Finney EE, Finke RG. J Colloid Interface Sci. 2008;317(2):351–374. doi: 10.1016/j.jcis.2007.05.092. [DOI] [PubMed] [Google Scholar]
- Gómez-Graña S, Pérez-Juste J, Alvarez-Puebla RA, Guerrero-Martínez A, Liz-Marzán LM. Adv Opt Mater. 2013;1(7):477–481. [Google Scholar]
- GrahamáCooks R. Chem Commun. 2005;15:1950–1952. [Google Scholar]
- Hakonen A, Andersson PO, Schmidt MS, Rindzevicius T, Käll M. Anal Chim acta. 2015;893:1–13. doi: 10.1016/j.aca.2015.04.010. [DOI] [PubMed] [Google Scholar]
- Hakonen A, Rindzevicius T, Schmidt MS, Andersson PO, Juhlin L, Svedendahl M, Boisen A, Käll M. Nanoscale. 2016;8(3):1305–1308. doi: 10.1039/c5nr06524k. [DOI] [PubMed] [Google Scholar]
- Hamad S, Podagatlapalli GK, Mohiddon MA, Soma VR. Appl Phys Lett. 2014;104(26):263104. [Google Scholar]
- Harvey SD, Fellows RJ, Cataldo DA, Bean RM. J Chromatogr A. 1990;518:361–374. [Google Scholar]
- He X, Wang H, Li Z, Chen D, Liu J, Zhang Q. Nanoscale. 2015;7(18):8619–8626. doi: 10.1039/c4nr07655a. [DOI] [PubMed] [Google Scholar]
- Jamil AK, Izake EL, Sivanesan A, Fredericks PM. Talanta. 2015b;134:732–738. doi: 10.1016/j.talanta.2014.12.022. [DOI] [PubMed] [Google Scholar]
- Jamil AK, Izake EL, Sivanesan A, Agoston R, Ayoko GA. Anal Methods. 2015a;7(9):3863–3868. [Google Scholar]
- Jeffryes C, Gutu T, Jiao J, Rorrer GL. Acs Nano. 2008a;2(10):2103–2112. doi: 10.1021/nn800470x. [DOI] [PubMed] [Google Scholar]
- Jeffryes C, Solanki R, Rangineni Y, Wang W, Chang Ch, Rorrer GL. Adv Mater. 2008b;20(13):2633–2637. [Google Scholar]
- Kneipp K, Wang Y, Kneipp H, Perelman LT, Itzkan I, Dasari RR, Feld MS. Phys Rev Lett. 1997;78(9):1667. doi: 10.1103/PhysRevLett.76.2444. [DOI] [PubMed] [Google Scholar]
- Ko H, Chang S, Tsukruk VV. Acs Nano. 2008a;3(1):181–188. doi: 10.1021/nn800569f. [DOI] [PubMed] [Google Scholar]
- Ko H, Singamaneni S, Tsukruk VV. Small. 2008b;4(10):1576–1599. doi: 10.1002/smll.200800337. [DOI] [PubMed] [Google Scholar]
- Kong X, Yu Q, Lv Z, Du X. Small. 2013;9(19):3259–3264. doi: 10.1002/smll.201203248. [DOI] [PubMed] [Google Scholar]
- Lee SJ, Guan Z, Xu H, Moskovits M. J Phys Chem C. 2007;111(49):17985–17988. [Google Scholar]
- Liu W, Chen D, Du W, Nichols KP, Ismagilov RF. Anal Chem. 2010;82(8):3276–3282. doi: 10.1021/ac100044c. [DOI] [PMC free article] [PubMed] [Google Scholar]
- Lopez S, Ortiz A. Semicond Sci Technol. 1994;9(11):2130. [Google Scholar]
- Lu Z, Ruan W, Yang J, Xu W, Zhao C, Zhao B. J Raman Spectrosc. 2009;40(1):112–116. [Google Scholar]
- Nie S, Emory SR. Science. 1997;275(5303):1102–1106. doi: 10.1126/science.275.5303.1102. [DOI] [PubMed] [Google Scholar]
- Pei Y, Wang Z, Zong S, Cui Y. J Mater Chem B. 2013;1(32):3992–3998. doi: 10.1039/c3tb00519d. [DOI] [PubMed] [Google Scholar]
- Ren F, Campbell J, Rorrer GL, Wang AX. Sel Top Quantum Electron IEEE J. 2014;20(3):127–132. doi: 10.1109/JSTQE.2014.2301016. [DOI] [PMC free article] [PubMed] [Google Scholar]
- Ren F, Campbell J, Wang X, Rorrer GL, Wang AX. Opt Express. 2013;21(13):15308–15313. doi: 10.1364/OE.21.015308. [DOI] [PubMed] [Google Scholar]
- Sefiane K, Ward CA. Adv Colloid Interface Sci. 2007;134:201–223. doi: 10.1016/j.cis.2007.04.020. [DOI] [PubMed] [Google Scholar]
- Shao J, Tong L, Tang S, Guo Z, Zhang H, Li P, Wang H, Du C, Yu XF. ACS Appl Mater Interfaces. 2015;7(9):5391–5399. doi: 10.1021/am508881k. [DOI] [PubMed] [Google Scholar]
- Stokes RJ, McBride E, Wilson CG, Girkin JM, Smith WE, Graham D. Appl Spectrosc. 2008;62(4):371–376. doi: 10.1366/000370208784046812. [DOI] [PubMed] [Google Scholar]
- Wang W, Gutu T, Gale DK, Jiao J, Rorrer GL, Chang C-h. J Am Chem Soc. 2009;131(12):4178–4179. doi: 10.1021/ja809079n. [DOI] [PubMed] [Google Scholar]
- Willets KA, Van Duyne RP. Annu Rev Phys Chem. 2007;58:267–297. doi: 10.1146/annurev.physchem.58.032806.104607. [DOI] [PubMed] [Google Scholar]
- Wu L, Wang Z, Zong S, Huang Z, Zhang P, Cui Y. Biosens Bioelectron. 2012;38(1):94–99. doi: 10.1016/j.bios.2012.05.005. [DOI] [PubMed] [Google Scholar]
- Xu X, Li H, Hasan D, Ruoff RS, Wang AX, Fan D. Adv Funct Mater. 2013;23(35):4332–4338. [Google Scholar]
- Yang J, Zhen L, Ren F, Campbell J, Rorrer GL, Wang AX. J Biophotonics. 2014;8(8):659–667. doi: 10.1002/jbio.201400070. [DOI] [PMC free article] [PubMed] [Google Scholar]
- Yang L, Ma L, Chen G, Liu J, Tian ZQ. Chem Eur J. 2010;16(42):12683–12693. doi: 10.1002/chem.201001053. [DOI] [PubMed] [Google Scholar]
- Yang W, Lopez PJ, Rosengarten G. Analyst. 2011;136(1):42–53. doi: 10.1039/c0an00602e. [DOI] [PubMed] [Google Scholar]
- Zapata F, López-López M, García-Ruiz C. Appl Spectrosc Rev. 2016;51(3):207–242. [Google Scholar]
- Zhang X, Zheng Y, Liu X, Lu W, Dai J, Lei DY, MacFarlane DR. Adv Mater. 2015;27(6):1090–1096. doi: 10.1002/adma.201404107. [DOI] [PubMed] [Google Scholar]
- Zhen L, Ford N, Gale DK, Roesijadi G, Rorrer GL. Biosens Bioelectron. 2016;79:742–748. doi: 10.1016/j.bios.2016.01.002. [DOI] [PubMed] [Google Scholar]
Associated Data
This section collects any data citations, data availability statements, or supplementary materials included in this article.