

Supplemental Digital Content is available in the text
Keywords: HIV, Neisseria, oral microbiome, periodontal disease
Abstract
HIV-associated periodontal diseases (PD) could serve as a source of chronic inflammation. Here, we sought to characterize the oral microbial signatures of HIV+ and HIV– individuals at different levels of PD severity.
This cross-sectional study included both HIV+ and HIV– patients with varying degrees of PD. Two tooth, 2 cheek, and 1 saliva samples were obtained for microbiome analysis. Mothur/SILVADB were used to classify sequences. R/Bioconductor (Vegan, PhyloSeq, and DESeq2) was employed to assess overall microbiome structure differences and differential abundance of bacterial genera between groups. Polychromatic flow cytometry was used to assess immune activation in CD4 and CD8 cell populations.
Around 250 cheek, tooth, and saliva samples from 50 participants (40 HIV+ and 10 HIV–) were included. Severity of PD was classified clinically as None/Mild (N), Moderate (M), and Severe (S) with 18 (36%), 16 (32%), and 16 (32%) participants in each category, respectively. Globally, ordination analysis demonstrated clustering by anatomic site (R2 = 0.25, P < 0.001). HIV status and PD severity showed a statistically significant impact on microbiome composition but only accounted for a combined 2% of variation. HIV+ samples were enriched in genera Abiotrophia, Neisseria, Kingella, and unclassified Neisseriaceae and depleted in Leptotrichia and Selenomonas. The Neisseria genus was consistently enriched in HIV+ participants regardless of sampling site and PD level. Immune markers were altered in HIV+ participants but did not show association with the oral microbiome.
HIV-associated changes in oral microbiome result in subtle microbial signatures along different stages of PD that are common in independent oral anatomic sites.
1. Introduction
Periodontal disease (PD) includes a number of inflammatory-based conditions such as gingivitis and periodontitis, which are the most common infectious diseases affecting tooth-supporting bone structures. Untreated periodontitis affects more than 700 million people worldwide,[1] can lead to tooth loss, and has been linked to conditions such as cardiovascular disease, diabetes mellitus, or obesity.[1]
Over the last 30 years, severe PD has been associated with HIV infection.[2] Although antiretroviral therapy (ART) preserves and restores immune function and prevents the development of opportunistic infections, individuals with sustained virological suppression continue to experience an increased incidence of age-related comorbidities (including PD) with synergistic effects on survival and quality of life. The determinants, course, and impact on other comorbid conditions of severe PD in the setting of ART remain a matter of controversy.[3,4]
In classical microbiology descriptions, increases in Porphyormonas gingivalis, Treponema denticola, and Tannerella forsythia, the so-called red complex, were strongly associated with destructive PD, whereas predominance of other bacterial complexes was associated to less severe PD.[5–8] The formation of plaque in mature teeth with an enriched proportion of Gram-negative anaerobic bacteria activates pro-inflammatory pathways and promotes the formation of periodontal pockets. These pockets allow for the local accumulation of anaerobic bacteria, against which the host response is inefficient and even counter-productive. With the arrival of new sequencing technologies, periodontitis has been linked to a broader disbyosis in the oral microbiome, initiated by changes in key pathogenic species with a context of accessory pathogens and their expression profiles. These changes promote a proinflammatory community and can trigger tissue destruction augmented by the host immune response.[9–16]
To date, research on the interplay between HIV infection, the oral microbiome, and PD has produced inconclusive results. A small study in children with only 5 HIV-negative controls found no evident differences in the oral microbiome composition between well-controlled HIV-positive and HIV-negative children.[17] In comparison, 15 subjects with AIDS attending HIV clinics in China showed significant increases in several bacteria, and a distinct salivary bacterial profile between necrotic and chronic PD.[18] Using a microbial microarray, there were significant differences in the salivary bacterial composition between HIV-positive subjects before and after ART initiation and between them and HIV-negative adults.[19] Moreover, an independent study revealed increased diversity in subgingival biofilms of HIV+ individuals within a Brazilian cohort of 32 subjects with PD.[20]
Here, we sought to characterize how HIV infection and other related factors modulate oral microbiome communities in different PD states using high throughput technologies and also identify specific oral microbiome markers of HIV infection.
2. Methods
2.1. Study design
This was a cross-sectional study including both HIV+ and HIV– participants with varying degrees of PD. HIV+ patients were recruited in the Oral Health Center of Infectious Disease Program at Grady Memorial Hospital located in Atlanta, GA. HIV-1 infection was documented by ELISA and confirmed by Western blot at any time prior to study entry. HIV– control samples were obtained from clinical and research staff at the same institution. HIV– participants were required to demonstrate HIV seronegativity in the prior 30 days before inclusion in the study by HIV free testing at the Infectious Disease Program Ponce Clinic.
PD was assessed by the oral exam using the Centers for Disease Control/merican Academy of Periodontology (CDC/AAP) criteria based on the tooth clinical attachment level (CAL) and the probing pocket depth (PPD):[21]
-
(1)
Severe PD (S-PD): both >2 interproximal sites with CAL >6 mm and >1 interproximal site with PPD >5 mm.
-
(2)
Moderate PD (M-PD): either >2 interproximal sites with CAL >4 mm or >2 interproximal site with PPD >5 mm.
-
(3)
Mild/none PD (N-PD): neither S-PD nor M-PD.
Exclusion criteria included: (A) fewer than 20 teeth in the oral cavity, (b) need for antibiotic prophylaxis for more than 12 hours prior to dental care as per the current American Dental Association guidelines or use of an antibiotic in the 14 days prior to the study visit, (c) use of an antimicrobial mouth rinse (0.12% chlorhexidine gluconate) 30 days prior to the study visit, (d) use of teeth whitening in the 30 days prior to the study visit, and (e) treatment of periodontal disease in the 30 days prior to the study visit. HIV+ patients were stratified by PD severity, whereas HIV– patients were only stratified at the analysis stage due to the limited number of controls available.
2.2. Sample collection
Each participant had data abstracted from the medical record at the time of enrolment which included demographics, date of HIV diagnosis, opportunistic infections, laboratory values including CD4 counts and HIV viral load levels, serologic status, major clinical events including hospitalizations and surgeries, antiretroviral history including adverse events to medications and other co-morbidities, lipids, hemoglobin A1C, HIV-associated conditions (infections, neoplasms, etc), other medical conditions (diabetes, hyperlipidemia), and recent antimicrobial use. In addition, whole blood was obtained from half of the participant for immune activation analysis.
Saliva, cheek mucosa, and teeth specimens were obtained from all participants and stored at –80°C. DNA was extracted within a week and stored at –20°C prior to 16 seconds gene amplification. A curette was used to obtain dental plaque samples from whole teeth, 1 posterior molar, and 1 anterior incisor, in all participants. In participants with PD, samples were taken from the deepest periodontal pocket of teeth that was representative of the participant PD severity. Finally, 2 cheek samples were obtained from each participant. One sample was obtained from the right cheek, and 1 sample was obtained from the left cheek.
Participants were also administered a semistructured questionnaire which assessed demographic data, HIV serostatus, antiretroviral use, oral health behaviors (brushing, flossing), tobacco/illicit drug/alcohol use, diet, use of antimicrobial mouth rinses, dental prosthetic devices or teeth whitening, prior oral/dental history, and utilization of dental care services (number of visits). A dental exam was performed on each participant to assess the missing, decayed, filled (MDF) index, CAL and PPD measurements and to identify other oral cavity conditions or diseases. Finally, a measure of xerostomia was performed involving pH and salivary flow rate measurements.
2.3. DNA extraction, 16 s rRNA gene amplification, and sequencing
Genomic DNA from all samples was extracted utilizing the MoBio PowerSoil DNA Isolation Kit (Cat # 12888–50) and quantified via Quant-iT PicoGreen dsDNA Assay (Cat # P11496). The 16 s V4 region was amplified through 30 cycles PCR with an F515 locus-specific primer (5′-TCGTCGGCAGCGTCAGATGTGTATAAGAGACAG-3′) and an 806R-locus specific primer (5′-GTCTCGTGGGCTCGGAGATGTGTATAAGAGACAG-3′) both with compatible overhang regions for index attachment.[22] PCR cleanup was performed using Agencourt AmpureXP magnetic beads (Cat # A63880). V4 fragments for all samples were indexed utilizing a second PCR reaction with Illumina Nextera Index XT Kit (Cat # FC-121–1012) and index-adhering primers (1.1: 5′-AATGATACGGCGACCACCGAGAT-3′; 2.1: 5′-CAAGCAGAAGACGGCATACGA-3′). Indexed fragments were purified with Ampure XP beads, quantified with dsDNA Picogreen, and pooled with respect to achieving equal molecular concentrations for all samples in the final library. About 250 paired-end sequencing was performed on the MiSeq platform using an Illumina MiSeq Version 2 500-cycle Kit (Cat # MS-102–2003) at a loading concentration of 10 picomolar. An Illumina PhiX control (Cat # FC-110–3001) was utilized in all MiSeq runs as recommended in the MiSeq System User Guide for metagenomic samples.
2.4. Data analysis
Sequence data were quality filtered with trimmomatic.[23] Eight out of 250 (3%) samples (that were represented by less than 1000 sequence counts) were discarded. Mothur phylotype pipeline[24] and SILVADB[25] /GreenGenes[26] databases were used to classify sequences at the genus level. Alpha diversity and richness multiple group comparisons were performed using rank based Mann Whitney or Kruskal–Wallis test combined with post-hoc Nemenyi test implemented in PMCMR R[27] packages. For taxonomical analysis, R/Bioconductor (Vegan,[28] PhyloSeq,[29] and DESeq2)[30] software packages were used. Richness and diversity were estimated using Chao1 and Shannon estimators respectively as implemented in the Vegan package. Principal Coordinates Analysis (PCoA) and weighted Unifrac distances were used for unconstrained ordination on genus proportions. Adonis was used to assess overall microbiome structure differences between defined groups. A negative binomial fit and Wald test were run on every genus to assess differential abundance. P-values were adjusted using the Benjamini–Hochberg correction.[31]
To predict the functional composition of the oral microbiome from 16S data, we used PICRUSt.[32] First, the phylotype table obtained by Mothur/GreenGenesDB was normalized by dividing the abundance of each organism by its predicted 16S copy number (script normalize_by_copy_number.py). To infer the gene content (script predict_metagenomes.py), the normalized phylotype abundances were multiplied by the respective set of gene abundances (represented by KEGG identifiers) estimated for each taxon. The gene content table obtained was used to analyze the metabolic pathways represented at different KEGG level categories structured in 3 hierarchical levels, using HUMAnN.[33] Finally, we identified putative biologically relevant pathways that characterized the different sites, HIV status and PD states by applying the LEfSe algorithm.[34]
2.5. Polychromatic flow cytometry
Flow cytometry and Boolean analysis were performed as previously described[35,36] with a few modifications. Briefly, 2 million peripheral blood mononuclear cells were re-suspended in 100 μL of RPMI plus 10% fetal bovine serum (FBS) in a 5 mL polypropylene tube. Cells were washed once with cold phosphate-buffered saline (PBS) containing 2% FBS, surface stained at room temperature for 30 minutes with antibodies specific to human CD4, CD3, CD8, HLA-DR, and CD38 each conjugated to a different fluorophore. Cells were fixed with cytofix/cytoperm (BD Pharmingen) and permeabilized with 1X permwash (BD Pharmingen). Cells were then incubated with antihuman Ki-67 antibody conjugated to a different fluorochrome for 30 minutes at 4°C. Cells were washed twice with 1 X Permwash, once with 2% Fetal bovine serum(FBS) in phosphate buffered saline (PBS and re-suspended in 1% formalin in PBS. Cells were acquired on the LSRII (BD Immunocytometry systems) and analyzed using the FlowJo software (Treestar, Inc., San Carlos, CA). Lymphocytes were identified based on their scatter pattern, and CD3+, CD8-, CD4+ cells were considered as CD4 T cells, whereas CD3+, CD8+, CD4- cells were considered as CD8 T cells. CD38+, HLA-DR+ or Ki-67+ T cells were further defined on total CD4 or CD8 T cells. Using the CD38, Ki-67 and HLA-DR gates, a Boolean analysis was performed to calculate the frequencies of the 7 different combinations of subsets using the Flowjo software.
Correlation between every bacterial genus/PCoA axis and immune markers was performed through the fit of a linear model for each combination of immune marker. The Benjamini–Hochberg[31] method was used for adjustment of multiple comparisons error.
2.6. Ethics approval and consent to participate
The study was approved by the Emory University IRB under the title “The Oral Metagenomics Study” (IRB00048095). All participants provided informed consent.
3. Results
This was a cross-sectional study including 50 participants. Participant population characteristics and dental exam information are shown in Table S1a, S1b, and S1c, respectively. Each participant contributed saliva, tooth samples from 2 teeth, and 2 cheek mucosa samples. Of these participants, 40 (80%) were HIV+. Only one of these participants was ART naive. Only 8 of the total participants had a detectable viral load, and 3 of these 8 had a viral load that was less than 1000 copies per mL. Although HIV+ participants tended to be homosexual older men compared to the HIV– participants, the study population was well balanced with regard to PD status. A total of 18 (36%), 16, and 16 (32%) of the participants presented none/mild (N-PD), moderate (M-PD), and severe (S-PD) PD, respectively. There were no significant differences in the salivary flow rate, MDF (missing, decayed, filled teeth), or salivary buffering capacity between N and M/S-PD participants. 242 of the samples provided more than 1000 sequences and were used for downstream analyses. Of these, 94/100, 49/50, and 99/100 were cheek, saliva, and teeth samples, respectively. A total of 148/408 (36.3%) different bacterial genera provided more than 100 counts and were kept for further analyses.
3.1. Microbiome analysis
When all sample sites were analyzed together, bacterial diversity but not richness was consistently higher in tooth samples than in both cheek and saliva samples through all PD stages and in both HIV-positive and -negative participants (P < 0.001 for all comparisons, Fig. 1 and Fig. S1). Importantly, greater similarity was found in the same participant teeth and cheek samples (Fig. S6) than between participants. Alpha diversity measures regarding HIV infection were less consistent. HIV– samples showed higher richness measures only in the M-PD group (P < 0.05), whereas this tendency was reversed in diversity for the S-PD group (P < 0.01). Additionally, S-PD was associated with higher richness and diversity measures, but only in cheek samples.
Figure 1.
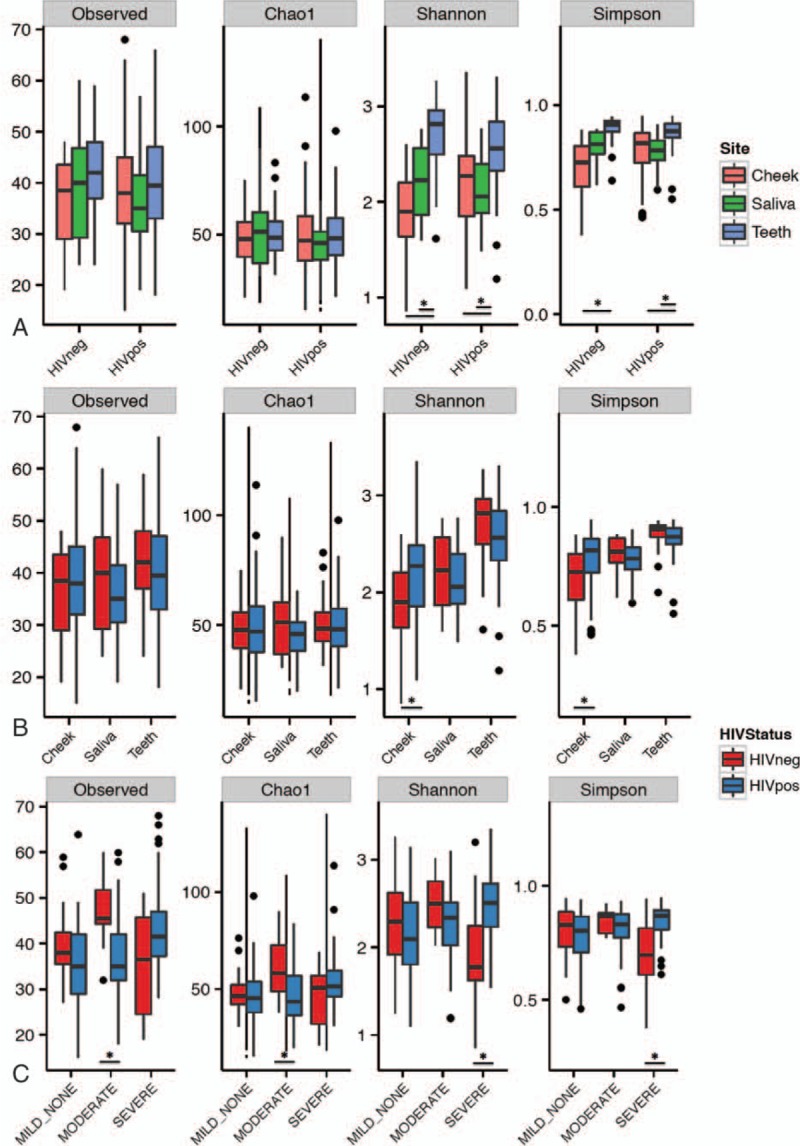
Richness (observed species, Chao1 indices) and diversity (Shannon and Simpson indices) for different sampling sites by HIV infection status (A), HIV infection status by sampling site (B), and by PD and HIV infection status (C). HIV = human immunodeficiency virus, PD = periodontal disease.
PCoA ordination analyses showed a clear differentiation of microbial structure among body sites sampled (adonis test P value = 0.001, R2 = 0.20, Fig. 2), whereas HIV status and PD severity showed a statistically significant but marginal contribution to microbial structure differentiation (HIV: adonis P value = 0.008, R2 = 0.01, PD: adonis P value = 0.092, R2 = 0.01, Fig. S2), which was of similar magnitude to that of ethnicity (EthnicGroup adonis P value = < 0.005, R2 = 0.03) and sexual behaviour (SexBeh, adonis P value = <0.05, R2 = 0.02). According to stratified analysis these factors lost statistical significance on saliva, but not for cheek and teeth samples, whereas habits such as tobacco (adonis P value = <0.05, R2 = 0.05) and soda drink (adonis P value = <0.05, R2 = 0.06) consumption became statistically relevant. Ethnicity had the largest effect on teeth (adonis P value< = 0.01, R2 = 0.07) and cheek (adonis P value< = 0.001, R2 = 0.17) samples. Importantly, PD effects on oral microbiome were only significant for cheek (adonis P value< = 0.01, R2 = 0.06) but not for teeth or saliva samples, whereas HIV infection exerted a similar effect on cheek (adonis P value = 0.05, R2 = 0.02) and teeth samples (adonis P value<0.01, R2 = 0.03) but had no significant impact in saliva samples.
Figure 2.
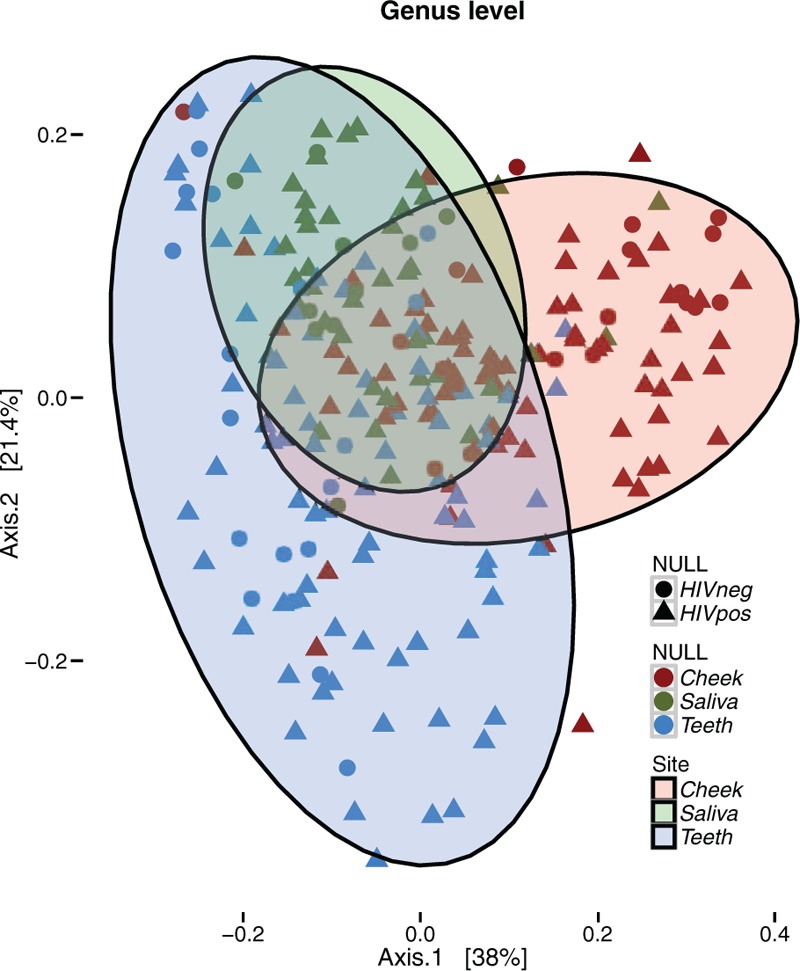
PCoA ordination analysis. Axes 1 and 2 capture 58% of the variance observed in the microbiome structure of all oral samples. According to PERMANOVA analysis, sampling site explained 20% of the oral microbiome structure (adonis test P value = 0.001, R2 = 0.20). 10% was evenly explained by other factors such as HIV infection (adonis test P value = 0.001, R2 = 0.01), ethnicity (adonis test P value = 0.001, R2 = 0.03), sexual behaviour (adonis test P value = 0.006, R2 = 0.02) and periodontal disease severity (adonis test P value = 0.003, R2 = 0.02). HIV = human immunodeficiency virus, PCoA = principal coordinates analysis.
Firmicutes was the most abundant phylum in all sampling sites followed by Actinobacteria, Bacteroidetes, Fusobacteria, and Proteobacteria, whose relative abundance order changed depending on sampling site (Fig. S3). Differences linked to HIV infection affected the Proteobacteria phylum, which was overabundant in HIV+ cheek (log 2 Fold-Change (log 2 FC)):1.08, Padj<0.0051) and teeth samples (log2FC:1.23, Padj<0.005),(Table S2) although there was no correlation of Proteobacteria abundance with viral load (VL) or CD4+ counts within the HIV-positive group (data not shown). Changes in phylum abundance with PD severity were more frequent. Synergistetes and Spirochaetae, both low abundant phyla, were consistently found to be more abundant in teeth, cheek, and saliva samples from the S-PD group versus N-PD, whereas Proteobacteria and Firmicutes phyla had a 2-fold reduction in cheek and saliva, but not in teeth S-PD affected samples.
HIV infection status was also associated with relative abundance changes of different bacterial genera. In particular, Neisseria and genera of the unclassified Neisseriaceae family were 4-fold more abundant in samples from HIV+ participants (log 2 FC = 1.84, Padj < 0.001, Table 1 and Fig. 3). Interestingly, this change in abundance was consistent through the different anatomical sites, although with different levels of significance as well as in the age and sexual behavior adjusted model (Table S5). Importantly, the Neisseria genus was also more abundant in samples from HIV+ participants through varying severity of PD, with similar fold-change values (log 2 FC) with respect to HIV– samples (see Table S3 & S4). Interestingly, Aggregatibacter genus abundance was higher in HIV+ N-PD samples (log 2 FC = 2.02, Padj < 0.005), but not in more advanced PD stages. Furthermore, 3 different genera (Abiotrophia, Rothia and unclassified Pasteurellaceae) that were uniquely enriched in cheek HIV+ N-PD samples, were otherwise overabundant in M-PD and S-PD teeth, but not saliva samples, suggesting a tissue shift of these genera along PD severity (Table S4). Other genera were found to be differentially abundant in either HIV+ teeth, saliva or cheek samples, but not generally, in such a way that HIV associated changed in microbial genera were found to be localized to single site/PD severity combinations.
Table 1.
Genus level significant changes in abundance associated with HIV infection (HIV+) stratified by severity of PD.
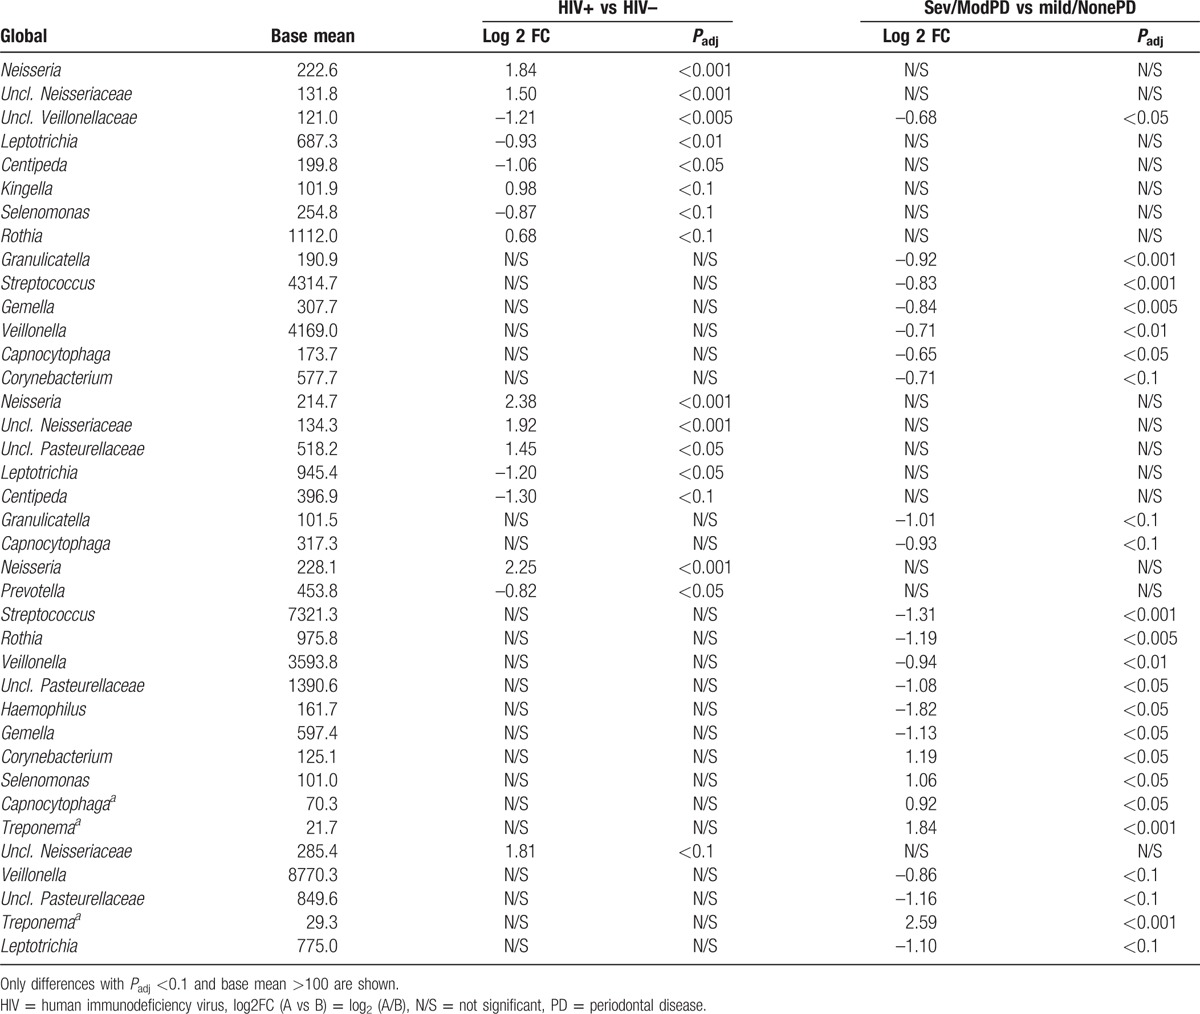
Figure 3.
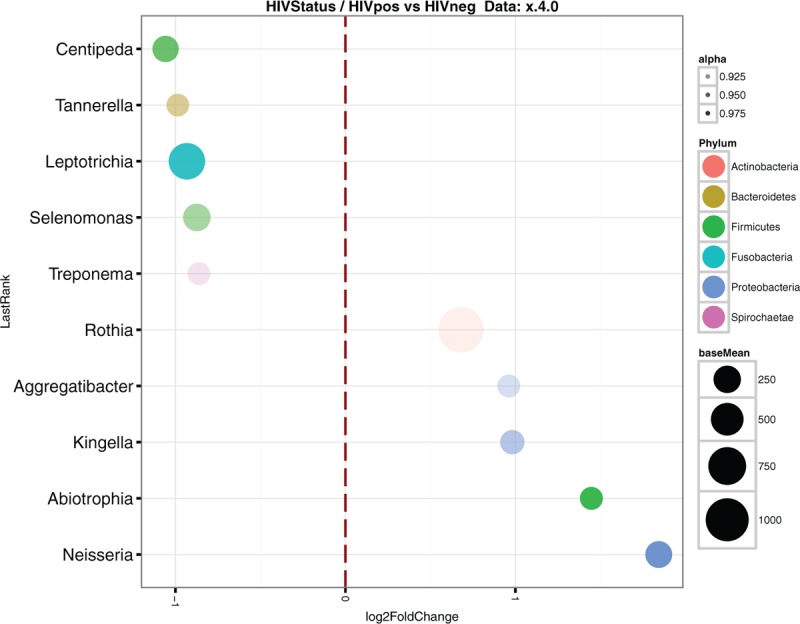
Classified differential abundant genera between HIV+ and HIV– samples. Log 2 Fold Change is plotted on the X-axis. Phyla is indicated using color codes. Point size indicates the mean count for a particular genus on the whole sample set. HIV = human immunodeficiency virus.
Of the bacterial genera that are traditionally linked to PD[6] only Treponema genus was found to be overabundant in S-PD when compared to N-PD, when HIV infection was not considered, in both cheek (log 2 FC = 1.83, Padj < 0.005) and saliva (log 2 FC = 2.6, Padj < 0.001) samples, albeit in very low abundance (Table 1). These were accompanied by other genera, underlining the complex multicomponent nature of microbiome disbyosis with PD. Cheek samples showed the greatest number of differentially abundant bacterial genera along PD severity. Severe PD was associated, with a 2-fold reduction in highly abundant Streptococcus, Veillonella genera, and unclassified Pasteurellaceae family, whereas the 2 latter also showed similar under-abundance in saliva samples. Interestingly, the Neisseria genus was not found to be over- or under-represented in different PD stages.
3.2. Immune activation
Immune activation markers were available for a subset of 24 participants (8 N-PD, 8 M-PD, and 8 S-PD), whereas CD4 counts were only available for the subset of HIV-positive participants. Despite the fact most HIV-positive participants were receiving ART (see Table S1c), there was a strong association between HIV infection and immune activation, proliferation, and translocation markers (Fig. 4). This association was also found for CD4+ T cell counts and PD severity, showing a higher CD4+ count in N-PD participants, indicating a deterioration of the immune system both with moderate or severe PD. Interestingly, immune markers for proliferation were found to be higher both for the CD8 and CD4 T-cell subset in moderate M-PD than in both N-PD and S-PD, whereas markers for cell activation were not significantly differently across PD severity.
Figure 4.
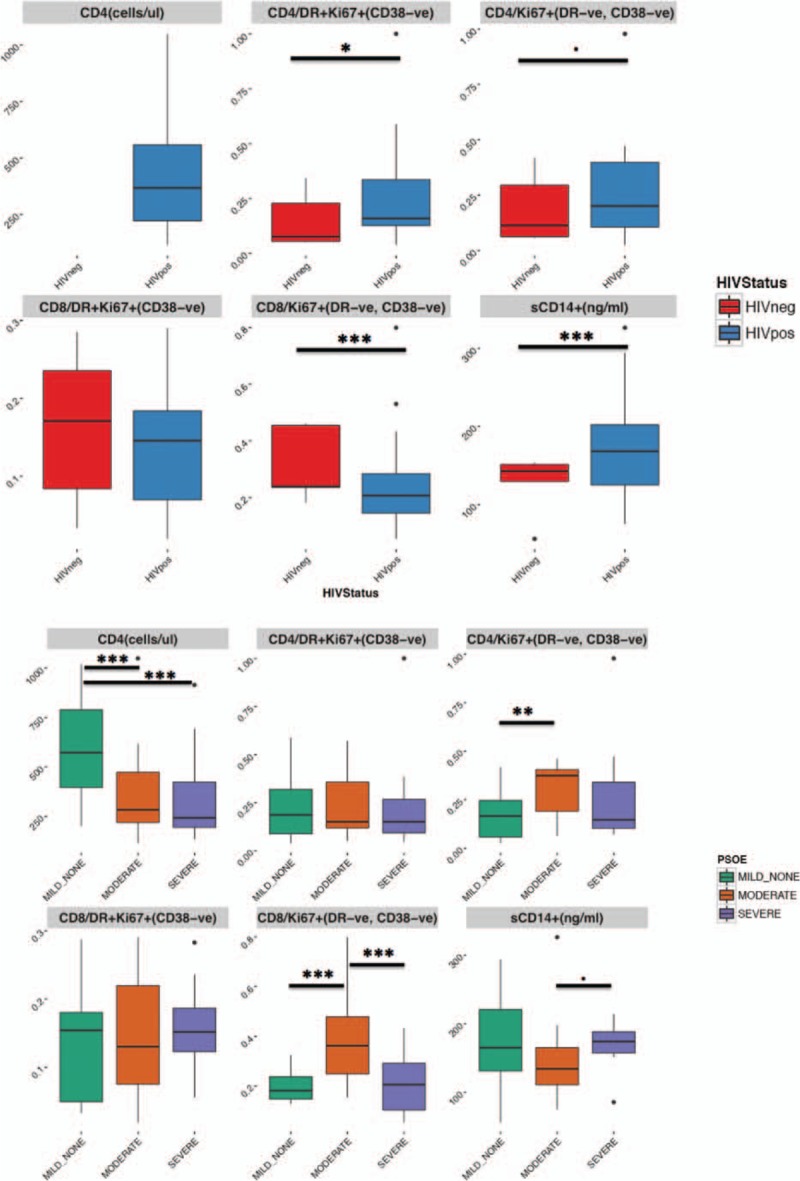
Immune activation, proliferation, and bacterial translocation markers according to the HIV infection and the PD stage. Y-axis values for immune markers represent proportion of CD4/CD8 population resulting of the gate strategy described in the plot title. CD4+ T-cell counts were unavailable for HIV– subjects. HIV = human immunodeficiency virus, PD = periodontal disease.
Immune activation markers were correlated with both genus abundance and projection of each of the samples against each of the first 3 ordination PCoA axes from the analysis segregated by sampling. A strong and significant correlation was found between HLA-DR+/Ki67+/CD38- cell subset and increasing abundance of Streptococcus genus (R2 = 0.61, Padj (FDR)<0.001, Fig. S4), only in saliva samples. In addition, none of the immune activation markers nor CD4+ T cell counts showed a significant correlation with any of the PCoA axes (data not shown) in any sampling site type. Interestingly, a 4-fold depletion of the Streptococcus genus was associated with HIV+ status in cheek S-PD samples. Although this depletion in cheek samples was not accompanied by significant changes in teeth or saliva S-PD samples, there was a general and significant trend towards Streptococcus depletion globally in S-PD HIV+ participants, whereas this genus was enriched in N-PD HIV+ participants.
3.3. Functional analysis
Functional analysis using the PiCRUSt inferred gene content also revealed major differences among sampling sites (Fig. S5). Teeth samples were enriched in cell motility pathways including chemotaxis and flagellar assembly, probably reflecting tooth biofilm formation. Genes within carbohydrate, vitamins, and lipid metabolism pathways were enriched in cheek samples. No significant differences in the functional gene content could be consistently linked to HIV infection in any PD severity or anatomic site. In combination with taxonomical analysis and the lack of correlation between HIV-linked bacterial genera and inflammation, this underlines the nonpathogenic character of the increased abundance of Neisseria genus and suggests the pathobiont nature of this genus in the context of HIV-associated PD.[37]
4. Discussion
This study adds important information to the paucity of publications examining the effect of HIV status on the human oral microbiome. As reported in other studies, major differences in microbiome structure and composition were associated with the anatomic sampling site of patients, underscoring the great diversity and biogeography within the oral microbiome.
Globally, PD severity was associated with a broader change within the oral microbiome than HIV infection. PD affected a high number of bacterial genera, and these changes were of greater magnitude due to the mean abundance of affected genera and showed specificity for the sampling site. For instance, Veillonella and Streptococcus, both dominant genera in cheek mucosa and saliva, had a 2-fold reduction, thus contributing to alpha-diversity increases detected in these 2 sampling sites with PD severity. In addition, low-abundant members of the Treponema genus belonging to the PD-associated red complex were also enriched in severe PD samples. Conversely, differences in Tannerella and Porphyromonas genera along PD were not observed in this dataset. In our study, these genera were found at very low abundances (0.2% and 2.3%, mean abundances, respectively) in teeth and not differentially abundant along PD severity. Interestingly, Hong et al described 2 types of microbial communities in a PD-affected general population. Only one of them was enriched in Tannerella and Porphyromonas and associated to PD severity.[38] Our results may indicate that HIV infection may result in a bias in the dysbiotic pathway toward PD.
HIV infection solely affected a few low-abundance bacterial genera, including Neisseria, which was 4-fold enriched in 3 independent oral sampling sites. The Neisseria genus has been previously found to be depleted in the subgingival plaque of smokers,[39] whereas other sampling sites have not been explored to this respect. In our dataset, smoking also had a depleting effect in the 3 different sampling sites. Although it cannot be absolutely ruled out that other confounding factors may be affecting our results, our study design was well-balanced and no significant interaction between smoker status and HIV infection was detected. Furthermore, the Neisseria genus enrichment was still associated with HIV infection in the nonsmoker subset (log 2 FC = 1.48, Padj<0.05), although statistical significance was marginally lost for the smoker smaller subset (log 2 FC = 1.1, Padj = 0.15). Also, sexual behavior has been linked to changes in the gut microbiome.[40] Although, in our dataset, HIV infection was enriched in men who had sex with men, this factor alone had a small effect on the oral microbiome structure (adonis test R2 = 0.02, Pr (>F) = 0.032) and the age and sexual behavior adjusted model provided a similar picture in bacterial differential abundance than the unadjusted one. Several species that belong to the Neisseria genus such as N bacilliformis and N elongata, considered as nonpathogenic[41,42] or related to PD,[16] have been associated with respiratory and oral cavity infections.[43] The role of oral Neisseria genus in HIV infection has attracted limited attention; the few published studies using distinct sampling techniques had contradictory results. Recently, N. elongata was found to be enriched in the salivary microbiome of AIDS patients,[18] but minor nonsignificant changes in this genera were found between HIV-positive participants before and after commencing ART and when compared to seronegative participants in another study.[19] In addition, colonization of N flavescens was lower in the lingual microbiome of HIV-positive patients receiving ART than in HIV-negative controls.
Of note, no relation between Neisseria and Neisseriaceae family abundance and immune activation markers could be detected. This could be explained both by the commensal nonpathogenic nature of Neisseria genus and by a potential competitive advantage in HIV+ participants that affected all sampling sites, even under ART.
5. Conclusions
PD and HIV infection were associated with significant microbiome changes within anatomic sampling sites. Three major findings were uncovered in this analysis: (1) Neisseria spp. appeared to be enriched in HIV-positive participants compared to HIV-negative participants across all sampling sites, (2) among HIV+ participants Abiotrophia, Rothia, and unclassified Pasteurellaceae were enriched in M-PD and S-PD compared to N-PD, and (3) Treponema spp. were enriched in S-PD compared to N-PD for all participants. PD moderate severity was associated with higher CD4 and CD8 proliferation; however, associations with other inflammatory parameters relevant for HIV pathogenicity were not found.
Although Neisseria genus was found to be enriched in the oral microbiome of HIV-positive participants, it showed no linkage to either inflammation, immune parameters, or functional gene content. Relative abundance increase was consistently found in teeth, cheek mucosa, and saliva samples and in samples from participants with mild or no PD, but also moderate and severe PD. Changes in other bacterial genera related to HIV infection were scarce and had a very limited effect on bacterial diversity.
Acknowledgments
The authors would like to express our deepest admiration and appreciation for the patients who participated in the study and the work of the Ponce Clinic at Grady Memorial Hospital for their commitment to improve patient care and support research. The tremendous contributions on the part of the Oral Health Center staff have been essential to the success of this study. The authors acknowledge the contribution study coordinators, Lebo Tsotetsi, and Ulochi Nwagwu as well as the dental staff, Anthony Rozier and Spencer Waddell. They thank the IGTP Bioinformatics core facility staff for their contribution to this publication.
This work was presented in part at 2015 International Human Microbiome Conference (IHMC 2015), March 31st–April 2nd, Luxembourg, Poster #292.
Supplementary Material
Supplementary Material
Footnotes
Abbreviations: HIV = human immunodeficiency virus, CDC/AAP = Centers for Disease Control/American Academy of Periodontology, KEGG = Kyoto Encyclopedia of Genes and Genomes, LEFSE = LDA effect size, PCoA = principal coordinates analysis, PICRUSt = Phylogenetic Investigation of Communities by Reconstruction of Unobserved States, PD = periodontal disease, HAART = highly active antiretroviral therapy, VL = viral load.
TDR and VCM contributed equally.
Data availability: Metagenomics raw sequencing data along with sample level metadata have been deposited using the NCBI/SRA Web service and compliance to MIMARKS standard. Data can be accessed using SRA accession SRP079702.
Funding: This work was supported by the Emory University Center for AIDS Research (CFAR) (V.C.M., P30AI050409). TR acknowledges funding from Emory University Development Funds. M.N-J, J.R, Y.G. and R.P acknowledge funds from the Gala contra la SIDA 2013 and 2014 editions, the Nit per la Recerca a la Catalunya Central 2015 edition and the Red de investigación en SIDA, RD12/0017/0002 as part of the Plan Nacional R + D + I and cofinanced by the Instituto de Salud Carlos III (ISCIII)-Subdirección General de Evaluación y el Fondo Europeo de Desarrollo Regional (FEDER). J.R. is supported through a grant for pre-doctoral studies from Noel Alimentaria to the University of Vic (UVic-UCC).
Authorship: VCM and TDR conceived and designed the study. DR recruited the study participants, performed their clinical evaluations and collected samples. VCM, DR, MLN, and SM collected and organized data. DR and JMP processed samples, prepared DNA libraries, and performed sequencing. SK performed the inflammation analysis. MN-J, YG, EVH, and SJJ performed bioinformatics sequence analysis. JR performed statistical analysis (JR under the supervision of MN-J and RP). YG ran functional inference analysis under the supervision of MN-J, RP, VCM, and TDR interpreted results. MN-J, RP, TDR, and VCM wrote manuscript, which was reviewed, edited, and approved by all authors.
The authors have no conflicts of interest to disclose.
Supplemental Digital Content is available for this article.
References
- [1].Kassebaum NJ, Bernabé E, Dahiya M, et al. Global burden of untreated caries: a systematic review and metaregression. J Dent Res 2015;94:650–8. [DOI] [PubMed] [Google Scholar]
- [2].Ryder MI, Nittayananta W, Coogan M, et al. Periodontal disease in HIV/AIDS. Periodontol 2000 2012;60:78–97. [DOI] [PubMed] [Google Scholar]
- [3].John CN, Stephen LX, Joyce Africa CW. Is human immunodeficiency virus (HIV) stage an independent risk factor for altering the periodontal status of HIV-positive patients? A South African study. BMC Oral Health 2013;13:69. [DOI] [PMC free article] [PubMed] [Google Scholar]
- [4].Dang AT, Cotton S, Sankaran-Walters S, et al. Evidence of an increased pathogenic footprint in the lingual microbiome of untreated HIV infected patients. BMC Microbiol 2012;12:153. [DOI] [PMC free article] [PubMed] [Google Scholar]
- [5].Socransky SS, Haffajee AD, Cugini MA, et al. Microbial complexes in subgingival plaque. J Clin Periodontol 1998;25:134–44. [DOI] [PubMed] [Google Scholar]
- [6].Holt SC, Ebersole JL. Porphyromonas gingivalis, Treponema denticola, and Tannerella forsythia: the “red complex”, a prototype polybacterial pathogenic consortium in periodontitis. Periodontol 2000 2005;38:72–122. [DOI] [PubMed] [Google Scholar]
- [7].Byrne SJ, Dashper SG, Darby IB, et al. Progression of chronic periodontitis can be predicted by the levels of Porphyromonas gingivalis and Treponema denticola in subgingival plaque. Oral Microbiol Immunol 2009;24:469–77. [DOI] [PubMed] [Google Scholar]
- [8].Kumar PS, Griffen AL, Barton JA, et al. New bacterial species associated with chronic periodontitis. J Dent Res 2003;82:338–44. [DOI] [PubMed] [Google Scholar]
- [9].Wang GP. Defining functional signatures of dysbiosis in periodontitis progression. Genome Med 2015;7:40. [DOI] [PMC free article] [PubMed] [Google Scholar]
- [10].Hajishengallis G, Lamont RJ. Beyond the red complex and into more complexity: the polymicrobial synergy and dysbiosis (PSD) model of periodontal disease etiology. Mol Oral Microbiol 2012;27:409–19. [DOI] [PMC free article] [PubMed] [Google Scholar]
- [11].Duran-Pinedo AE, Chen T, Teles R, et al. Community-wide transcriptome of the oral microbiome in subjects with and without periodontitis. ISME J 2014;8:1659–72. [DOI] [PMC free article] [PubMed] [Google Scholar]
- [12].Jorth P, Turner KH, Gumus P, et al. Metatranscriptomics of the human oral microbiome during health and disease. MBio 2014;5:e01012–1014. [DOI] [PMC free article] [PubMed] [Google Scholar]
- [13].Griffen AL, Beall CJ, Campbell JH, et al. Distinct and complex bacterial profiles in human periodontitis and health revealed by 16S pyrosequencing. ISME J 2012;6:1176–85. [DOI] [PMC free article] [PubMed] [Google Scholar]
- [14].Kirst ME, Li EC, Alfant B, et al. Dysbiosis and alterations in predicted functions of subgingival microbiome in chronic periodontitis. Appl Environ Microbiol 2015;81:783–93. [DOI] [PMC free article] [PubMed] [Google Scholar]
- [15].Abusleme L, Dupuy AK, Dutzan N, et al. The subgingival microbiome in health and periodontitis and its relationship with community biomass and inflammation. ISME J 2013;7:1016–25. [DOI] [PMC free article] [PubMed] [Google Scholar]
- [16].Liu B, Faller LL, Klitgord N, et al. Deep sequencing of the oral microbiome reveals signatures of periodontal disease. PLoS One 2012;7:e37919. [DOI] [PMC free article] [PubMed] [Google Scholar]
- [17].Goldberg BE, Mongodin EF, Jones CE, et al. The oral bacterial communities of children with well-controlled HIV infection and without HIV infection. PLoS One 2015;10:e0131615. [DOI] [PMC free article] [PubMed] [Google Scholar]
- [18].Zhang F, He S, Jin J, et al. Exploring salivary microbiota in AIDS patients with different periodontal statuses using 454 GS-FLX Titanium pyrosequencing. Front Cell Infect Microbiol 2015;5:55. [DOI] [PMC free article] [PubMed] [Google Scholar]
- [19].Li Y, Saxena D, Chen Z, et al. HIV infection and microbial diversity in saliva. J Clin Microbiol 2014;52:1400–11. [DOI] [PMC free article] [PubMed] [Google Scholar]
- [20].Ferreira DC, Gonçalves LS, Siqueira JF, et al. Subgingival bacterial community profiles in HIV-infected Brazilian adults with chronic periodontitis. J Periodontal Res 2015;51:95–102. [DOI] [PubMed] [Google Scholar]
- [21].Eke PI, Page RC, Wei L, et al. Update of the case definitions for population-based surveillance of periodontitis. J Periodontol 2012;83:1449–54. [DOI] [PMC free article] [PubMed] [Google Scholar]
- [22].Caporaso JG, Lauber CL, Walters WA, et al. Ultra-high-throughput microbial community analysis on the Illumina HiSeq and MiSeq platforms. ISME J 2012;6:1621–4. [DOI] [PMC free article] [PubMed] [Google Scholar]
- [23].Bolger AM, Lohse M, Usadel B. Trimmomatic: a flexible trimmer for Illumina sequence data. Bioinformatics 2014;30:2114–20. [DOI] [PMC free article] [PubMed] [Google Scholar]
- [24].Schloss PD, Westcott SL, Ryabin T, et al. Introducing mothur: open-source, platform-independent, community-supported software for describing and comparing microbial communities. Appl Environ Microbiol 2009;75:7537–41. [DOI] [PMC free article] [PubMed] [Google Scholar]
- [25].Quast C, Pruesse E, Yilmaz P, et al. The SILVA ribosomal RNA gene database project: improved data processing and web-based tools. Nucleic Acids Res 2013;41:D590–6. [DOI] [PMC free article] [PubMed] [Google Scholar]
- [26].DeSantis TZ, Hugenholtz P, Larsen N, et al. Greengenes, a chimera-checked 16S rRNA gene database and workbench compatible with ARB. Appl Environ Microbiol 2006;72:5069–72. [DOI] [PMC free article] [PubMed] [Google Scholar]
- [27].R Development Core Team (2008). R: A language and environment for statistical computing. R Foundation for Statistical Computing, Vienna, Austria. URL http://www.R-project.org. [Google Scholar]
- [28].Oksanen J, Blanchet FG, Friendly M, et al. vegan: Community Ecology Package. 2016. https://CRAN.R-project.org/package=vegan. [Google Scholar]
- [29].McMurdie PJ, Holmes S. phyloseq: an R package for reproducible interactive analysis and graphics of microbiome census data. PLoS One 2013;8:e61217. [DOI] [PMC free article] [PubMed] [Google Scholar]
- [30].Love MI, Huber W, Anders S. Moderated estimation of fold change and dispersion for RNA-seq data with DESeq2. Genome Biol 2014;15:550. [DOI] [PMC free article] [PubMed] [Google Scholar]
- [31].Hochberg Y, Benjamini Y. More powerful procedures for multiple significance testing. Stat Med 1990;9:811–8. [DOI] [PubMed] [Google Scholar]
- [32].Langille MGI, Zaneveld J, Caporaso JG, et al. Predictive functional profiling of microbial communities using 16S rRNA marker gene sequences. Nat Biotechnol 2013;31:814–21. [DOI] [PMC free article] [PubMed] [Google Scholar]
- [33].Abubucker S, Segata N, Goll J, et al. Metabolic reconstruction for metagenomic data and its application to the human microbiome. PLoS Comput Biol 2012;8:e1002358. [DOI] [PMC free article] [PubMed] [Google Scholar]
- [34].Segata N, Izard J, Waldron L, et al. Metagenomic biomarker discovery and explanation. Genome Biol 2011;12:R60. [DOI] [PMC free article] [PubMed] [Google Scholar]
- [35].Kannanganat S, Kapogiannis BG, Ibegbu C, et al. Human immunodeficiency virus type 1 controllers but not noncontrollers maintain CD4 T cells coexpressing three cytokines. J Virol 2007;81:12071–6. [DOI] [PMC free article] [PubMed] [Google Scholar]
- [36].Kannanganat S, Ibegbu C, Chennareddi L, et al. Multiple-cytokine-producing antiviral CD4 T cells are functionally superior to single-cytokine-producing cells. J Virol 2007;81:8468–76. [DOI] [PMC free article] [PubMed] [Google Scholar]
- [37].Chow J, Tang H, Mazmanian SK. Pathobionts of the gastrointestinal microbiota and inflammatory disease. Curr Opin Immunol 2011;23:473–80. [DOI] [PMC free article] [PubMed] [Google Scholar]
- [38].Hong BY, Araujo MVF, Strausbaugh LD, et al. Microbiome profiles in periodontitis in relation to host and disease characteristics. PLoS One 2015;10:e0127077. [DOI] [PMC free article] [PubMed] [Google Scholar]
- [39].Shchipkova AY, Nagaraja HN, Kumar PS. Subgingival microbial profiles of smokers with periodontitis. J Dent Res 2010;89:1247–53. [DOI] [PMC free article] [PubMed] [Google Scholar]
- [40].Noguera-Julian M, Rocafort M, Guillén Y, et al. Gut microbiota linked to sexual preference and HIV infection. EBioMedicine 2016;5:135–46. [DOI] [PMC free article] [PubMed] [Google Scholar]
- [41].Bik EM, Long CD, Armitage GC, et al. Bacterial diversity in the oral cavity of 10 healthy individuals. ISME J 2010;4:962–74. [DOI] [PMC free article] [PubMed] [Google Scholar]
- [42].Wade WG. The oral microbiome in health and disease. Pharmacol Res 2013;69:137–43. [DOI] [PubMed] [Google Scholar]
- [43].Han XY, Hong T, Falsen E. Neisseria bacilliformis sp. nov. isolated from human infections. J Clin Microbiol 2006;44:474–9. [DOI] [PMC free article] [PubMed] [Google Scholar]
Associated Data
This section collects any data citations, data availability statements, or supplementary materials included in this article.