Abstract
The effects of residual cannabis use on emotional expression recognition and the P3 event-related potential in participants who scored highly for subclinical depression were investigated. Comparisons were made between participants who were classified as depressed or nondepressed cannabis users, depressed non-cannabis users and controls who neither used cannabis nor were characterized as being depressed. In an emotional expression recognition task, participants were asked to respond to faces depicting happy, angry, fearful, and neutral faces either implicitly, explicitly, or empathically. Residual cannabis use and mood was shown to modulate the P3 event related potential during the task. There was a significant reduction in the P3 amplitude between depressed and nondepressed participants. Residual cannabis use further reduced the P3 amplitude with the greatest deficits being associated with cannabis users who scored highly for subclinical depression. These effects were greatest for explicit and empathic processing of faces depicting negative emotions. We conclude from our study that cannabis and mood state interact to reduce the amplitude of the P3 which has been associated with attention to emotion.
Keywords: cannabis, emotion processing, event related potentials, P3, subclinical depression
1. Introduction
The modulation of mood and emotion processing by phytocannabinoids has become of significant interest in recent years especially given that 28 states and Washington, D.C., now approve the use of cannabis for medicinal purposes. Interestingly, cannabis is not approved to treat mood disorders in any of the states in which it is legal. A great deal of research over the last 10 years has investigated the efficacy of using phytocannabinoids to treat depression (e.g., [1–4]); however, it must be noted that there is conflicting data as to the effects of cannabis on both emotion processing and treatment for mood disorders. In a review of the literature, Degenhardt et al[3] suggested there was a risk of depression associated with long-term heavy cannabis use, but not with casual use. Similarly, Horwood et al[4], in a meta-analysis, showed an increase in depressive symptoms with increased cannabis use: this effect was greatest in adolescents. Similar studies have shown a significant link between cannabis use, emotion processing, and depression [e.g.].[5–8] It is important to note many of the studies implicating cannabis in depression do not control for a specific type of phytocannabinoids, strength, and route of administration, which varies between studies. There has been a significant increase in the strength of delta 9 tetrahydrocannabinol (THC) the psychoactive compound in cannabis over time. For example, ElSohly et al[9] reported on the potency of drug enforcement agency seizures over the last 2 decades showing an increase of potency from 4% in 1995 to 12% in 2014. As well as this change in cannabis itself, the preferred routes of administration and development of associated cannabis concentrates have increased the levels of potency that users are exposed to.[10] To further complicate matters, the role that synthetic cannabinoids play is not clear, with a growing body of evidence to suggest that not only is their use becoming more popular but also that there are significant toxic effects on brain and behavior.[11] It also seems that exogenous factors play a role in how effective cannabis might be as an antidepressant with its effects being greatest under aversive conditions.[12] Despite the inconclusive nature of the effects of cannabis on mood, there is evidence to suggest that cannabis might be used to control or “self-medicate” for mood disorders including depressive symptoms.[8] Taking these complexities into account, investigating the residual effects of cannabis in a model that lacks control over phytocannabinoids and potency is still very relevant, particularly in Colorado where there is a 74% higher than average use rate in teens and young adults.[13]
The use of electroencephalography (EEG), specifically, event-related potentials (ERPs) to identify potential biomarkers has linked the P3 event-related potential to both emotion processing and depression.[14–19] Further, the P3 has been shown to be modulated by cannabis exposure.[20–23] Typically, cannabis has been shown to have a dose-dependent relationship with P3 amplitude: as the dose increases, amplitude in the P3 decreases.[22] Recent work in our lab investigated the effects of residual cannabis exposure in an emotional expression recognition paradigm. The amplitude of the P3 was significantly decreased for negative emotions particularly when processing emotional expressions implicitly and empathically. However, in an explicit viewing task, cannabis users’ performance was not significantly different from nonusers.[20]
Therefore, we hypothesize that the effects of residual cannabis use will further modulate the P3 amplitude in an emotional expression recognition paradigm when accounting for mood state. That is, a greater decrease in amplitude for negative emotional expression recognition in both implicit and empathic processing tasks in those participants who use cannabis and present with subclinical depression.
2. Methods
2.1. Participants
Two hundred and three undergraduate students, recruited from the university's psychology participant pool, provided self-reported demographics and written consent. Thirty-four participants were excluded from the data set due to missing EEG data and 47 participants were excluded for missing questionnaire data, leaving 122 participants; none of these participants were from previous research.[20] Participants were screened for cannabis, tobacco, and alcohol consumption as well as prescription drug use in the last 8 and 24 hours. Caffeine use was the most common, with 53 participants reporting consumption in the last 8 hours (43%); 44 consumed caffeine in the last 24 hours (36%). Reported tobacco consumption was 13 in the last 8 hours (11%), and 10 in the last 24 hours (8%); alcohol consumption was 2 in the last 8 hours (2%), and 20 in the last 24 hours (16%); cannabis use was 7 in the last 8 hours (6%), and 28 in the past 24 hours (23%); and prescription and over-the-counter medication use was reported by 21 participants in the last 8 hours (17%), and 27 in the past 24 hours (22%). Participants were also screened for personal and family history of significant mental health issues and substance addictions. No significant visual impairments or neurological deficits were reported.
Participants were compensated with Psychology course credit for their participation. The study was approved by Colorado State University's Office of Research Integrity & Compliance Review Office Institutional Review Board Protocol ID 12-3716H.
2.2. General procedure
In addition to providing self-reported demographic and substance use information, participants were assessed for subclinical depression using the Center for Epidemiological Studies Depression Scale (CES-D).[24] The CES-D is a 20-item measure that asks participants to answer questions relating to their mood state over the past 7 days. All of the questions are associated with addressing behaviors associated with depression such as sleep problems, loneliness, etc. Those scoring over 16 on the scale are considered to be at risk for a diagnosis of depression.[24] Consistent with this cut-off point, participants in our study who scored a 16 or higher on the CES-D were considered “sub-clinically depressed.” For the ease of reporting, any reference to depression in our population assumes an evaluation corresponding to a subclinical measure of mood state, as described above. Constraints on resources prevented a clinical screening of participants for depression, and therefore was not the focus of this study.
After screening and assessment completion, EEG caps were fitted to the participants. During EEG recording, participants were asked to complete a facial emotion-attention task. Participants sat approximately 30 cm away from a Dell desktop computer where faces depicting emotional expressions: happy, angry, and fearful, and a neutral expression condition were displayed. Face stimuli were obtained with permission from the Radboud Faces Database.[25] Face stimuli were pseudo-randomly presented within 3 task conditions: implicit processing task (participants categorized the faces by sex), an explicit processing task (categorizing by emotion), and an empathic condition (told to empathize with the depicted emotion). In each task, there were a total of 32 unique faces presented 4 times each with a different emotional expression each time. The same 128 faces/expressions were used in all 3 tasks in this paradigm and the order of the 3 tasks was counterbalanced across participants. For each instance of stimulus presentation, 1500 ms of a black screen was followed by 1000 ms of an image of a fixation cross on black background. This preceded the 2000 ms presentation of the random facial expression. Participants were given an additional 2000 ms to respond. The experimental paradigm has been used with previous research in our lab.[20]
After completing EEG acquisition, cannabis use was then assessed by self-report using a questionnaire specifically designed for cannabis use in a post-legalization environment; the recreational cannabis use evaluation (R-CUE), which addresses a wide variety of ecological cannabis use, was used to classify user or nonuser.[20]
2.3. EEG acquisition
Consistent with previous work from our lab, electroencephalogram (EEG) was recorded from 25 Ag/AgCl electrodes that covered regions of interest (noted below in “Data Analysis”) mounted on a SynAmps2 64-channel QuikCap[26] according to the 10 to 20 system.[27] The ground electrode was midline anterior to Fz and online reference placed at the right mastoid. Signal recording was at a sampling rate of 500 Hz and amplified with a band pass of 10 to 50 Hz in epochs from −200 to 1000 ms.[20] Horizontal electro-oculogram was monitored with electrodes placed on the outer canthi of the left and right eyes. Due to limitations presented by the use of the QuickCap system vertical electro-oculogram was recorded using electrodes FP1 and FP2 and recordings from these electrodes were included in our artifact rejection. Impedance was kept below 5 kΩ.[20]
2.4. Data analysis
EEG data were re-referenced offline to the common average and baseline corrected to the prestimulus interval of 200 ms. Artifact rejection application was provided using a built-in rejection tool within SCAN 4.5 EEG acquisition software: trials with an amplitude exceeding ±100 μV at any electrode resulted in analysis exclusion as well as any participant who had all trials rejected or absent for any one task condition. P3 mean amplitudes were calculated 200 to 400 ms epoch. Regions of interests (ROI) were chosen from previous research[20] which included F3/F4, FC1/FC2, P3/P4, PO7/PO8, and O1/O2. The O1/O2 was included for an exploratory analysis after previous similar analysis on another data set showed significance. A 3 (task) × 4 (emotion) × 6 (ROI) × 2 (hemisphere) × 4 (group) mixed factor analysis of variance (ANOVA) with Greenhouse–Geisser corrections was used to examine differences in P3 amplitude between conditions and groups. The 4 groups were Controls (n = 20), Nondepressed Users (n = 32), Depressed Nonusers (n = 27), and Depressed Users (n = 43). t Test post hoc was used for hypothesized group comparisons and Bonferroni was used for non-hypothesized comparisons.
3. Results
3.1. ERP
There was a significant main effect for Emotion, F(2.78, 328.14) = 2.73, P < 0.05,
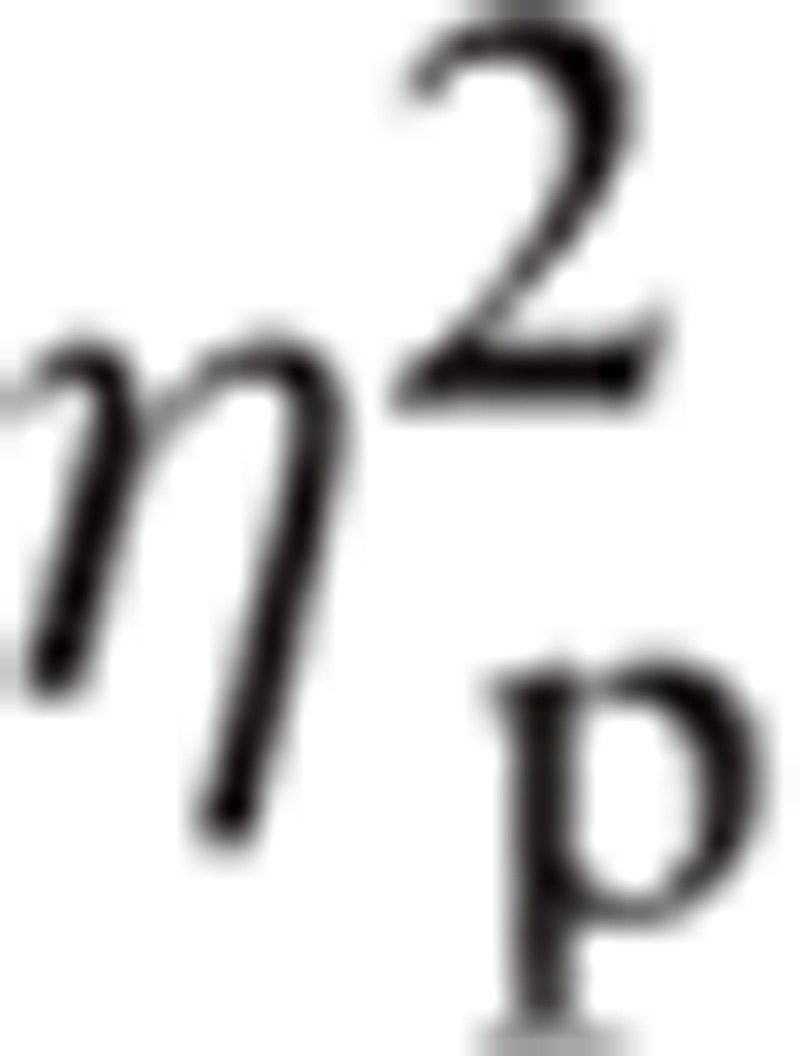 |
= 0.023. Bonferroni indicated that P3 amplitude for Happy (mean [M] = 0.36, standard error [SE] = 0.05) was greater than Angry (M = 0.30, SE = 0.05; P < 0.05). There was a significant main effect for ROI, F(1.42, 167.49) = 46.09, P < 0.001,
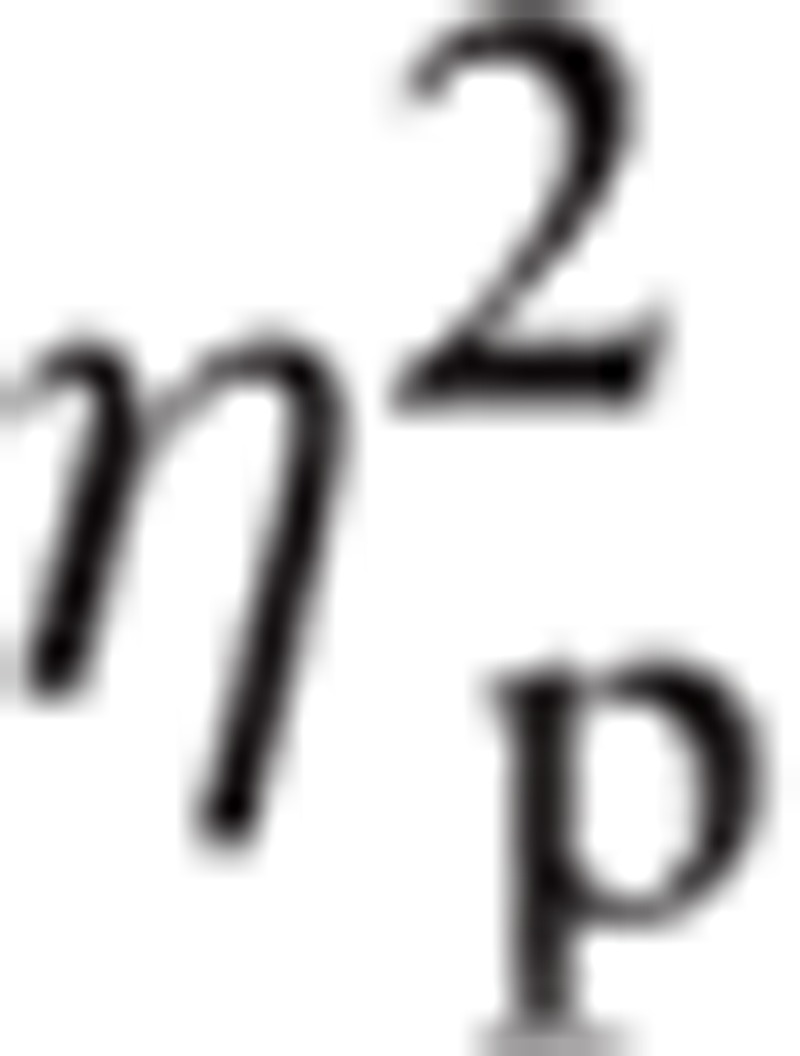 |
= 0.281. There was a significant main effect for Hemisphere, F(1, 118) = 23.25, P < 0.001,
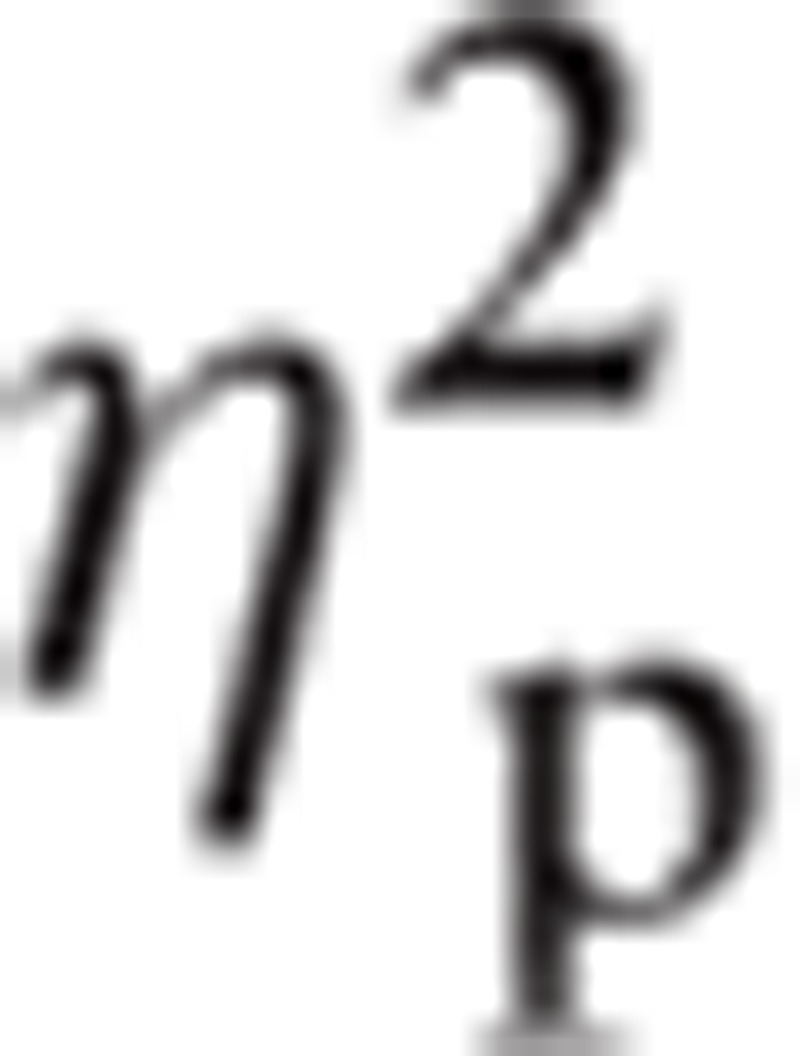 |
= 0.165. There was a significant interaction between Emotion and ROI, F(5.64, 665.69) = 4.57, P < 0.001,
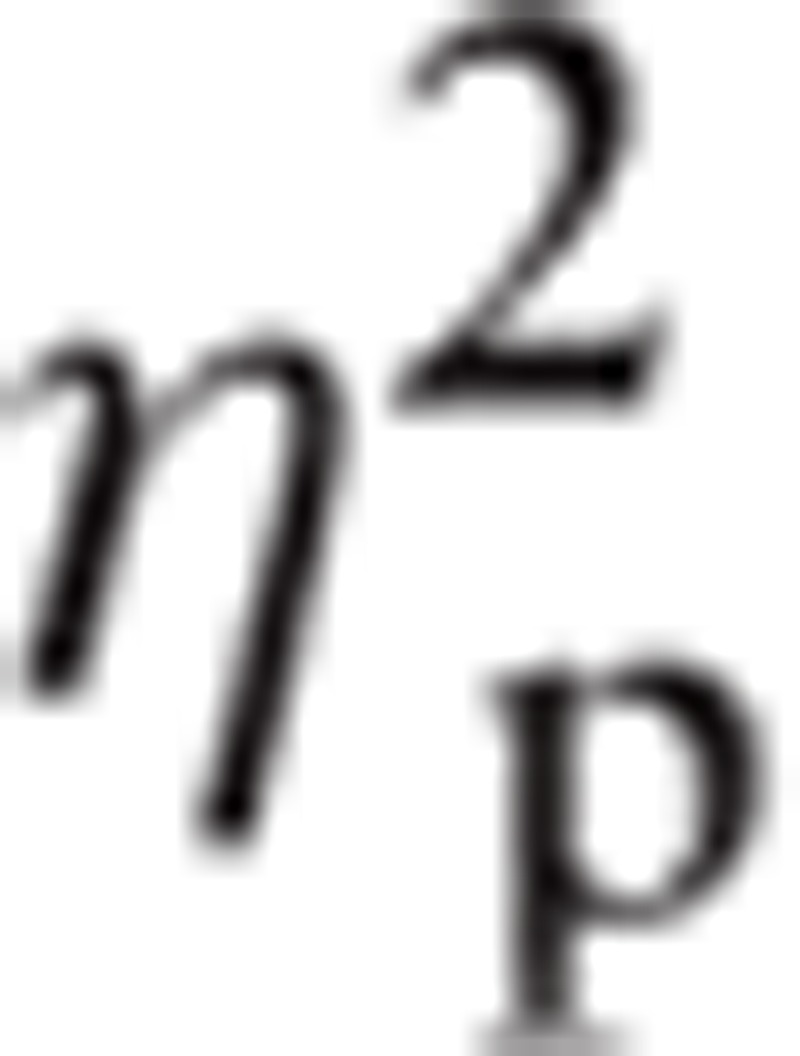 |
= 0.037. There was a significant interaction between Hemisphere and ROI, F(4.12, 486.02) = 7.44, P < 0.001,
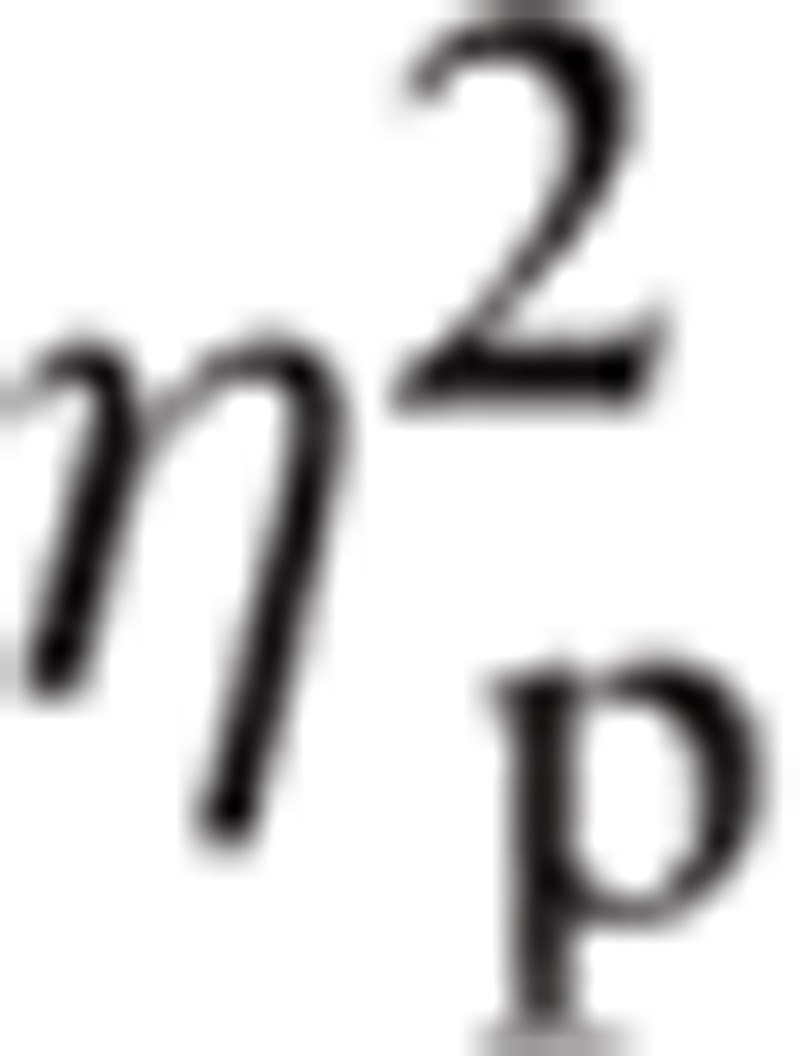 |
= 0.059.
3.1.1. Group differences
There was a significant interaction between Task by Emotion by ROI by Group, F(26.98, 1061.28) = 1.89, P < 0.01,
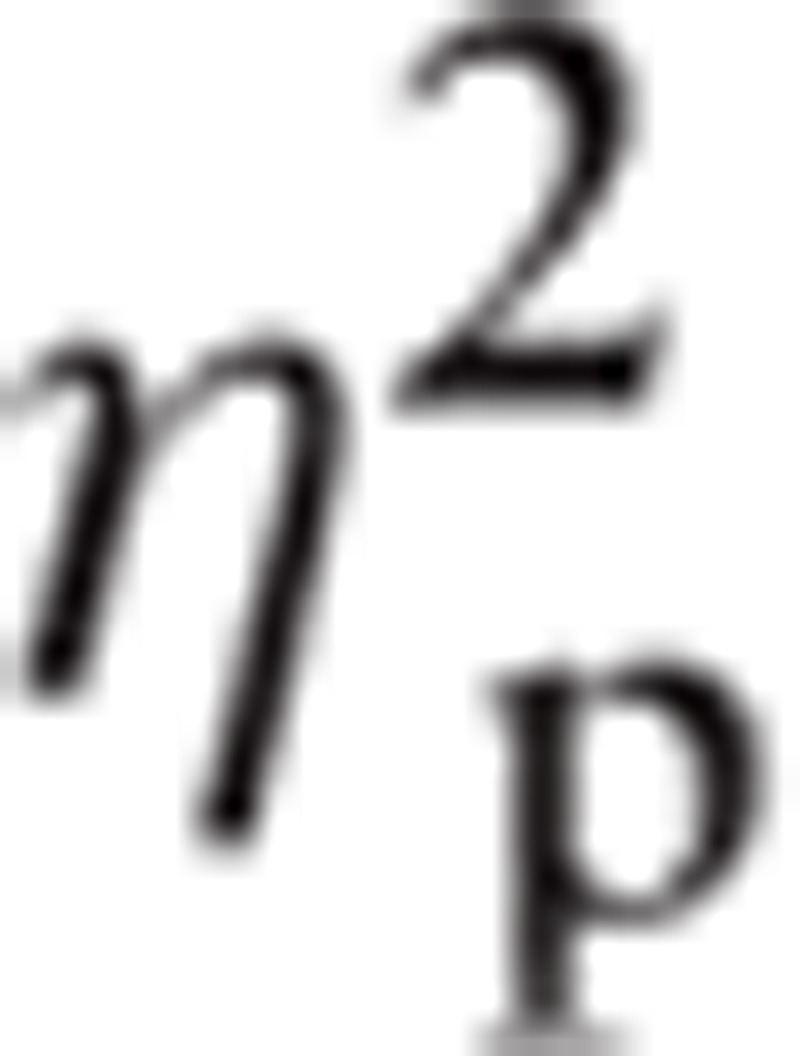 |
= 0.046. Follow up t test revealed a significant difference between the nonuser groups in the Implicit Fear condition in the F3/F4 ROI, t(29.97) = −2.90, P < 0.01, d = .882. Controls (M = −2.03, standard deviation [SD] = 1.93) had lower amplitudes than Depressed Nonusers (M = −0.60, SD = 1.22). In addition, there was a difference in Implicit Fear for PO7/PO8 ROI, t(45) = 2.23, P < 0.05, d = 0.636. Controls (M = 1.96, SD = 2.60) had greater amplitudes than Depressed Nonusers (M = 0.56, SD = 1.71). For the same 2 groups, there was a significant difference in Implicit Fear in O1/O2 ROI, t(45) = 2.19, P < 0.05, d = 0.627. Controls (M = 1.71, SD = 2.54) had greater amplitudes than Depressed Nonusers (M = 0.33, SD = 1.78). Also in Implicit Fear in the CP1/CP2 ROI, there was a significant difference, t(24.31) = 1.95, P < 0.05, d = 0.576, between Controls (M = 0.99, SD = 1.49) and Depressed Users (M = 0.30, SD = 0.81).
In the Empathy Neutral condition there were significant differences between Nondepressed Users and Depressed Nonusers in various ROIs. There were differences in the F3/F4 ROI, t(57) = −2.03, P < 0.05, d = 0.542, Nondepressed Users (M = −1.55, SD = 2.42) were less than Depressed Nonusers (M = −0.49, SD = 1.34). Another difference was in the FC1/FC2 ROI, t(57) = −2.39, P < 0.01, d = 0.639, Nondepressed Users (M = −1.14, SD = 1.31) were less than Depressed Nonusers (M = −0.46, SD = 0.75). There was also a difference in the PO7/PO8 ROI, t(50.76) = 2.48, P < 0.01, d = 0.632, Nondepressed Users (M = 1.58, SD = 2.06) were less than Depressed Nonusers (M = 0.51, SD = 1.18). Finally, there was a difference in O1/O2 ROI, t(57) = 2.13, P < 0.05, d = 0.563, Nondepressed Users (M = 1.38, SD = 2.06) were less than Depressed Nonusers (M = 0.37, SD = 1.47).
In Empathy Angry, PO7/PO8 ROI, there were differences between Depressed Users and 2 groups, Nondepressed Users, t(73) = 1.69, P < 0.05, d = 0.394, and Controls, t(61) = 1.83, P < 0.05, d = 0.491, that is, Nondepressed Users (M = 1.25, SD = 1.98) and Controls (M = 1.45, SD = 2.01) were greater than Depressed Users (M = 0.48, SD = 1.94). A difference in Empathy Angry in O1/O2 ROI between Controls and Depressed Users, t(61) = 1.89, P < 0.05, d = 0.485, and Depressed Nonusers, t(26.34) = 1.80, P < 0.05, d = .552, Controls (M = 1.55, SD = 2.37) were greater than Depressed Users (M = 0.53, SD = 1.82) and Depressed Nonusers (M = 0.51, SD = 1.21) (see Fig. 1).
Figure 1.

Mean amplitudes representative effects for the Empathy, Angry, and Explicit Fear conditions showing the P3 differences (grey area).
Finally, group differences included Explicit Fear in the F3/F4 ROI, t(61) = −1.95, P < 0.05, d = 0.539, Controls (M = −1.63, SD = 1.48) were less than Depressed Users (M = −0.77, SD = 1.69). (See Fig. 1).
3.1.2. Within group comparisons
To further understand the interactions of cannabis and depression symptoms, we did an exploratory analysis of examining differences within each group. For each of the 4 groups we did a repeated measure, 3 (task) × 4 (emotion) × 6 (ROI) × 2 (hemisphere) ANOVA with Greenhouse–Geisser corrections. Bonferroni post hoc was used when appropriate.
3.1.3. Controls
Significant main effects were found in ROI, F(1.30, 24.76) = 12.24, P < 0.01,
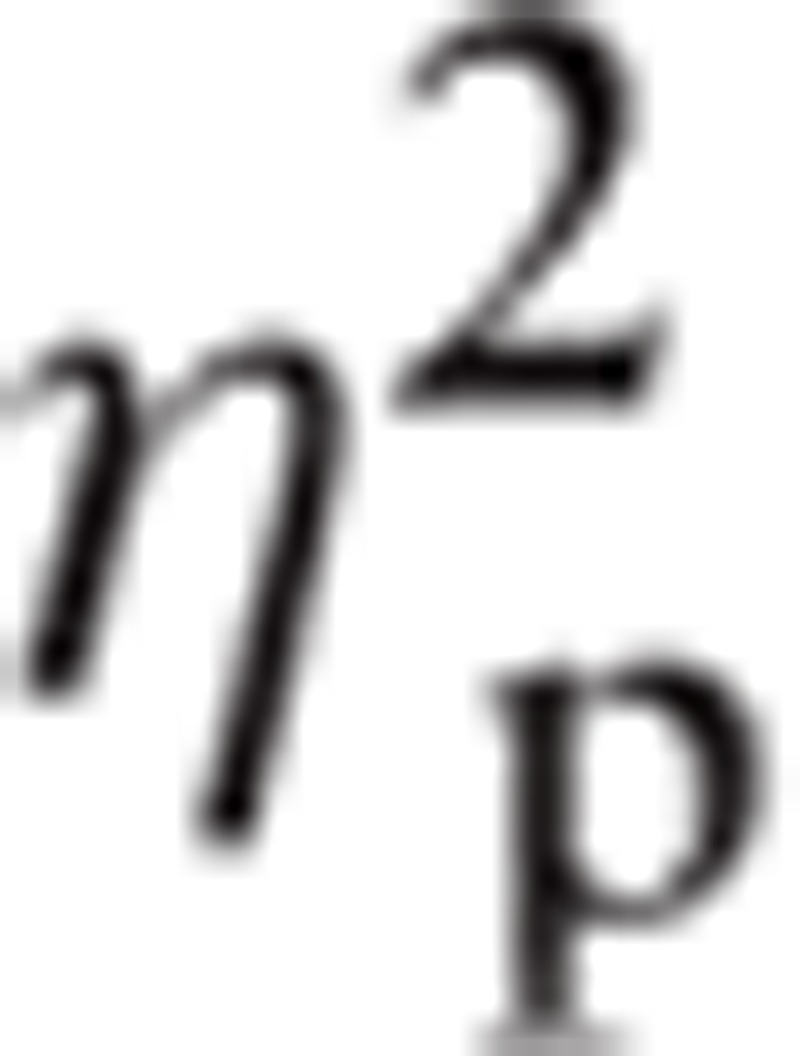 |
= 0.392, and in Hemisphere, F(1, 19) = 6.12, P < 0.05,
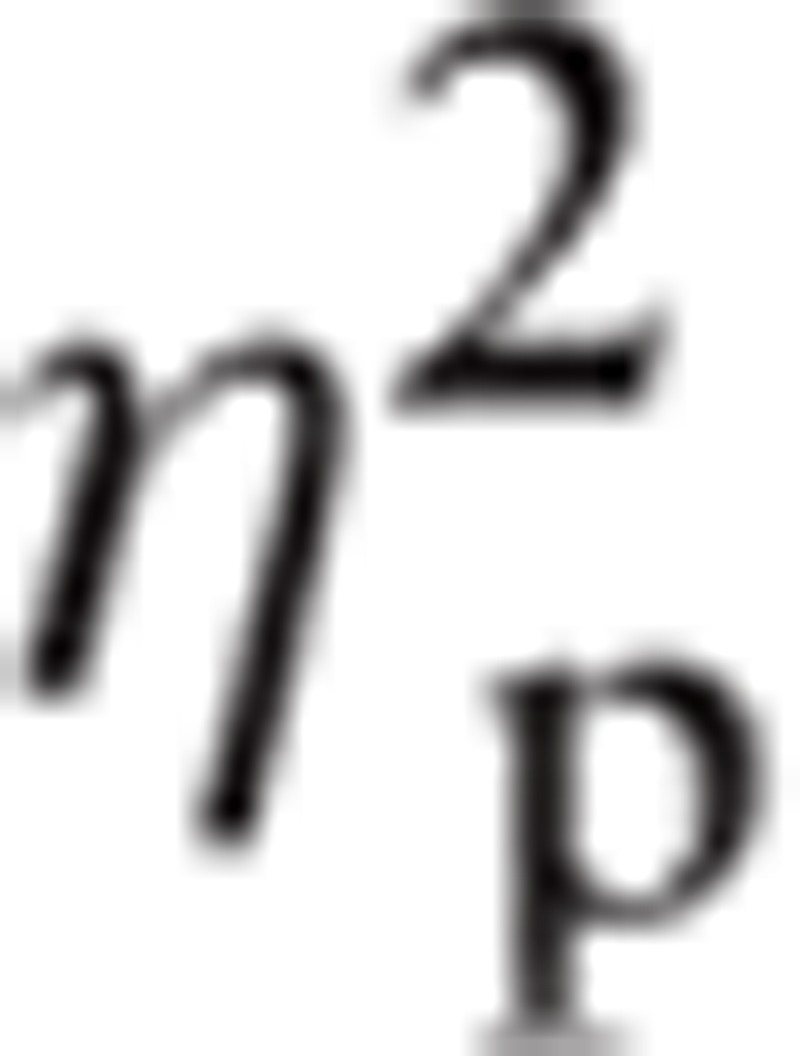 |
= 0.224.
3.1.4. Nondepressed users
Significant main effects were found in ROI, F(1.24, 38.61) = 11.515, P < 0.01,
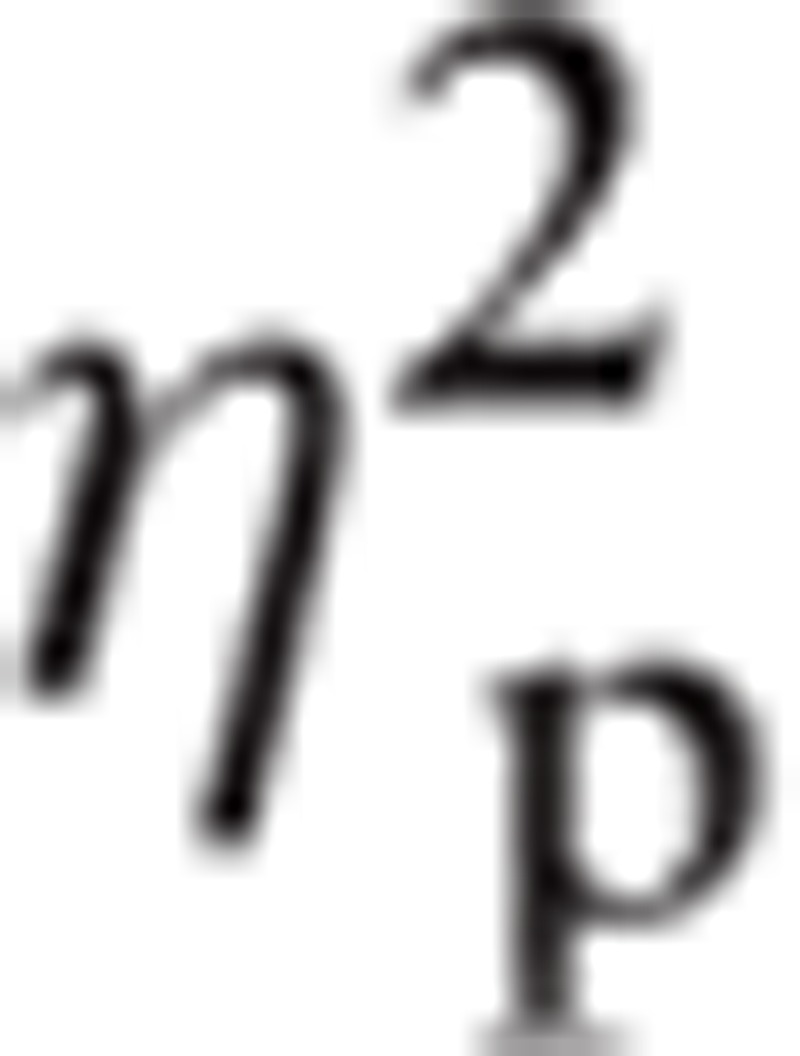 |
= 0.271, Hemisphere, F(1, 31) = 8.32, P < 0.01,
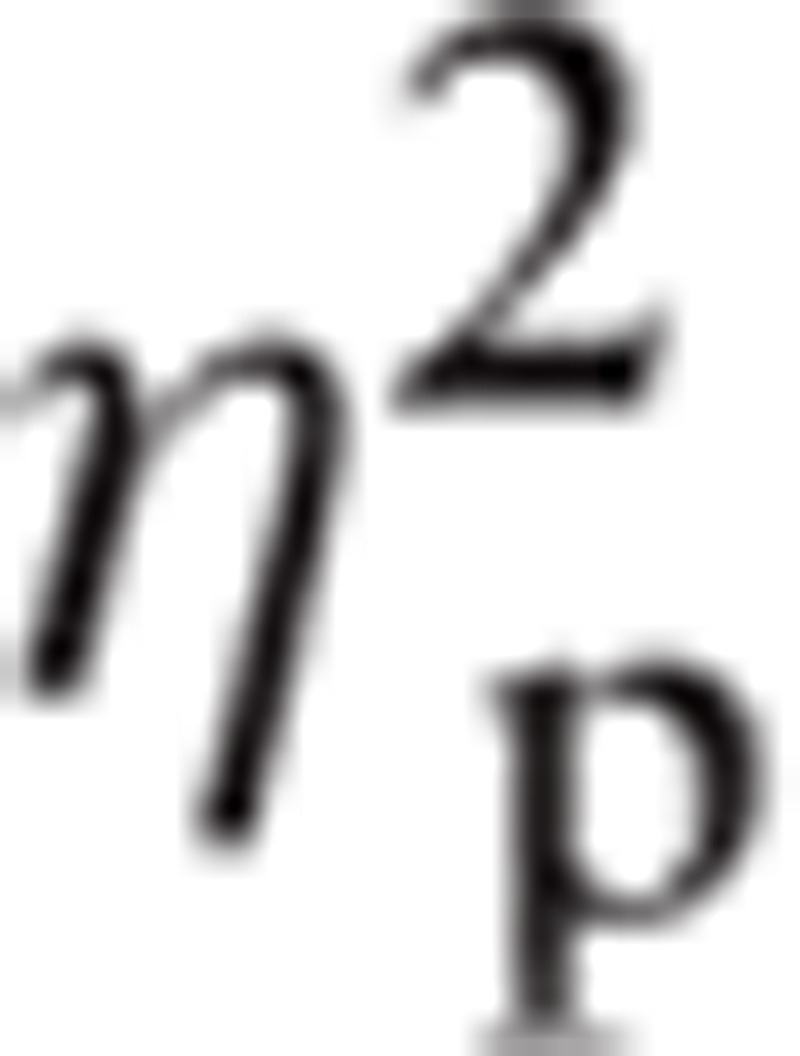 |
= 0.211, and Emotion, F(2.67, 82.93) = 2.83, P < 0.05,
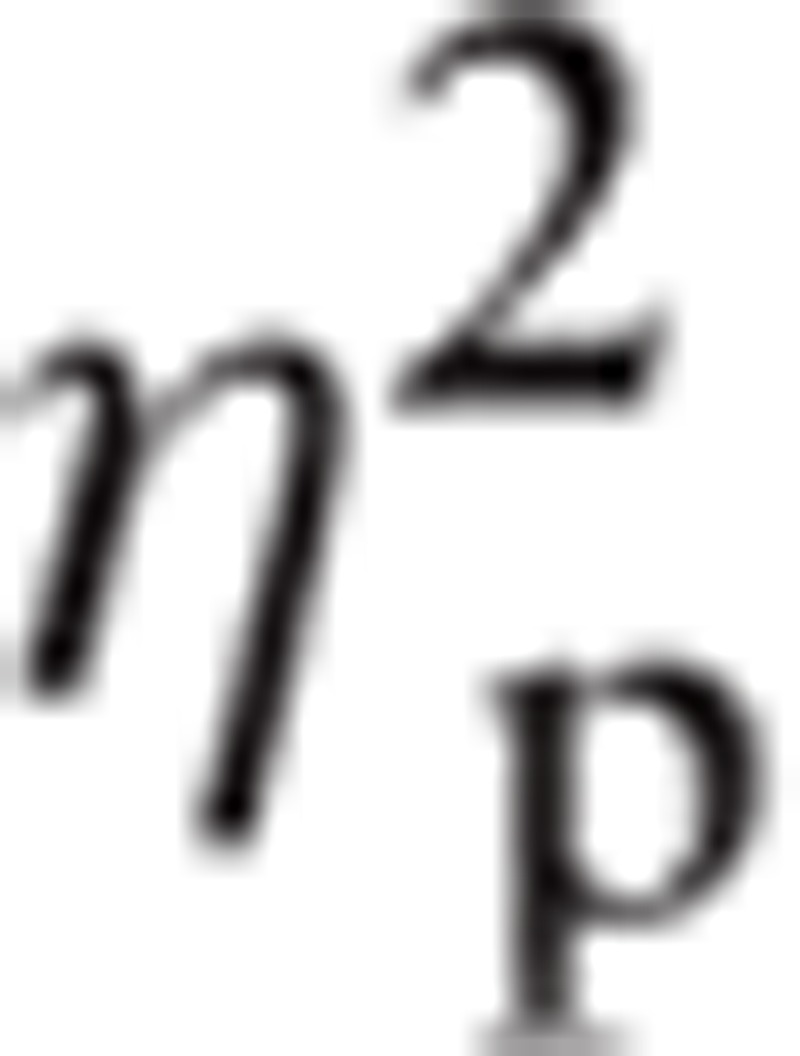 |
= 0.084. For Emotion, Happy (M = 0.39, SE = 0.10) had greater amplitude than Fear (M = 0.29, SE = 0.10).
3.1.5. Depressed nonusers
Significant main effects were found in ROI, F(1.919, 49.899) = 8.75, P < 0.01,
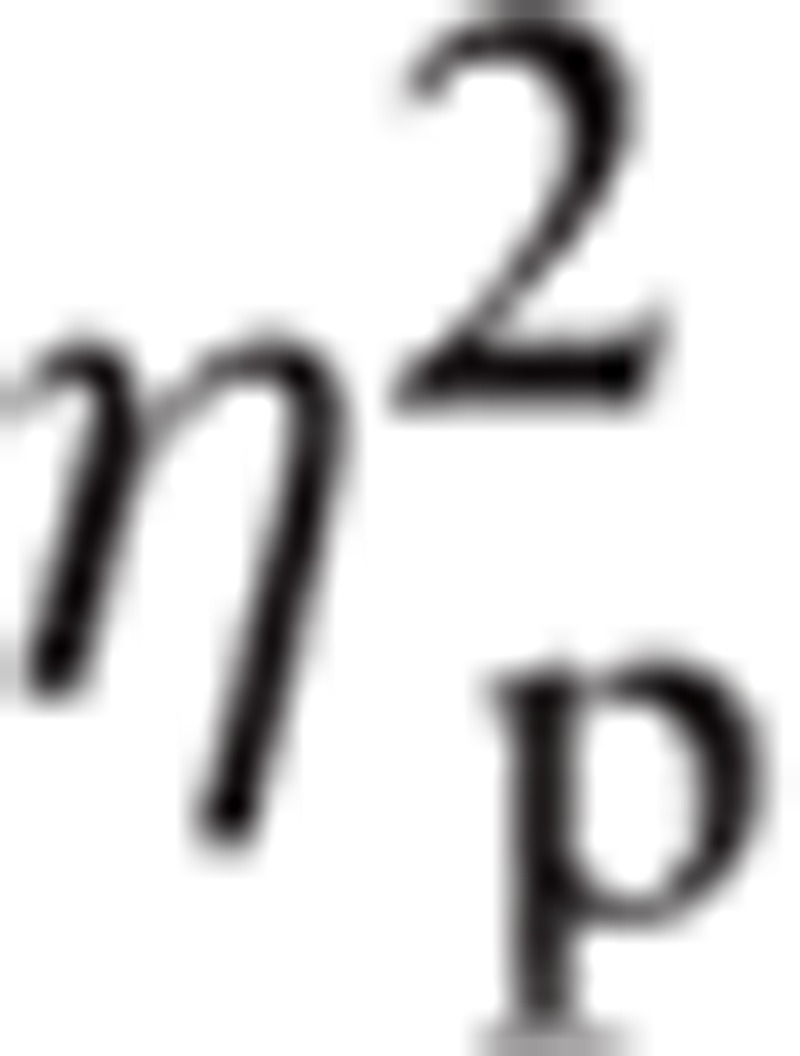 |
= 0.252 and Hemisphere, F(1, 26) = 4.30, P < 0.05,
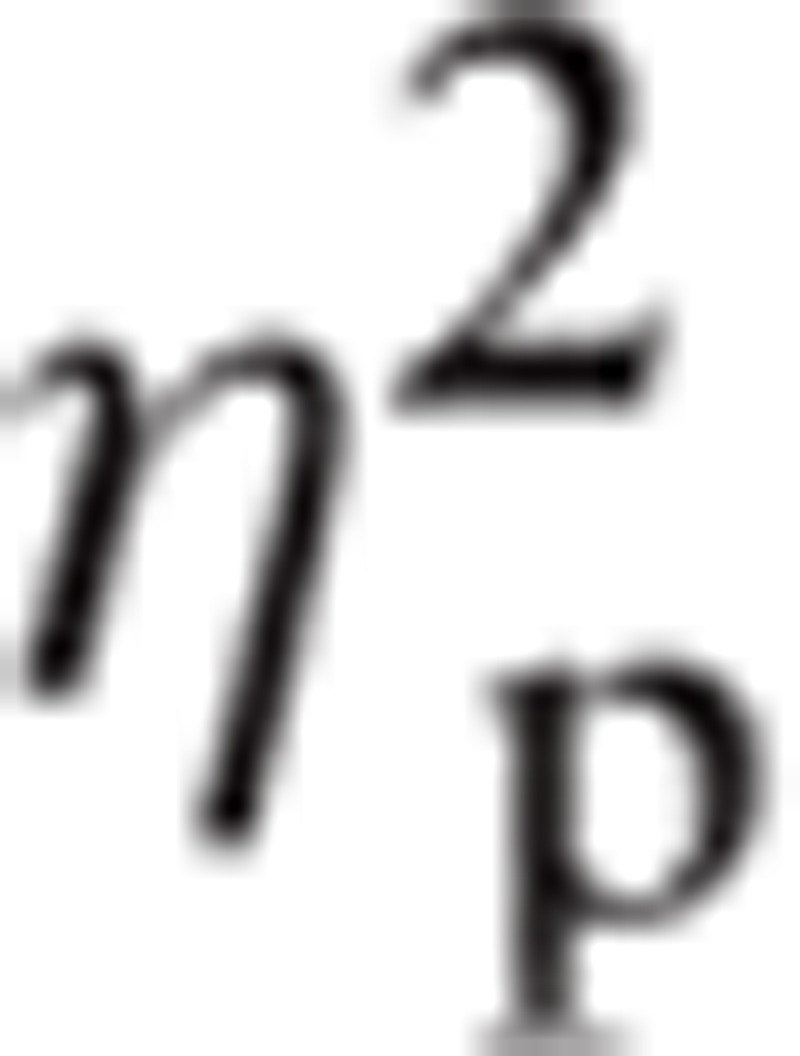 |
= 0.142. There was a significant interaction between Task∗Emotion∗ROI, F(8.16, 212.06) = 2.290, P < 0.05,
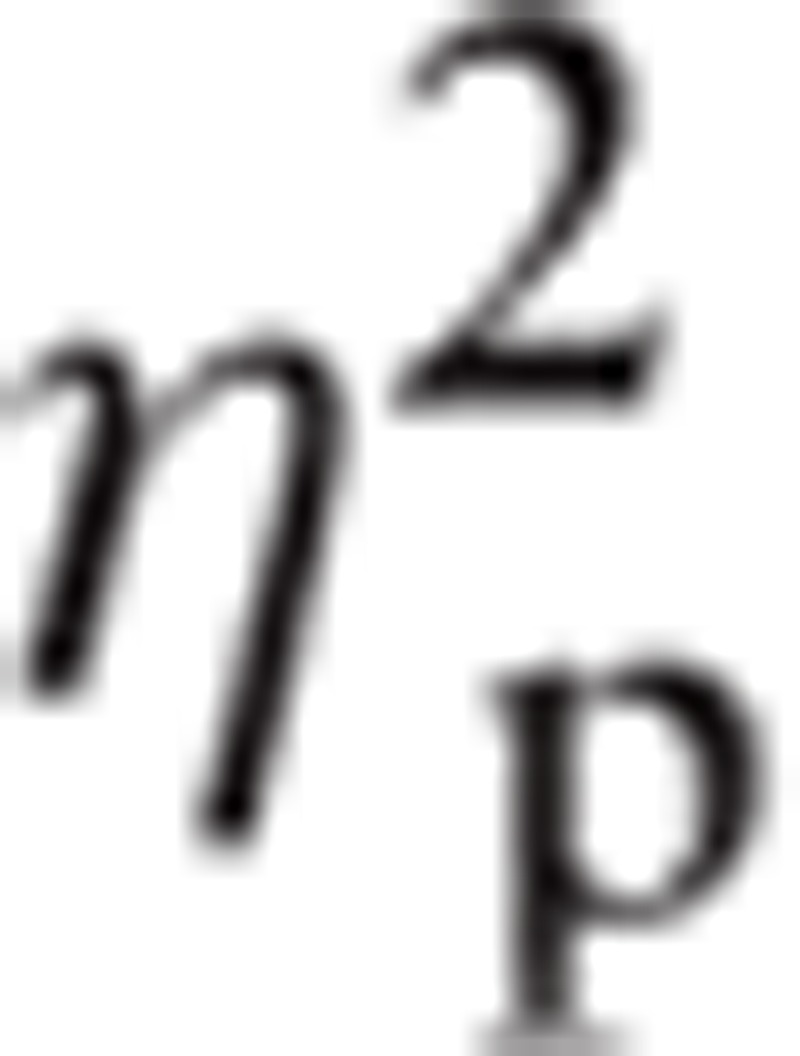 |
= 0.081. In the F3/F4 ROI and the Implicit task, Fear (M = −0.60, SE = 0.24) had greater amplitude than Neutral (M = −1.16, SE = 0.31; P < 0.05). In the FC1/FC2 ROI and Implicit task, Fear (M = −0.14, SE = 0.20) and Angry (M = −0.28, SE = 0.26) had greater amplitudes than Neutral (M = −0.61, SE = 0.26) and Happy (M = −0.69, SE = 0.24; P < 0.05). In the F3/F4 ROI and the Explicit task, Angry (M = −0.62, SE = 0.33) was greater than Fear (M = −0.98, SE = 0.28; P < 0.05).
3.1.6. Depressed users
There were significant main effects for ROI, F(1.25, 52.49) = 15.46, P < 0.001,
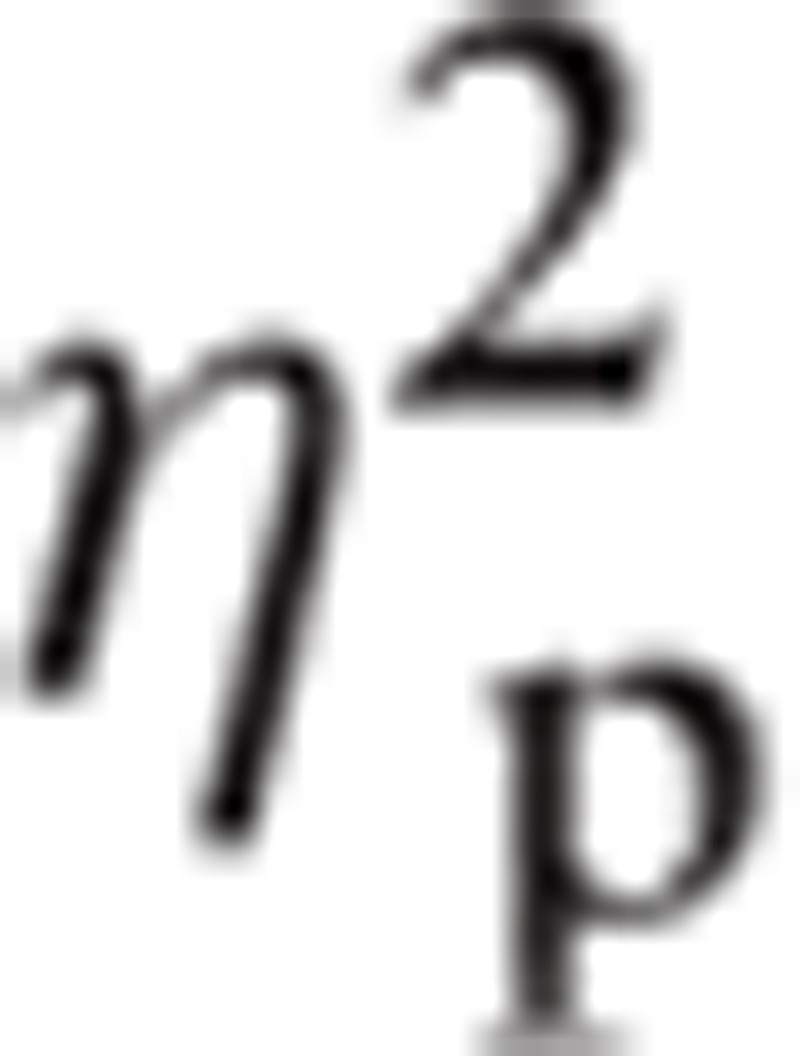 |
= 0.296 and Hemisphere, F(1, 42) = 6.59, P < 0.05,
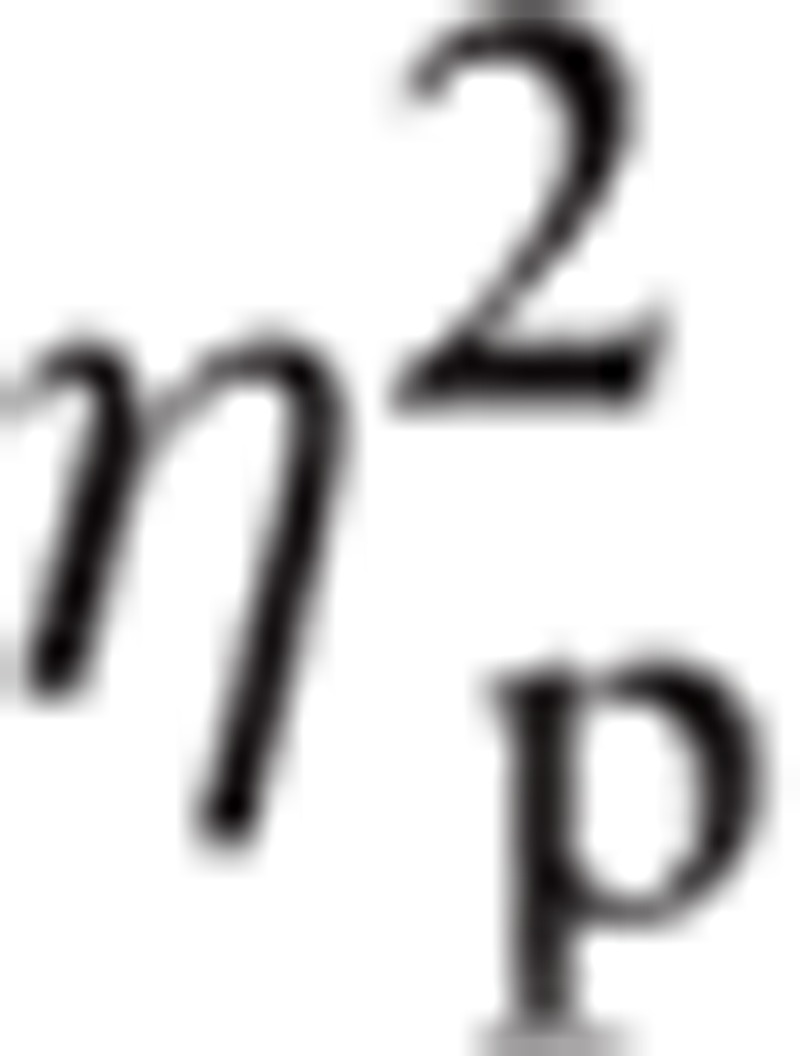 |
= 0.136. There were also significant interactions in Emotion∗ROI, F(4.82, 202.35) = 2.77, P < 0.05,
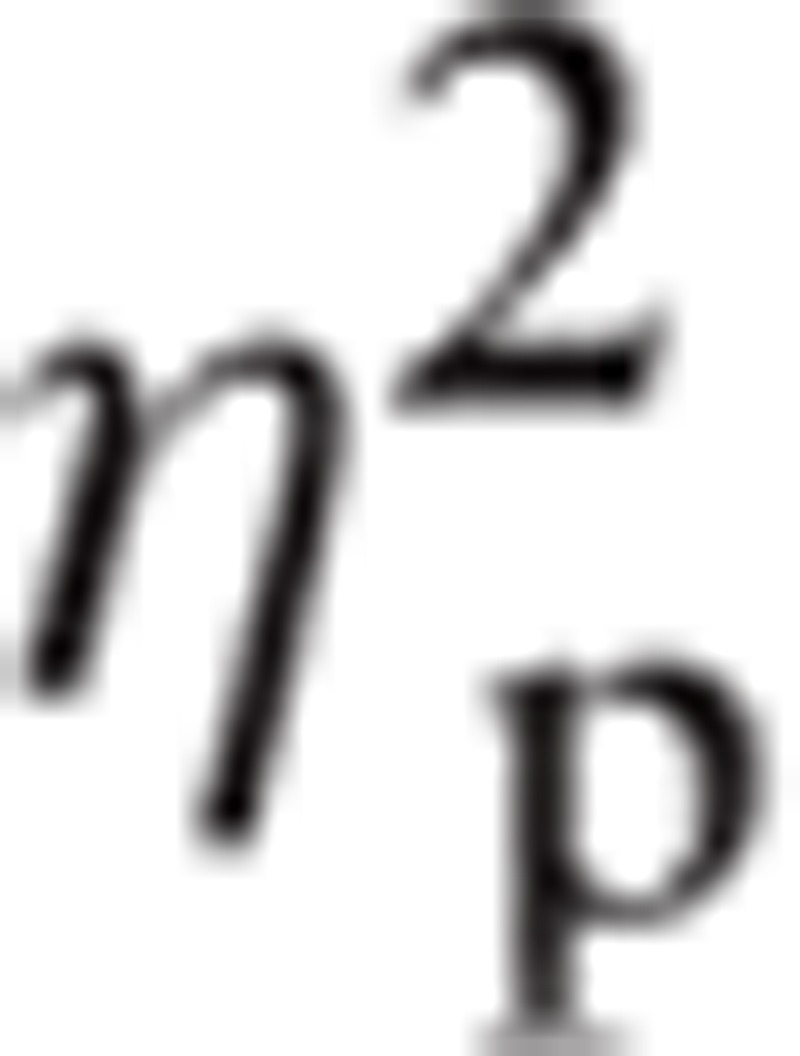 |
= .062 and Task∗Emotion∗ROI, F(7.52, 316.02) = 2.25, P < 0.05,
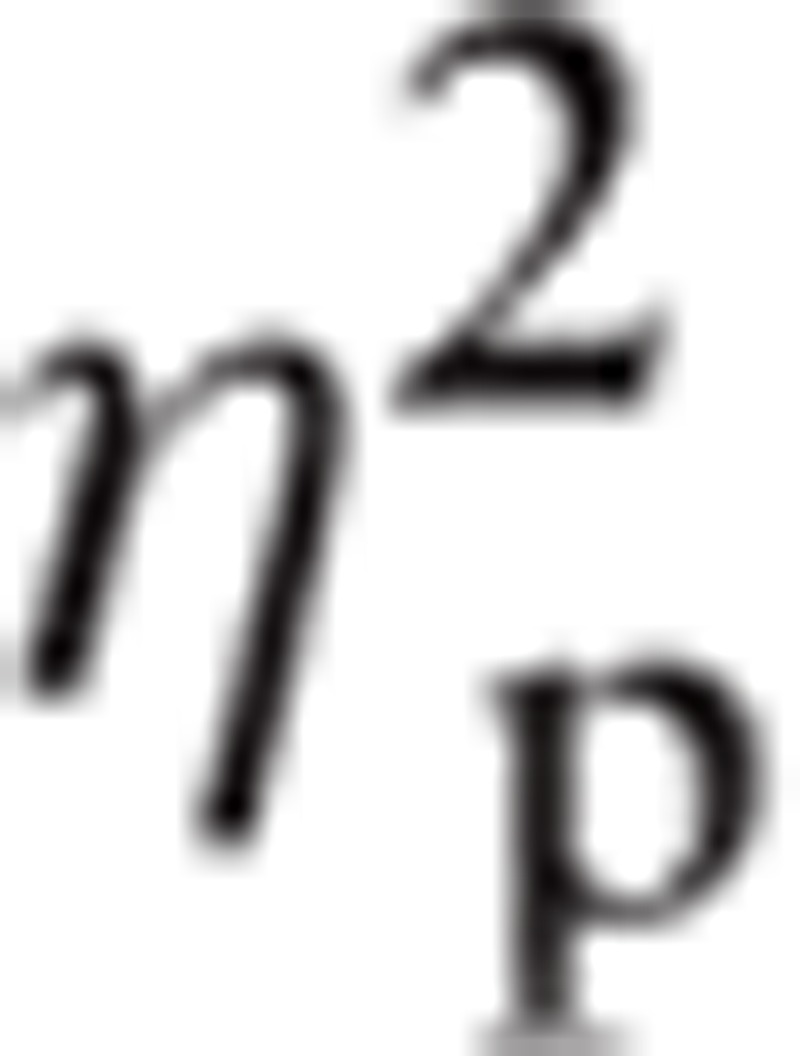 |
= 0.051. The differences in Emotion∗ROI interaction were, FC1/FC2, Fear (M = −0.59, SE = 0.21) had greater amplitude than Neutral (M = −0.79, SE = 0.18; P < 0.01); PO7/PO8, Happy (M = 1.08, SE = 0.30) had greater amplitude than Angry (M = 0.76, SE = 0.29; P < 0.05). The differences in Task∗Emotion∗ROI were F3/F4 and Explicit task, Fear (M = −0.77, SE = 0.26) had greater amplitude than Happy (M = −1.17, SE = 0.26) and Angry (M = −1.28, SE = 0.30; P < 0.05); FC1/FC2 ROI and Explicit task, Fear (M = −0.42, SE = 0.19) had greater amplitude than Neutral (M = −0.76, SE = 0.18; P < 0.05); PO7/PO8 and Explicit task, Happy (M = 1.04, SE = 0.29) was greater than Fear (M = 0.70, SE = 0.30; P < 0.05); PO7/PO8 and Empathy, Happy (M = 1.13, SE = 0.32) had greater amplitude than Angry (M = 0.48, SE = 0.30; P < 0.05); and O1/O2 and Explicit, Fear (M = 0.49, SE = 0.26) had less amplitude than Happy (M = 0.97, SE = 0.28; P < 0.05) and Angry (M = 1.02, SE = 0.31; P < 0.01).
4. Discussion
For simplicity, amplitudes are discussed as distance from zero, that way amplitudes in the anterior electrodes can be consistent with posterior electrodes. In multiple ROIs Depressed Nonusers had reduced P3 amplitudes when implicitly processing fearful facial expressions when compared with controls; indicating that mood was affecting P3 amplitudes to negative emotions. This is consistent with the literature both suggesting that mood effects the P3 amplitude and that negative emotions are processed differently in individuals with mood disorders, with those individuals who are depressed having a reduction in the event-related potential response associated with attention to emotion.[1–4]
When explicitly processing fearful facial expressions, Depressed Users had reduced amplitudes in comparison to Controls. In our previous study using the same paradigm we showed that cannabis users P3 was similar to controls in this explicit condition.[20] The results suggest that mood state interacts with cannabis use in this condition reducing the P3 amplitude[21–23] for participants who we classified as subclinically depressed. When cannabis and negative mood are interacting, it changes the effect that being asked to explicitly identify an emotional face has on performance, in particular the amplitude of the P3. Cannabis users are no longer able to perform at levels seen in controls when explicitly processing emotion and show a reduced in amplitude that could be interpreted as a reduction in the brains ability to respond. This supports literature that suggests that cannabis use interacts with mood.[1–8,12]
Depressed Nonusers also had reduced P3 amplitudes during Empathy Neutral in multiple ROIs when compared with nondepressed Users. Depressed Users, for multiple ROIs, and Depressed Nonusers, for 1 ROI, had reduced P3 amplitudes in comparison to the 2 nondepressed groups. These data suggest that when emotional expression is not clear, that is, “neutral,” depressed mood alone can potentially influence the P3, reducing it in amplitude compared with nonusers who are not depressed. Again, this suggests that empathic processing is impaired in emotion processing and in particular, when a stimulus appears “ambiguous” in that it is emotion “neutral.” Previous data form our lab have suggested that cannabis use effects empathic processing in negative mood states[20]; these data suggest that negative mood state alone also effects empathic processing. This is consistent with the literature suggesting that mood influences attention to expression.[21–23]
The within-group analyses indicated that within each group, emotions are processed differently. Controls had no differences in processing emotions regardless of task demands, whereas Nondepressed Users had greater amplitudes for Happy than for Fear across the ROIs. This again supports our previous findings that processing of negative emotions is affected significantly more than positive emotions in relation to cannabis exposure. The Depressed Nonusers showed reduced amplitudes for negative emotions in comparison to Happy and Neutral in the implicit task. They also had reduced amplitudes for Angry in comparison to Fear in the explicit task. The most P3 amplitude differences were found in Depressed Users. These differences can be summarized as Fear having reduced amplitudes in the Explicit and Empathy tasks. This indicates a different pattern of P3 activity to our previous study showing implicit and empathy conditions in cannabis users, without measuring mood state, having the greatest effect on the P3.[20] There were, however, limitations to the interpretations of our data. We examined residual effects of cannabis use and did not control for phytocannabinoid exposure in terms of type, length of use, and dosage. It is important to emphasize that despite this limitation, it does reflect an accurate picture of cannabis use effects in a teenage and young adult population who are prevalent consumers of both recreational and medical cannabis in Colorado.[13] Finally, our screening measures classified subclinical depression and did not include a clinical evaluation. Despite these limitations, the results still contribute to a better understanding of the effects of cannabis use on mood.
Footnotes
Abbreviations: CES-D = center for epidemiological studies depression scale, EEG = Electroencephalography, ERPs = event-related potentials, R-CUE = recreational cannabis use evaluation, ROI = regions of interests, THC = delta 9 tetrahydrocannabinol.
The authors have no conflicts of interest to disclose.
References
- [1].Micale V, Di Marzo V, Sulcova A, et al. Endocannabinoid system and mood disorders: Priming a target for new therapies. Pharmacol Therap 2013;138:18–37. [DOI] [PubMed] [Google Scholar]
- [2].Hindocha C, Wollenberg O, Leno VC, et al. Emotional processing deficits in chronic cannabis use: a replication and extension. J Psychopharmacol 2014;28:466–71. [DOI] [PubMed] [Google Scholar]
- [3].Degenhardt L, Hall W, Lynskey M. Exploring the association between cannabis use and depression. Addiction 2003;98:1493–504. [DOI] [PubMed] [Google Scholar]
- [4].Horwood LJ, Fergusson DM, Coffey C, et al. Cannabis and depression: An integrative data analysis of four Australasian cohorts. Drug Alcohol Depend 2012;126:369–78. [DOI] [PubMed] [Google Scholar]
- [5].Danielsson A, Lundin A, Allebeck P, et al. Cannabis use and psychological distress: An 8-year prospective population-based study among Swedish men and women. Addict Behav 2016;59:18–23. [DOI] [PubMed] [Google Scholar]
- [6].Rasic D, Weerasinghe S, Asbridge M, et al. Longitudinal associations of cannabis and illicit drug use with depression, suicidal ideation and suicidal attempts among Nova Scotia high school students. Drug Alcohol Depend 2013;129:49–53. [DOI] [PubMed] [Google Scholar]
- [7].Fairman BJ, Anthony JC. Are early-onset cannabis smokers at an increased risk of depression spells? J Affect Disord 2012;138:54–62. [DOI] [PMC free article] [PubMed] [Google Scholar]
- [8].Gomez Perez L, Santacana AM, Baquero DB, et al. Reasons and subjective effects of cannabis use among people with psychotic disorders: a systematic review. Actas Esp Psiquiatr 2014;42:83–90. [PubMed] [Google Scholar]
- [9].Mahmoud AE, Zlatko M, Susan F, et al. Changes in Cannabis potency over the last 2 decades (1995–2014): analysis of current data in the United States, (2016). Biol Psychiatry 2016;79:613–9. [DOI] [PMC free article] [PubMed] [Google Scholar]
- [10].Ford BM, Tai S, Fantegrossi WE, et al. Synthetic pot: not your grandfather's Marijuana. Trends Pharmacol Sci 2017;38:257–76. [DOI] [PMC free article] [PubMed] [Google Scholar]
- [11].Lankenau SE, Fedorova EV, Reed M, et al. Marijuana practices and patterns of use among young adult medical marijuana patients and non-patient marijuana users. Drug Alcohol Depend 2017;170:181–8. [DOI] [PMC free article] [PubMed] [Google Scholar]
- [12].Zanettini C, Panlilio LV, Aliczki M, et al. Effects of endocannabinoid system modulation on cognitive and emotional behavior. Front Behav Neurosci 2011;5:57. [DOI] [PMC free article] [PubMed] [Google Scholar]
- [13].RMHIDTA Report #4. Available at: http://www.rmhidta.org/. Accessed September 29, 2016. [Google Scholar]
- [14].Johnston VS, Miller DR, Burleson MH. Multiple P3s to emotional stimuli and their theoretical significance. Psychophysiology 1986;23:684–94. [DOI] [PubMed] [Google Scholar]
- [15].Laurian S, Bader M, Lanares J, et al. Topography of event-related potentials elicited by visual emotional stimuli. Int J Psychophysiol 1991;10:231–8. [DOI] [PubMed] [Google Scholar]
- [16].Delplanque S, Silvert L, Hot P, et al. Arousal and valence effects on event-related P3a and P3b during emotional categorization. Int J Psychophysiol 2006;60:315–22. [DOI] [PubMed] [Google Scholar]
- [17].Krolak-Salmon P, Fischer C, Vighetto A, et al. Processing of facial emotional expression: spatio-temporal data as assessed by scalp event-related potentials. Eur J Neurosci 2001;13:987–94. [DOI] [PubMed] [Google Scholar]
- [18].Greg Hajcak G, MacNamara A, Olvet DM. Event-related potentials, emotion, and emotion regulation: an integrative review. Dev Neuropsychol 2010;35:129–55. [DOI] [PubMed] [Google Scholar]
- [19].Röschke J, Wagner P. A confirmatory study on the mechanisms behind reduced P3 waves in depression. Neuropsychopharmcology 2003;28:S9–12. [DOI] [PubMed] [Google Scholar]
- [20].Troup LJ, Bastidas S, Nguyen MT, et al. An event-related potential study on the effects of cannabis on emotion processing. PLoS ONE 2016;11:e0149764. [DOI] [PMC free article] [PubMed] [Google Scholar]
- [21].Böcker KBE, Gerritsen J, Hunault CC, et al. Cannabis with high Δ 9-THC contents affects perception and visual selective attention acutely: An event-related potential study. Pharmacol Biochem Behav 2010;96:67–74. [DOI] [PubMed] [Google Scholar]
- [22].Theunissen EL, Kauert GF, Toennes SW, et al. Neurophysiological functioning of occasional and heavy cannabis users during THC intoxication. Psychopharmacology (Berl) 2012;220:341–50. [DOI] [PMC free article] [PubMed] [Google Scholar]
- [23].D'Souza DC, Fridberg DJ, Skosnik PD, et al. Dose-related modulation of event-related potentials to novel and target stimuli by intravenous Δ9 in THC in humans. Neuropsychopharmachology 2012;37:1632–46. [DOI] [PMC free article] [PubMed] [Google Scholar]
- [24].Radloff LS. The CES-D scale: A self report depression scale for research in the general population. Appl Psychol Measur 1977;1:385–401. [Google Scholar]
- [25].Langner O, Dotsch R, Bijlstra G, et al. Presentation and validation of the radboud faces database. Cogn Emot 2010;24:1377–88. [Google Scholar]
- [26].Compumedics Neuroscan. Offline analysis of acquired data (SCAN 4.3–vol. II, EDIT 4.3). El Paso: Compumedics Neuroscan; 2003. [Google Scholar]
- [27].Jasper HH. The ten twenty electrode system of the international federation. Electroen Clin Neuro 1958;10:371–5. [PubMed] [Google Scholar]


