

Abstract
Background:
Current studies evaluating the association of tea consumption and bone mineral density (BMD) have yielded inconsistent findings. Therefore, we conducted a meta-analysis to assess the relationship between tea consumption and BMD.
Methods:
The PubMed, Embase, and Cochrane Library databases were comprehensively searched, and a meta-analysis performed of all observational studies assessing the association of tea consumption and BMD. Forest plots were used to illustrate the results graphically. The Q-test and I2 statistic were employed to evaluate between-study heterogeneity. Potential publication bias was assessed by the funnel plot.
Results:
Four cohort, 1 case–control, and 8 cross-sectional studies including a total of 12,635 cases were included. Tea consumption was shown to prevent bone loss [odds ratio (OR): 0.66; 95% confidence interval (CI), 0.47–0.94; P = 0.02], yielding higher mineral densities in several bones, including the lumbar spine [standardized mean difference (SMD): 0.19; 95% CI, 0.08–0.31; P = 0.001], hip (SMD: 0.19; 95% CI, 0.05–0.34; P = 0.01), femoral neck [mean difference (MD): 0.01; 95% CI, 0.00–0.02; P = 0.04], Ward triangle (MD: 0.02; 95% CI, 0.01–0.04; P = 0.001), and greater trochanter (MD: 0.03; 95% CI, 0.02–0.04; P < 0.00001), than the non-tea consumption group.
Conclusion:
This meta-analysis provided a potential trend that tea consumption might be beneficial for BMD, especially in the lumbar spine, hip, femoral neck, Ward triangle, and greater trochanter, which might help prevent bone loss.
Keywords: bone mineral density, meta-analysis, osteoporosis, tea consumption
1. Introduction
Osteoporosis, a serious hazard to human health,[1] is a systemic skeletal disease caused by decreased bone mass and micro-architectural degradation of the bone tissue; it produces increasing physical illness and pain.[1–5] Bone mineral density (BMD) is a major indicator of osteoporosis, and determines its severity.
Tea is the most popular beverage in the world; the health advantages of this beverage have been reported in cardiovascular diseases, rheumatoid arthritis, influenza, and cancer.[6–10] The association of tea consumption with BMD has been investigated since the 1990s.[11] However, previous studies have yielded inconsistent conclusions. Indeed, some researchers claim a positive relationship between tea consumption and BMD,[12–14] while others support an inverse relationship between them.[11] Meanwhile, no correlation was found in some studies.[15–17]
To clarify the relationship of tea consumption and BMD more exactly and systematically, a meta-analysis of all available studies was performed.
2. Methods
2.1. Literature search
Electronic databases, including Embase, PubMed, and Cochrane Library, were searched comprehensively for all relevant literature, without restriction to regions, languages, or publication types. The following MeSH-free words and their combinations were searched in all fields: ((“Tea” [MeSH]) or (“Tea” [Free words])) AND (((“Osteoporosis” [MeSH]) or (“Osteoporosis” [Free words])) or ((“Bone Density” [MeSH]) or (“Bone Density” [Free words]))). In addition, the reference lists of the selected literature were also used to expand the search. Two investigators independently searched for articles, and reviewed all the retrieved studies. Disagreement between the 2 investigators was resolved by consensus, involving a third reviewer.
2.2. Inclusion and exclusion criteria
Inclusion criteria were as follows: observational studies with cohort, case–control, and cross-sectional designs, respectively (there was no relevant double-blind, placebo controlled trials); tea consumption as exposure; BMD or osteoporosis as outcome; results including means and standard deviations or dichotomous data, or providing sufficient information to derive the latter. Exclusion criteria were reviews, repeated, or overlapped publications; herbal tea; no measurement locations of BMD; animal studies; and studies with unavailable data.
2.3. Data extraction
Relevant information from each eligible study was extracted independently by 2 reviewers (Zhang and Yang) using a standardized form. Information included study name (first author), publication year, study location, study design, sample size, tea type, measurement locations of BMD, and study results.
2.4. Quality assessment
The Newcastle–Ottawa scale (NOS), with scores of 0 to 9 (allocated as stars), was used to assess the methodological quality of cohort and case–control studies,[18,19] and high quality was considered for articles with 6 or more stars. In addition, cross-sectional studies were assessed by an 11-item checklist recommended by Agency for Healthcare Research and Quality (AHRQ).[20] An “UNCLEAR” or “NO” answer conferred a score of “0” to the item, and “YES” a score of “1.” The quality of the article was assessed as follows: low quality, 0 to 3; medium quality, 4 to 7; high quality, 8 to 11.[20]
2.5. Ethical statement
All results and analyses were from previous published studies; thus, no ethical approval and patient consent are required.
2.6. Statistical analysis
All statistical analyses were performed with Review Manager 5.3 (The Cochrane Collaboration, Copenhagen, Denmark). In the pooled results, mean difference (MD) and odds ratio (OR) were used to compare continuous and dichotomous variables, respectively; standardized MD (SMD) were used for different units. All results were expressed with 95% confidence interval (CI). Heterogeneity was measured by the Q-test with I2 statistics, with P < 0.10 and I2 > 50% indicating high heterogeneity.[21,22] The random-effects model was used, when there was significant heterogeneity between-studies; otherwise, the fixed-effects model was employed.[23] Sensitivity analyses were used to evaluate the impact of each study on the pooled results by removing each study in turn,[10,24] assessing whether the quality of articles affected the overall results.[25] Funnel plots were used to assess potential publication bias.
3. Results
3.1. Study selection
A total of 364 relevant articles were obtained in the initial literature search. Then, 82 articles were excluded because of duplication; 248 others which were obviously irrelevant, reviews, or animal studies were also excluded by screening titles or abstracts. Studies with unavailable data or assessing herbal tea were also removed after full text reading. Finally, 13 articles were included in this study, evaluating 12,635 cases (6059 and 6576 individuals in the tea- and non-tea consumption groups) (Fig. 1).
Figure 1.
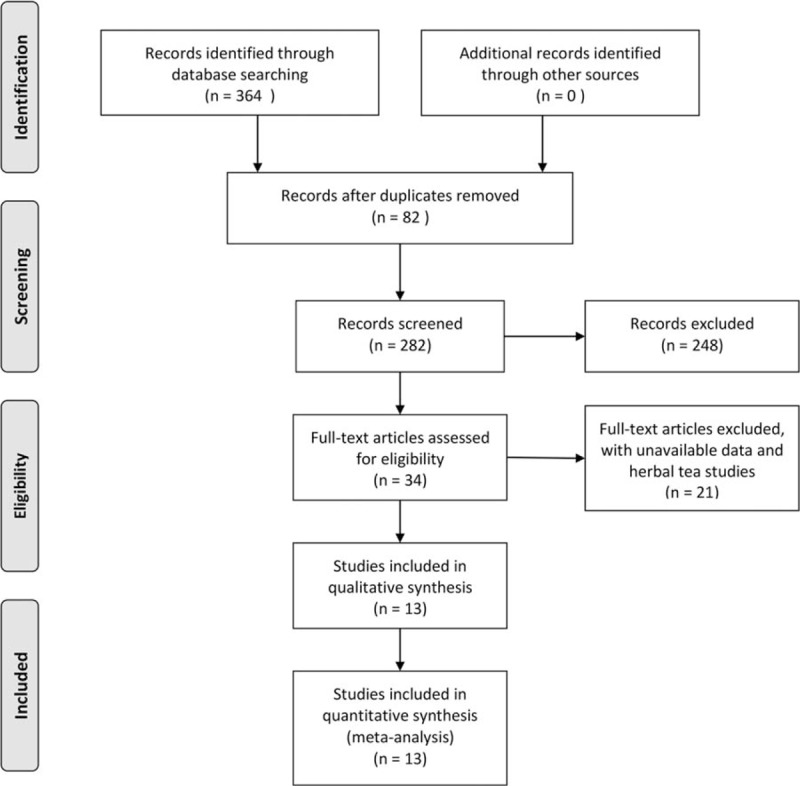
Flow diagram of screened, included, and excluded studies.
3.2. Characteristics of the included studies
Ten studies were from PubMed, 3 from Embase, and none from the Cochrane Library. All included articles had available full texts. There were 5 studies with count data (3 and 2 studies with ordinal and dichotomous data, respectively)[26–30]; 9 studies had continuous data,[13,14,17,30–35] with, 1 presenting both dichotomous and continuous data.[30] Besides, for continuous data, BMD values of the femoral neck, Ward triangle, greater trochanter, total body, intertrochanteric hip, lumbar spine, hip, and phalanges were presented in the 9 studies. No further evaluation study was found in the reference lists of these studies. In addition, the reference lists of relevant articles did not produce further studies for evaluation. The characteristics of all studies are presented in Tables 1 and 2.
Table 1.
Characteristics of included studies (continuous data).
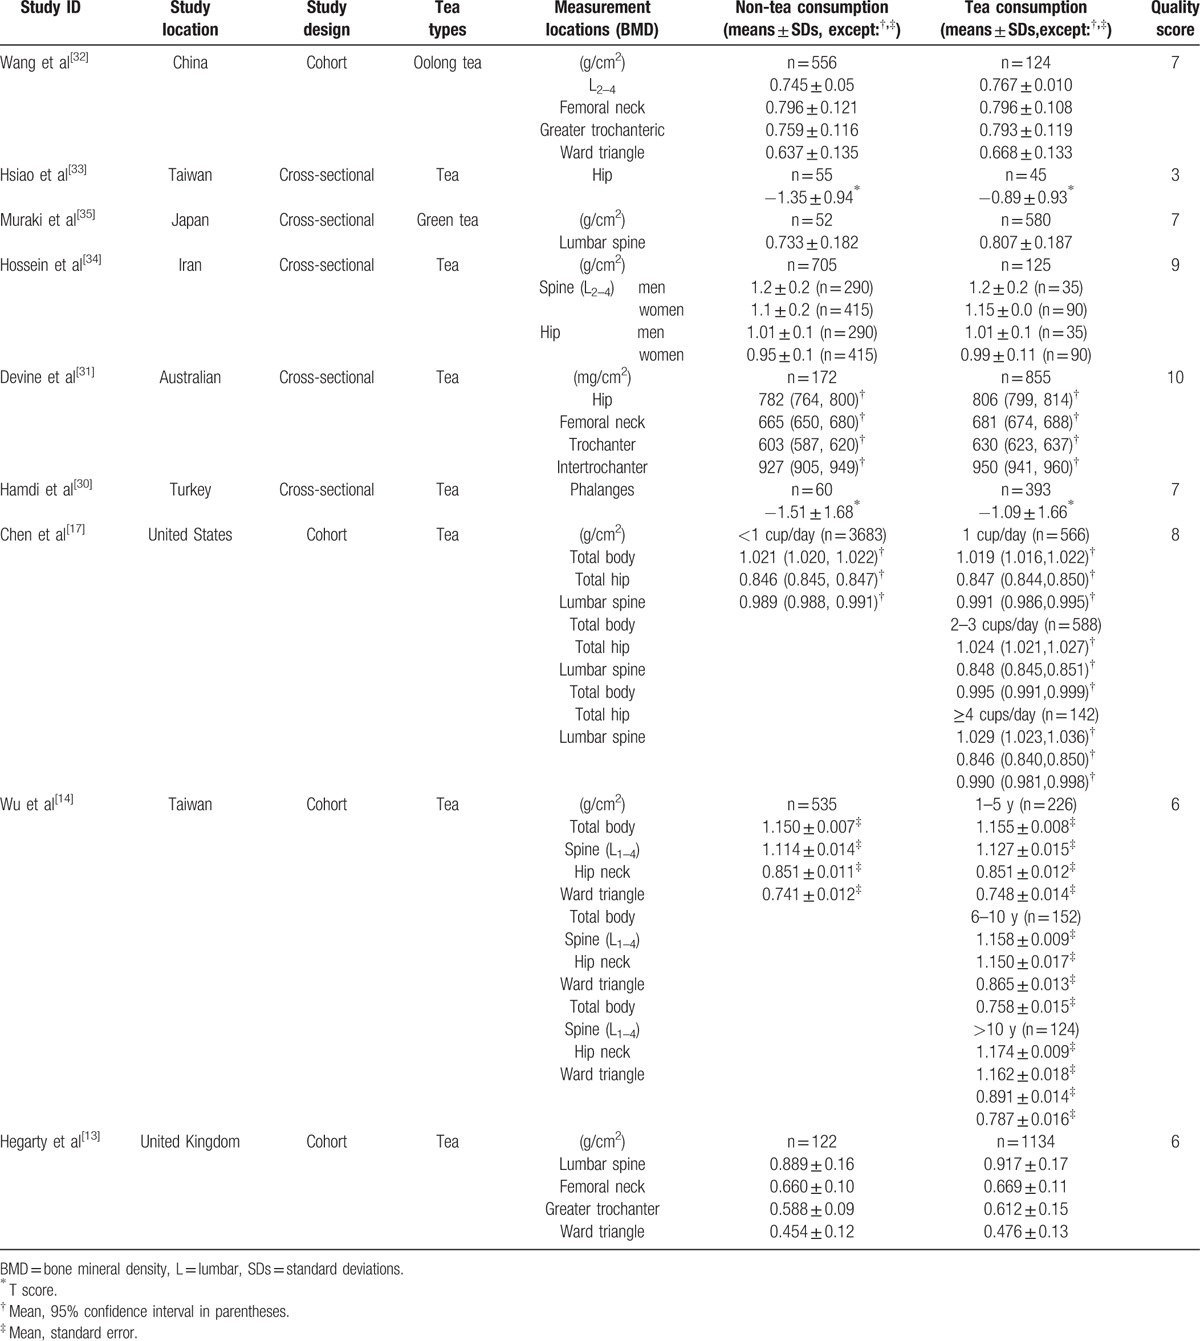
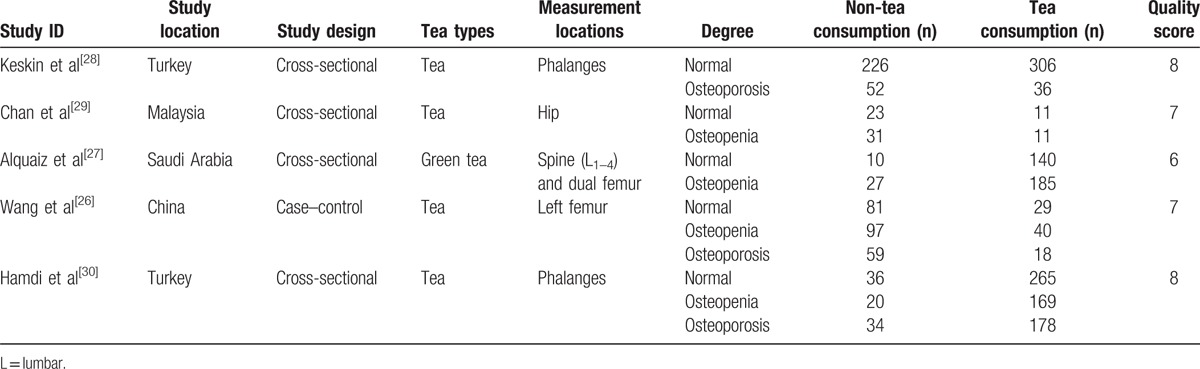
Table 2.
Characteristics of included studies (dichotomous data).
3.3. Meta-analysis results
Data from 5 studies with dichotomous variables (1 study both dichotomous and continuous data), including 1398 and 696 in the tea- and non-tea consumption groups, were assessed in this meta-analysis. Two of the studies claimed tea consumption to have a beneficial impact on BMD compared with non-tea consumption[28,29]; no correlation between them was found in the remaining 3 studies.[26,27,30] The pooled results showed that tea consumption could reduce the occurrence of low bone mass (OR = 0.66, 95% CI = 0.47–0.94, P = 0.02) (Fig. 2).
Figure 2.
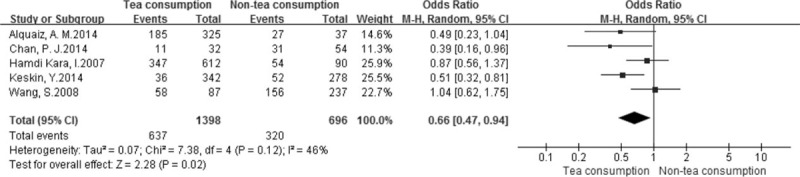
Forest plot and meta-analysis of dichotomous variables. CI = confidence interval, M-H = Mantel-Haenszel method.
We also performed a meta-analysis for continuous variables according to BMD at different locations in the 9 studies.[13,14,17,30–35] The pooled results showed that BMD values of the femoral neck (MD: 0.01, 95% CI, 0.00–0.02; P = 0.04), Ward triangle (MD: 0.02, 95% CI, 0.01–0.04, P = 0.001), greater trochanter (MD: 0.03, 95% CI, 0.02–0.04, P < 0.00001), lumbar spine (SMD: 0.19, 95% CI, 0.08–0.31, P = 0.001), and hip (SMD: 0.19, 95% CI, 0.05–0.34, P = 0.01) were higher in the tea consumption group than in the non-tea consumption group (Figs. 3 and 4). However, no statistically significant differences in BMD values of the total body (MD: 0.00, 95% CI, -0.00 to 0.00, P = 0.06), intertrochanteric hip (MD: 0.02, 95% CI, -0.01 to 0.05, P = 0.06), and phalanges (SMD: 0.25, 95% CI, -0.02 to 0.52, P = 0.07) were obtained (Figs. 3 and 4).
Figure 3.
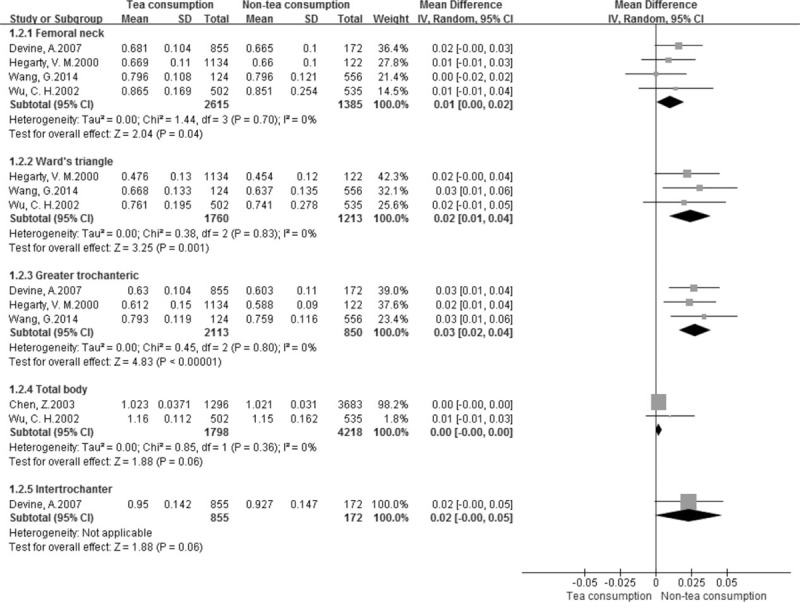
Forest plot and meta-analysis of BMD in the femoral neck, Ward triangle, greater trochanteric, total body, and intertrochanteric hip. CI = confidence interval, IV = inverse variance method, SD = standard deviation.
Figure 4.
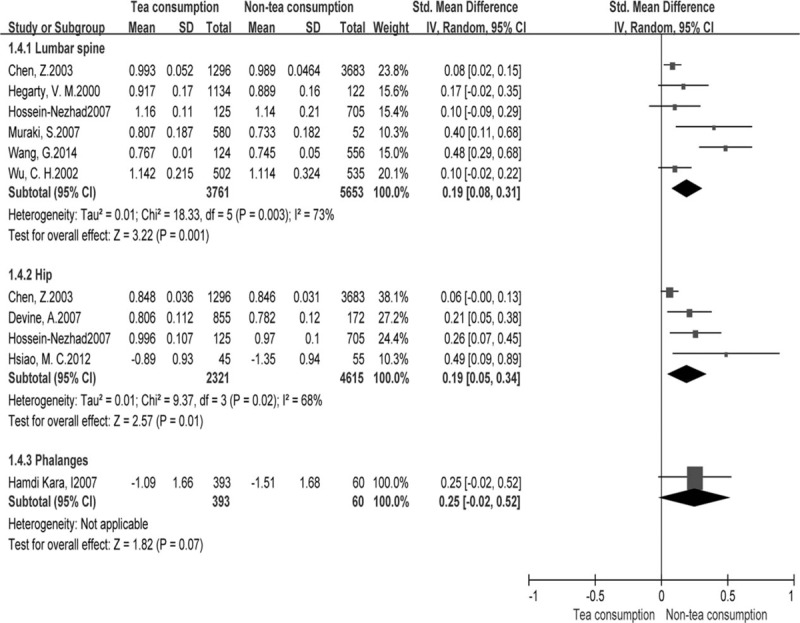
Forest plot and meta-analysis of BMD in the lumbar spine, hip, and phalanges. ; CI = confidence interval, IV = inverse variance method, SD = standard deviation.
3.4. Sensitivity and publication bias
Sensitivity analysis was performed by sequentially excluding each study in order to examine the influence of individual studies on the overall assessment. Interestingly, none of the studies fairly affected the overall findings. In addition, sensitivity analysis was conducted to access high-quality studies, and the results did not obviously change. Figure 5 shows a funnel plot for continuous variables, with slight asymmetry.
Figure 5.
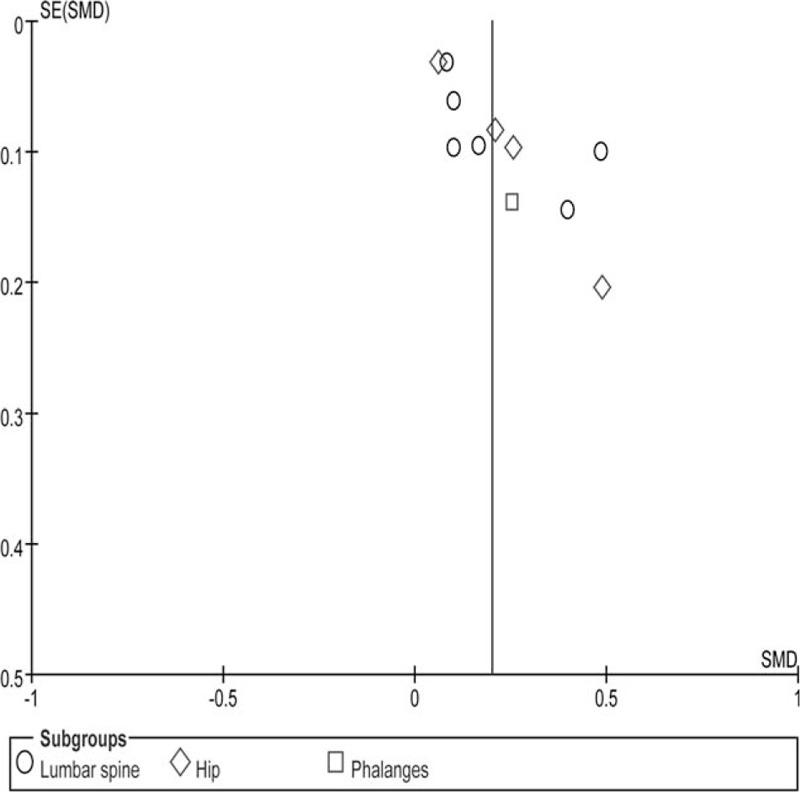
Funnel plot. SE = standard error, SMD = standardized mean difference.
4. Discussion
Tea is the most frequently consumed beverage in daily life, and its protective or harmful impacts on human health are a major public issue. This was the first meta-analysis to address this subject. Our analysis of 4 cohort, 1 case–control, and 8 cross-sectional studies with 12,635 cases indicated a potential trend that tea consumption might result in higher BMD at the femoral neck, Ward triangle, greater trochanter, lumbar spine, and hip than non-tea consumption, and might prevent bone loss.
These findings corroborate many other studies.[12,36,37] For instance, a study including 2016 cases reported that tea consumption has protective effects on the femoral neck and lumbar spine with T scores >–0.75.[36] In addition, Hoover et al[12] conducted a study of 62 postmenopausal women, and found that tea consumption yields 10% and 14% higher BMD values in the lumbar spine and femoral neck, respectively, than the non-tea consumption group. Similar results were found in animal experiments. Indeed, studies showed that tea polyphenols increase femoral BMD of female rats.[38–41] However, others reported that tea consumption has no effect on BMD.[11,42] Hernández et al[11] found no association of tea consumption with BMD, and even an inverse correlation. In addition, a study evaluating 201 cases with osteoporosis or osteopenia in Turkey reported no association of tea consumption with BMD of the lumbar spine, and a negligible correlation with the femoral neck.[42] The above 2 studies, which were not adjusted, were inconsistent with our series. Besides, a prospective randomized controlled study also found no correlation between tea and BMD,[43] the main reason likely being the small sample size.
Tea polyphenols contain abundant epigallocatechin gallate (EGCG) as the main component of tea.[44,45] EGCG has been widely studied. Its beneficial effects on bone formation are mainly through increasing alkaline phosphatase activity at both the protein and gene expression levels in osteoblastic-like cells, including SaOS-2 cells[46] and MC3T3-E1 cells, and increased formation of mineralized bone.[47] Moreover, tea polyphenols significantly promote osteoblastic survival and decrease osteoblastic apoptosis,[46] thereby leading to elevated cell proliferation and differentiation.[48] This was the theoretical basis of our research.
In this meta-analysis, no correlation was found between tea consumption and BMD of the whole body, intertrochanteric hip, and phalanges. This finding might be unreliable because only 1 or 2 studies assessing these entities were included. Meanwhile, 5 studies of dichotomous variables were included in this meta-analysis; the pooled results indicated that tea consumption could prevent bone loss. However, we did not analyze the effects of tea consumption on BMD at each location due to insufficient data provided in the above 5 studies.
Means and standard deviations were not provided for continuous data in some included articles; means and standard deviations were derived on the basis of the Cochrane Handbook. Furthermore, other studies provided ordinal data, such as normal, osteopenia, and osteoporosis; osteopenia and osteoporosis were combined into low bone mass to generate dichotomous data, as they all belong to bone mass reduction; the pooled results were similar to those of continuous data. In addition, considering that T values reflect the true levels of BMD, we included 2 studies that provided only T values.[30,33] We combined T values with BMD values using SMD, and only BMD values using MD.
Next, we performed sensitivity analysis, including only high-quality studies in order to evaluate any impact of study quality on the effect estimates. The results did not change obviously. Consequently, the low-quality studies included had no significant effects on the overall results. Moreover, between-study heterogeneity was not significant for dichotomous and continuous variables, but significant for the lumbar spine and hip. The main reason for the heterogeneity might be from different locations, populations, tea types, or study designs. These studies used the random-effects model to reduce the effect of heterogeneity; however, it was not eliminated.
This meta-analysis had the following limitations that must be taken into account. First and foremost, it included a limited number of observational trials with some being low and medium-quality studies, which might result in selective and performance bias owing to the absence of random allocation, allocation concealment, and blinding. Secondly, subgroup analysis of age, tea types, and tea in cups was not performed because of few included studies.
In summary, these findings provide a potential trend of beneficial effects of tea consumption on BMD, especially in the lumbar spine, hip, femoral neck, Ward triangle, and greater trochanter, which might help prevent bone loss.
Footnotes
Abbreviations: AHRQ = Agency for Healthcare Research and Quality, BMD = bone mineral density, CI = confidence interval, EGCG = epigallocatechin gallate, MD = mean difference, NOS = Newcastle–Ottawa scale, OR = odds ratio, SMD = standardized mean difference.
The authors report no conflicts of interest.
References
- [1].WHO Scientific Group on the Assessment of Osteoporosis at Primary Care Level. Summary Meeting Report. May 5–7, 2004; Brussels, Belgium. [Google Scholar]
- [2].G. Office of the Surgeon, Reports of the Surgeon General. Bone Health and Osteoporosis: A Report of the Surgeon General. Office of the Surgeon General (US), Rockville (MD), 2004. [PubMed] [Google Scholar]
- [3].Brown JP, Josse RG. Scientific Advisory Council of the Osteoporosis Society of Canada. 2002 Clinical practice guidelines for the diagnosis and management of osteoporosis in Canada. CMAJ 2002;156:S1–34. [PMC free article] [PubMed] [Google Scholar]
- [4].Yuen CK, Kendler D, Khan AA, et al. Osteoporosis: Canadian consensus on menopause and osteoporosis. JOGC 2002;24:35–45. [Google Scholar]
- [5].Johnell O, Kanis JA. An estimate of the worldwide prevalence and disability associated with osteoporotic fractures. Osteoporos Int 2006;17:1726–33. [DOI] [PubMed] [Google Scholar]
- [6].Trevisanato SI, Kim YI. Tea and health. Nutr Rev 2000;58:1–0. [DOI] [PubMed] [Google Scholar]
- [7].Mikuls TR, Cerhan JR, Criswell LA, et al. Coffee, tea, and caffeine consumption and risk of rheumatoid arthritis: results from the Iowa Women's Health Study. Arthritis Rheum 2002;46:83–91. [DOI] [PubMed] [Google Scholar]
- [8].Sueoka N, Suganuma M, Sueoka E, et al. A new function of green tea: prevention of lifestyle-related diseases. Ann N Y Acad Sci 2001;928:274–80. [DOI] [PubMed] [Google Scholar]
- [9].Kazuki I, Hiroshi Y, Yohei K. Effect of gargling with tea and ingredients of tea on the prevention of influenza infection: a meta-analysis. BMC Public Health 2016;16:396. [DOI] [PMC free article] [PubMed] [Google Scholar]
- [10].Shihao W, Fei L, Xiao H, et al. The association of tea consumption with bladder cancer risk: a meta-analysis. Asia Pac J Clin Nutr 2013;22:128–37. [DOI] [PubMed] [Google Scholar]
- [11].Hernández AM, Stampfer MJ, Ravnikar VA, et al. Caffeine and other predictors of bone density among pre- and perimenopausal women. Epidemiology 1993;4:128–34. [DOI] [PubMed] [Google Scholar]
- [12].Hoover PA, Webber CE, Beaumont LF, et al. Postmenopausal bone mineral density: relationship to calcium intake, calcium absorption, residual estrogen, body composition, and physical activity. Can J Physiol Pharmacol 1996;74:911–7. [PubMed] [Google Scholar]
- [13].Hegarty VM, May HM, Khaw KT. Tea drinking and bone mineral density in older women. Am J Clin Nutr 2000;71:1003–7. [DOI] [PubMed] [Google Scholar]
- [14].Wu CH, Yang YC, Yao WJ, et al. Epidemiological evidence of increased bone mineral density in habitual tea drinkers. Arch Intern Med 2002;162:1001–6. [DOI] [PubMed] [Google Scholar]
- [15].Kyriazopoulos P, Trovas G, Charopoulos J, et al. Lifestyle factors and forearm bone density in young Greek men. Clin Endocrinol 2006;65:234–8. [DOI] [PubMed] [Google Scholar]
- [16].Saitoglu M, Ardicoglu O, Ozgocmen S, et al. Osteoporosis risk factors and association with somatotypes in males. Arch Med Res 2007;38:746–51. [DOI] [PubMed] [Google Scholar]
- [17].Chen X, Pettinger MB, Ritenbaugh C, et al. Habitual tea consumption and risk of osteoporosis: a prospective study in the women's health initiative observational cohort. Am J Epidemiol 2003;158:772–81. [DOI] [PubMed] [Google Scholar]
- [18].Taggart DP, Amico R, Altman DG. Effect of arterial revascularization on survival: a systematic review of studies comparing bilateral and single internal mammary arteries. Lancet 2001;358:870–5. [DOI] [PubMed] [Google Scholar]
- [19].Wells GA, Shea B, O’Connell D, et al. The Newcastle–Ottawa Scale (NOS) for Assessing the Quality of Non-Randomized Studies in Meta-Analysis. Appl Eng Agric 2000;18:727–34. [Google Scholar]
- [20].Jiande H, Yonghai D, Xiaodan C, et al. Prevalence of suicide attempts among Chinese adolescents: a meta-analysis of cross-sectional studies. Compr Psychiatry 2015;61:78–89. [DOI] [PubMed] [Google Scholar]
- [21].Higgins JP, Thompson SG, Deeks JJ, et al. Measuring inconsistency in meta-analyses. BMJ 2003;327:557–60. [DOI] [PMC free article] [PubMed] [Google Scholar]
- [22].Higgins JP, Thompson SG. Quantifying heterogeneity in a meta-analysis. Stat Med 2002;21:1539–58. [DOI] [PubMed] [Google Scholar]
- [23].Higgins J, Green S. Cochrane Handbook for Systematic Reviews of Interventions. New York, NY: Cochrane Collaboration; 2008. [Google Scholar]
- [24].Li Z, Yu J, Miao Q, et al. The association of fish consumption with bladder cancer risk: a meta analysis. World J Surg Oncol 2011;9:107. [DOI] [PMC free article] [PubMed] [Google Scholar]
- [25].Xinxiang F, Tianxin L, Kewei X, et al. Laparoendoscopic single-site nephrectomy compared with conventional laparoscopic nephrectomy: a systematic review and meta-analysis of comparative studies. Eur Urol 2012;62:601–12. [DOI] [PubMed] [Google Scholar]
- [26].Wang S, Lin S, Zhou Y, et al. Social and behavior factors related to aged Chinese women with osteoporosis 2008;24:538–45. [DOI] [PubMed] [Google Scholar]
- [27].Alquaiz AM, Kazi A, Tayel S, et al. Prevalence and factors associated with low bone mineral density in Saudi women: a community based survey. BMC Musculoskelet Disord 2014;15:5. [DOI] [PMC free article] [PubMed] [Google Scholar]
- [28].Keskin Y, Çekin MD, Gündüz H, et al. The prevalence of osteoporosis in the Thrace region of Turkey: a community-based study. Turk Fiz Tip Rehab D 2014;60:335–40. [Google Scholar]
- [29].Chan PJ, Nurul ZZ, Chuah JS, et al. Association between risk factors of osteoporosis and bone mineral density in women of different ethnic groups in a Malaysian hospital. Int J Osteoporosis Metab Disord 2014;7:1–1. [Google Scholar]
- [30].Hamdi KI, Aydin S, Gemalmaz A, et al. Habitual tea drinking and bone mineral density in postmenopausal Turkish women: investigation of prevalence of postmenopausal osteoporosis in Turkey. Int J Vitam Nutr Res 2007;77:389–97. [DOI] [PubMed] [Google Scholar]
- [31].Devine A, Hodgson JM, Dick IM, et al. Tea drinking is associated with benefits on bone density in older women. Am J Clin Nutr 2007;86:1243–7. [DOI] [PubMed] [Google Scholar]
- [32].Wang G, Liu G, Zhao H, et al. Oolong tea drinking could help prevent bone loss in postmenopausal Han Chinese women. Cell Biochem Biophys 2014;70:1289–93. [DOI] [PubMed] [Google Scholar]
- [33].Hsiao MC, Liu CY, Wang CJ. Factors associated with low bone density among women with major depressive disorder. Int J Geriatr Psych 2012;44:77–90. [DOI] [PubMed] [Google Scholar]
- [34].Hossein N, Maghbooli ZH, Shafaie AR, et al. Relationship between tea drinking and bone mineral density in Iranian population. Iranian J Publ Health 2007;13:57–62. [Google Scholar]
- [35].Muraki S, Yamamoto S, Ishibashi H, et al. Diet and lifestyle associated with increased bone mineral density: cross-sectional study of Japanese elderly women at an osteoporosis outpatient clinic. J Orthop Sci 2007;12:317–20. [DOI] [PubMed] [Google Scholar]
- [36].Vestergaard P, Hermann AP, Gram J, et al. Evaluation of methods for prediction of bone mineral density by clinical and biochemical variables in perimenopausal women. Maturitas 2001;40:211–20. [DOI] [PubMed] [Google Scholar]
- [37].Keramat A, Patwardhan B, Larijani B, et al. The assessment of osteoporosis risk factors in Iranian women compared with Indian women. BMC Musculoskelet Disord 2008;27:28. [DOI] [PMC free article] [PubMed] [Google Scholar]
- [38].Shen CL, Wang P, Guerrieri J, et al. Protective effect of green tea polyphenols on bone loss in middle-aged female rats. Osteoporosis Int 2008;19:979–90. [DOI] [PubMed] [Google Scholar]
- [39].Shen CL, Yeh JK, Stoecker BJ, et al. Green tea polyphenols mitigate deterioration of bone microarchitecture in middle-aged female rats. Bone 2009;44:684–90. [DOI] [PubMed] [Google Scholar]
- [40].Kanis J, Johnell O, Gullberg B, et al. Risk factors for hip fracture in men from southern Europe: the MEDOS Study. Osteoporos Int 1999;9:45–54. [DOI] [PubMed] [Google Scholar]
- [41].Shen CL, Yeh JK, Stoecker BJ, et al. Green tea polyphenols protects bone microarchitecture in female rats with chronic inflammation-induced bone loss. JBMR 2008;23:458. [Google Scholar]
- [42].Beyazal MS, Çapkin E, Karkucak M, et al. The relationship of osteoporosis risk factors with bone mineral density in patients admitted our outpatient clinic in Trabzon. Turk Osteoporoz Dergisi 2016;22:17–23. [Google Scholar]
- [43].Dostal AM, Arikawa A, Espejo L. Long-term supplementation of green tea extract does not modify adiposity or bone mineral density in a randomized trial of overweight and obese postmenopausal women. Brit J Nutr 2016;146:256–64. [DOI] [PMC free article] [PubMed] [Google Scholar]
- [44].Chwan LS, James K, Yeh JC, et al. Green tea and bone metabolism. Nutr Res 2009;29:437–56. [DOI] [PMC free article] [PubMed] [Google Scholar]
- [45].Shen CL, Chyu MC. Tea flavonoids for bone health: from animals to humans. J Investig Med 2016;64:1151–7. [DOI] [PubMed] [Google Scholar]
- [46].Choi EM, Hwang JK. Effects of (+)-catechin on the function of osteoblastic cells. Biol Pharm Bull 2003;26:523–6. [DOI] [PubMed] [Google Scholar]
- [47].Vali B, Rao LG, El-Sohemy A. Epigallocatechin-3-gallate increases the formation of mineralized bone nodules by human osteoblast-like cells. J Nutr Biochem 2007;18:341–7. [DOI] [PubMed] [Google Scholar]
- [48].Mizutani A, Sugiyama I, Kuno E, et al. Expression of matrix metalloproteinases during ascorbate-induced differentiation of osteoblastic MC3T3-E1 cells. J Bone Miner Res 2001;16:2043–9. [DOI] [PubMed] [Google Scholar]