Abstract
As a new beta amyloid (Aβ) positron emission tomography (PET) tracer, 18F-FC119S has shown higher cortical uptake in patients with Alzheimer's disease (AD) than that in healthy control subjects without adverse effects in a previous preliminary study. The aim of this study was to compare 18F-FC119S PET and 11C-PiB PET in healthy control (HC) subjects, mild cognitive impairment (MCI) patients, and AD patients.
A total of 48 subjects, including 28 HC subjects, 10 MCI patients, and 10 AD patients, underwent static 18F-FC119S PET (30 minutes after intravenous [i.v.] injection) and 11C-PiB PET (40 minutes after i.v. injection) on the same day. Both PET images were visually and quantitatively assessed. Standardized uptake value ratios (SUVRs) were calculated for each brain region using the cerebellar cortex as a reference region.
None (0%) of the 28 HC subjects and 4 (40%) of 10 MCI patients had positive scans on both PET images. Of the 10 AD patients, 7 (70%) had positive scans on 11C-PiB PET while 6 (60%) had positive scans on 18F-FC119S PET. Overall, 47 (98%) of 48 participants showed identical results based on visual analysis. Cortical SUVR of 18F-FC119S was higher in AD patients (1.38 ± 0.16), followed by that in MCI patients (1.24 ± 0.10) and in HC subjects (1.14 ± 0.05). Compared with 11C-PiB PET, 18F-FC119S PET yielded a higher effect size (d = 2.02 vs. 1.67) in AD patients and a slightly lower effect size (d = 1.26 vs. 1.38) in MCI patients. In HC subjects, the nonspecific binding of 18F-FC119S to white matter (with the frontal cortex-to-white matter SUV ratio of 0.76) was slightly lower than that of 11C-PiB (ratio of 0.73). There was a significant linear correlation (slope = 0.41, r = 0.78, P < 0.001) between 11C-PiB and 18F-FC119S cortical SUVR.
We could safely obtain images similar to 11C-PiB PET imaging Aβ in the brain using 18F-FC119S PET. Therefore, 18F-FC119S might be suitable for imaging Aβ deposition.
Keywords: Alzheimer's disease, beta amyloid (Aβ), PET
1. Introduction
As population ages, the number of dementia patients worldwide is expected to increase steadily. It is estimated to reach 63 million by 2030 and 114 million by 2050.[1] Alzheimer's disease (AD) accounts for 60% to 70% of all dementia. Brain beta amyloid (Aβ) plaques and neurofibrillary tangle have been used as neuropathological hallmarks of AD.[2]11C-Pittsburgh compound B (PiB) is the first studied positron emission tomography (PET) tracer for Aβ imaging. It has been reported that the accumulation of Aβ in the brain evaluated by 11C-PiB PET is in good agreement with postmortem biopsy result of AD patients.[3,4] However, due to radioactive half-life of 11C which is only 20 minutes, 11C-PiB PET has limitations. It is only available in places where there are on-site cyclotron and radiochemistry experts.[5]
To overcome these limitations, 18F labeled Aβ PET tracers with longer radioactive half-lives (110 minutes) were developed and approved by the US Food and Drug Administration (FDA) as Aβ PET tracers in 2012 (18F-florbetapir),[6] 2013 (18F-flutemetamol),[7,8] and 2014 (18F-florbetaben).[9,10] However, these 18F labeled AB PET tracers have been reported to have somewhat lower cortical uptake compared with 11C-PiB PET.[11–13] Higher non-specific white matter uptake compared with 11C-PiB PET has also been reported in some studies.[14–16] Furthermore, some of these 18F labeled AB PET tracers are reported to be inconvenient for clinical use because of the long waiting time (90[15] and 45–130 minutes,[16] respectively) after i.v. administration of tracer to start PET imaging.
A new Aβ PET tracer, 18F-FC119S, has shown a high binding affinity (Kd, 0.16 nM) for synthetic Aβ1–42 protein aggregate showing excellent clearance from the frontal cortex in a preclinical study.[17] In preliminary clinical trial with 18F-FC119S PET conducted on 11 control subjects and 8 patients with AD, brain cortical uptake has been reported to be significantly higher in AD patients than that in control subjects without significant adverse effects.[18]
The aim of the present study was to perform head-to-head comparison for Aβ deposition assessed by 18F-FC119S and 11C-PiB PET in healthy control subjects (HC), patients with mild cognitive impairment (MCI), and patients with AD.
2. Materials
2.1. Participants
A total of 48 subjects were enrolled in the study from November 2014 to July 2015, including 28 HC subjects, 10 patients with MCI, and 10 patients with AD. The inclusion criteria for normal HC subjects were: aged 19 years or older, had no abnormal findings on neurological examination, had Mini-Mental State Examination (MMSE) score[19] of 28 or more, and had Clinical Dementia Rating (CDR) scale[20] of 0. The inclusion criteria for MCI patients were: aged 55 years or older who were abnormal or demented, had objective cognitive impairment, and had no disability in their daily lives.[21] The inclusion criteria for AD patients were: those who aged 55 years or older with definite AD or probable AD based on the National Institute of Neurological and Communicative Disorders and Stroke and the Alzheimer's Disease and Related Disorders Association Alzheimer's criteria.[22] Those with severe medical conditions or with physical imaging findings of other neurological disorders other than dementia were excluded from this study.
Subjects were recruited from 3 institutions located in the city of Seoul. All neurological examinations and imaging tests were conducted at the Korea Institute of Radiological and Medical Sciences (KIRAMS). The trial was approved by the Korea Food and Drug Administration (KFDA) and the Institutional Review Board of KIRAMS (IRB No.: K-1405-001-003). Written informed consent was obtained from all subjects or the subject's close family members.
2.2. Tracer synthesis
An efficiency automated method for radiosynthesis of 18F-labeled FC119S using sCUBE auto-synthesis module made by Futurechem (Seoul, Republic of Korea)[17] has been optimized in our PET center. The total synthesis time was 53 minutes and the non-decay corrected radiochemical yield was 27 ± 5% (n = 48). Specific activity of 18F-FC119S was >1200 Ci/mmol and the average radiochemical purity was 99%. The 11C-PIB was synthesized automatically using the Tracer LAB FXC-PRO synthesizer. Since 11C radionuclide generated by a cyclotron was transferred to the synthesizer, total synthesis time including high performance liquid chromatography purification was approximately 35 minutes. The non-decay corrected radiochemical yield base on the starting 11C was 15 ± 5% (n = 48). The average specific activity of final products was >950 Ci/mmol and the average radiochemical purity was 98%.
2.3. PET and MR imaging
All subjects underwent 18F-FC119S PET/computed tomography (CT), 11C-PiB PET/CT, and magnetic resonance imaging (MRI) within 3 months after cognitive function test. Both PET/CT scans were performed on the same day using a Siemens Biograph 6 TruePoint TrueV scanner (Siemens, Malvern, PA) with axial field of view of 216 mm and the slice thickness of 3 mm. 11C-PiB PET images were obtained from 40 to 70 minutes after i.v. injection of 970 ± 139 MBq of 11C-PiB. 18F-FC119S PET was intravenously injected at least 120 minutes after the i.v. injection of 11C-PiB. In a previous study, the ratio of cerebral cortical SUV and cerebellar cortical SUV for 18F-FC119S PET reached a peak after 30 minutes after i.v. injection of 18F-FC119S and held the shape of plateau.[18] Therefore, 18F-FC119S PET images were obtained from 30 to 60 minutes after the i.v. injection of 416 ± 59 MBq of 18F-FC119S. Imaging parameters used for CT scanning were as follows: 130 kVp, 30 mA, 0.6-s/CT rotation, and a pitch of 6. CT data were used for attenuation correction. Images were reconstructed using a conventional iterative algorithm (ordered—subsets expectation—maximization, 4 iterations and 8 subsets) and the post Gaussian filter with the full width at half maximum of 4 mm was applied on the reconstructed image. Partial volume correction was not applied to avoid overestimation of cerebral cortical uptake due to the proximity of white matter. In addition, this study was designed for the comparison of ratio of target and reference regions between both images from a subject. Therefore, benefit of partial volume correction on images analysis would be canceled out. A volumetric T1-weighted MRI (3T, MAGNETOM Trio A Tim; Siemens, Germany) was used for screening and subsequent coregistration for PET images.
Vital signs and clinical symptoms were evaluated before and after PET imaging. Adverse events and side effects were evaluated within 48 hours after the completion of imaging.
2.4. Image analysis
For visual analysis of 18F-FC119S PET and 11C-PiB PET, a “positive scan” was defined when there was an increased tracer uptake in any cortical region. A “negative scan” was defined when there was no increased tracer uptake in any cortical region.[12] Three nuclear medicine physicians independently assessed PET images without clinical information. Before reading PET images, these readers were trained with typical positive scans and typical negative scans of 18F-FC119S PET and 11C-PiB PET which were obtained from our previous study.[18] If these reviewers found a discrepancy, images were reviewed simultaneously and decisions were made by consensus.
Quantitative PET image analysis was performed without clinical information. First, 3D segmental T1-weighted MR images were automatically segmented to remove areas with high signal (such as white matter) and low signal (such as CSF). By doing so, images of the gray area were obtained for each subject. Second, PET images were fused with each segmented MR image and spatially normalized. Third, an automated anatomical labeling template[23] was applied to this image to obtain the standardized uptake value (SUV) for each region of the brain. SUV ratios (SUVRs) were calculated using the cerebellar cortex as a reference region. Global SUVR was defined as the arithmetic mean of frontal cortex, lateral temporal cortex, parietal cortex, anterior cingulate and posterior cingulate cortex, and occipital cortex SUVR.[15] Finally, we calculated the frontal cortex-to-white matter SUV ratios to assess the degree of nonspecific binding to white matter.[24] SPM8 (Wellcome Trust Centre for Neuroimaging, London, UK) was used for segmentation of MRI. PMOD (PMOD Technologies, Zurich, Switzerland) was used for other quantitative analysis.
2.5. Statistical analysis
Normal distributions for all continuous variables were evaluated using Shapiro-Wilk test. Comparisons of age, cognitive function scores, and SUVR between HC subjects and MCI or AD patients were made using independent sample t test for normally distributed variables (SUVR of frontal cortex, temporal cortex, parietal cortex, occipital cortex, and global SUVR) or Mann–Whitney U test for non-normally distributed variables (age, cognitive function scores, SUVR of anterior cingulate, posterior cingulate, and cerebral white matter). The proportion of subjects with positive findings in visual analysis was calculated for each group and the percentage of cases in which visual analysis was consistent in 18F-FC119S PET and 11C-PiB PET images were calculated. SUVRs and the frontal cortex-to-white matter SUV ratios for 18F-FC119S PET and 11C-PiB PET were compared using the Wilcoxon test. Pearson correlation analysis was performed to test correlations between the regional and global SUVRs for 18F-FC119S PET and 11C-PiB PET. Effect size for the SUVR differences between HC subjects and MCI or AD patients was calculated with Cohen d. Statistical tests were performed using Medcalc (version 16.8; Medcalc software bvba, Ostend, Belgium). All P values were 2-sided. Statistical significance was considered when P value was less than 0.05.
3. Results
3.1. Cognitive function
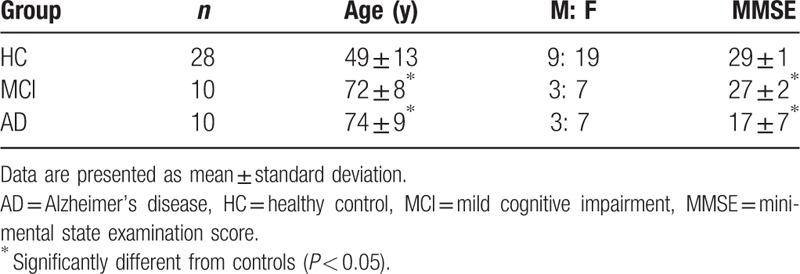
Demographic characteristics of the 3 populations are summarized in Table 1. MCI (n = 10) and AD patients (n = 10) were significantly older than HC subjects (n = 28). All 3 populations had higher (about twice) proportions of women than men. AD patients had significantly lower mean MMSE score (17.1 ± 7.5) and significantly higher CDR score (1.2 ± 0.9) than HC subjects or MCI patients. MCI patients had significantly lower mean MMSE score (26.8 ± 1.7) and significantly higher CDR score (0.5 ± 0) than HC subjects.
Table 1.
Demographics of the 3 populations used in this study.
3.2. Safety analysis
No adverse reaction was observed during or after the i.v. administration of 18F-FC119S or 11C-PiB. There was no adverse event during the follow-up period either.
3.3. Visual analysis
The typical negative images in a control subject and positive images in an AD patient are shown in Fig. 1. After adjusting the window level of 18F-FC119S PET and 11C-PiB PET with reference to the cerebellar cortex, both images showed similarly higher white matter uptake than gray matter uptake in negative cases (Fig. 1, left images). In positive cases, however, slightly lower gray matter uptake was observed in 18F-FC119S PET images than that in 11C-PiB PET images (Fig. 1, right images). The typical positive 18F-FC119S PET images showed highly increased uptakes in the frontal, temporal, parietal, and occipital cortical regions as well as cingulate gyrus as observed in typical positive 11C-PiB PET images.
Figure 1.
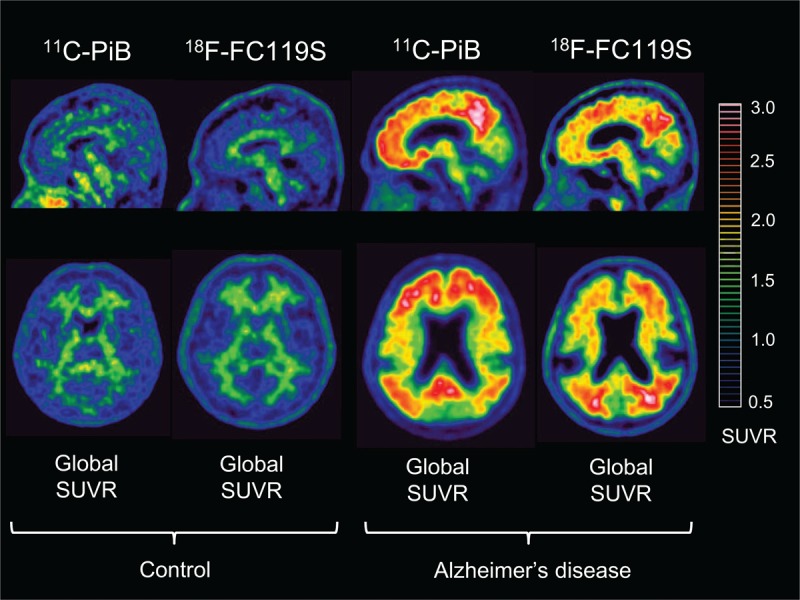
Sagittal (upper row) and transaxial (lower row) 11C-PiB PET and 18F-FC119S PET images of the same control and the same Alzheimer's disease patient. Images scaled to the same SUVR are shown. SUVR = standardized uptake value ratio.
All 28 HC subjects had negative scans. Of the 10 MCI patients, 4 (40.0%) had positive scans on both 11C-PiB PET and 18F-FC119S PET. Of the 10 AD patients, 7 (70.0%) had positive scans on 11C-PiB PET. One of these 7 patients had a negative scan on 18F-FC119S PET. Therefore, 6 (60.0%) of 10 AD patients had positive scans on 18F-FC119S PET. Overall, 47 of 48 participants (98%) showed identical results based on visual analysis of both PET images.
3.4. Quantitative analysis
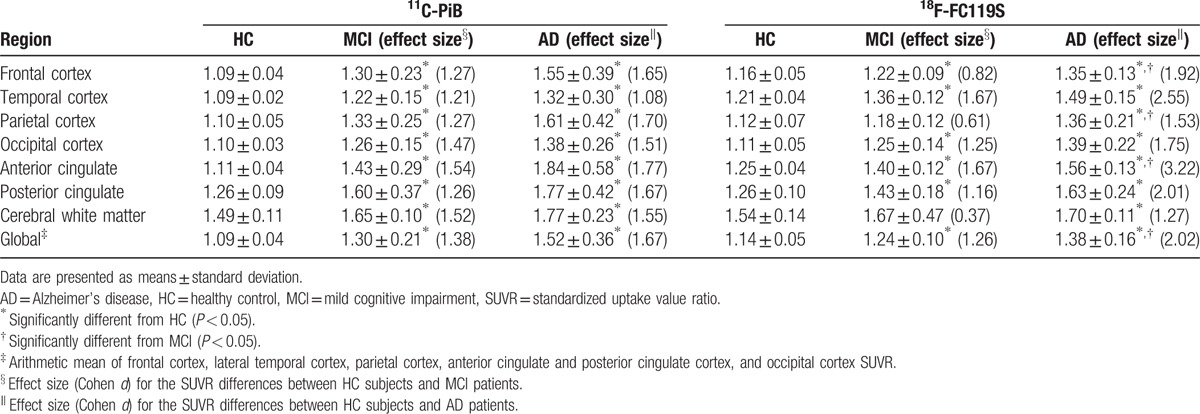
The mean values of SUVR and effect sizes by brain regions for the 3 populations are summarized in Table 2. SUVRs for 11C-PiB PET and 18F-FC119S PET were significantly higher in most cortical regions as well as global cortex in MCI or AD patients than those of HC subjects. Interestingly, SUVRs for 18F-FC119S PET in frontal, parietal cortex, anterior cingulate, and global cortex in AD patients were significantly higher than those in MCI patients. These findings were not observed in 11C-PiB PET. In HC subjects, the mean value of SUVR in cerebral white matter was about 1.5 in both tracers, which was lower than that in MCI or AD patients. 18F-FC119S PET yielded a higher effect size than 11C-PiB PET in AD patients (d = 2.02 and 1.67 for 18F-FC119S and 11C-PiB, respectively). On the contrary, 18F-FC119S PET yielded a slightly lower effect size than 11C-PiB PET in MCI patients (d = 1.26 and 1.38 for 18F-FC119S and 11C-PiB, respectively).
Table 2.
Comparison of SUVRs for 11C-PiB and 18F-FC119S and effect sized (d) in HC, MCI, and AD subjects.
Comparisons of SUVRs for 11C-PiB PET and 18F-FC119S PET in each population are illustrated in Fig. 2. In HC subjects, the global SUVR for 18F-FC119S PET was significantly higher than that for 11C-PiB PET. However, there was no significant difference between SUVR of 18F-FC119S PET and that of 11C-PiB PET in MCI or AD patients.
Figure 2.
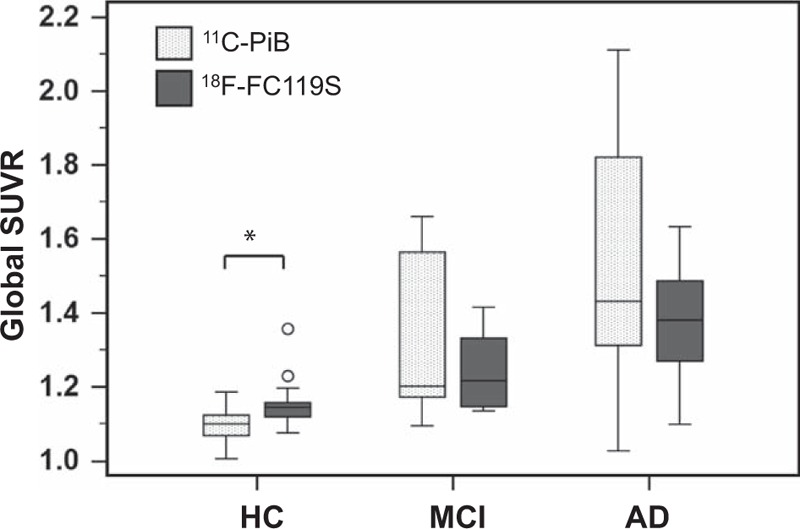
Box plots comparing global SUVR assessed with 11C-PiB PET and that with 18F-FC119S PET in HC, MCI, and AD participants. An asterisk represents significant difference between the global SUVR of 11C-PiB PET and that of 18F-FC119S PET (P < 0.001). AD = Alzheimer's disease, HC = healthy control, MCI = mild cognitive impairment, PET = positron emission tomography, SUVR = standardized uptake value ratio.
The frontal cortex-to-white matter SUV ratios in HC subjects, MCI and AD patients were 0.73 ± 0.04, 0.78 ± 0.14, and 0.86 ± 0.13, respectively, for 11C-PiB PET and 0.76 ± 0.06, 0.76 ± 0.12, and 0.79 ± 0.03, respectively, for 18F-FC119S PET. In HC subjects, the frontal cortex-to-white matter SUV ratios for 18F-FC119S PET were significantly higher than those for 11C-PiB PET (P = 0.025). However, there were no significant differences in the frontal cortex-to-white matter SUV ratios in MCI or AD patients.
Correlations between SUVRs for 11C-PiB PET and those for 18F-FC119S PET in brain regions and global cortex are shown in Table 3 and Fig. 3. A strong positive linear relationship was observed between 11C-PiB and 18F-FC119S global SUVR (r = 0.78, P < 0.001) as described by the following equation: 18F-FC119S global SUVR = (11C-PiB × 0.41) + 0.72. Also, for each cortical region, caudate nucleus, and putamen, SUVRs for 18F-FC119S PET significantly correlated with SUVRs for 11C-PiB PET. There was no significant relationship between SUVRs for 11C-PiB PET and those for 18F-FC119S PET in cerebral white matter.
Table 3.
Regional relationships for 11C-PiB and 18F-FC119S SUVRs.
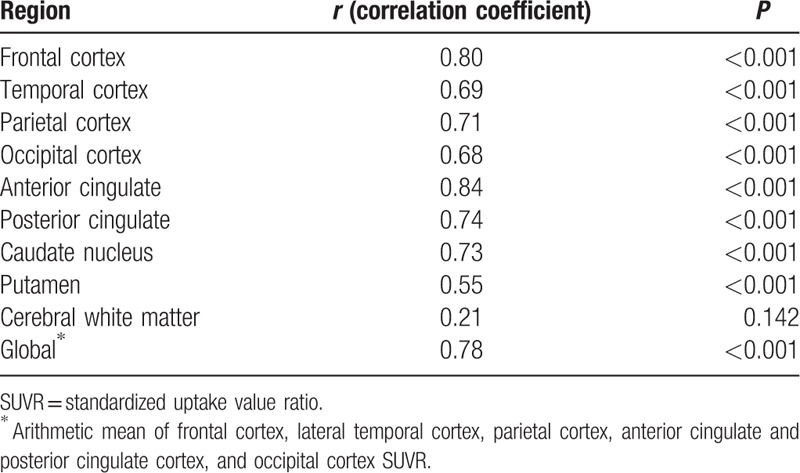
Figure 3.
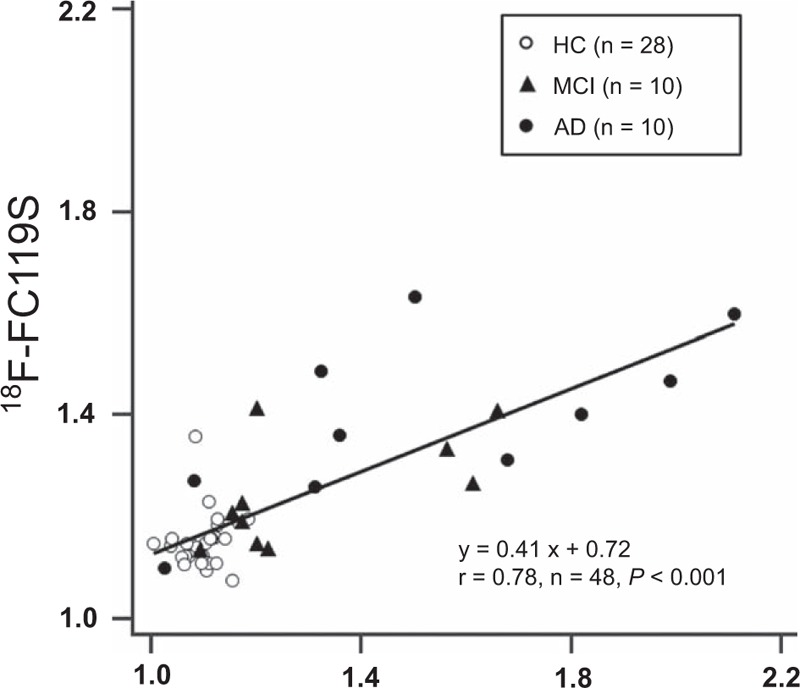
Scatter plot of the relationship between global SUVR for 11C-PiB and that for 18F-FC119S. Global SUVR for 18F-FC119S is significantly correlated with that for 11C-PiB. SUVR = standardized uptake value ratio.
4. Discussion
We demonstrated that the cortical uptake of 18F-FC119S was higher in AD patients, followed by that in MCI patients and HC subjects. Cortical uptakes of 18F-FC119S PET were significantly correlated with those of 11C-PiB PET images. The degree of nonspecific white matter binding of 18F-FC119S was slightly lower than 11C-PiB in HC subjects and 18F-FC119S PET yielded a higher effect size than 11C-PiB PET in AD patients. These results suggest that 18F-FC119S PET can be effectively and safely used for brain Aβ imaging while overcoming the short radioactive half-life of 11C-PiB.
In visual analysis, cortical uptake of 18F-FC119S was slightly lower than that of 11C-PiB in positive scans. Although quantitative analysis showed that 18F-FC119S global SUVR and 11C-PiB global SUVR were not significantly different from each other in AD and MCI patients, 18F-FC119S global SUVR tended to be lower than 11C-PiB global SUVR in 10 patients with visually positive scans both on 18F-FC119S PET and 11C-PiB PET images (median, 1.41 vs. 1.58, P = 0.084, data not shown). These results are in agreement with previous studies showing that cortical SUVR of 18F-labeled amyloid PET in AD patients is lower than that of 11C-PiB PET.[11–13] However, since visual analysis of 18F-FC119S PET and 11C-PiB PET showed the same results for 98% of the total subjects, the difference in cortical uptake might only have slight effect on the diagnostic ability of 18F-FC119S PET.
In HC subjects, cortical uptake of 18F-FC119S was significantly higher than that of 11C-PiB. High white matter uptake might affect the quantification of cortical intake. For example, if white matter is set as the reference region to quantify cortical uptake, high cortical uptake may reduce SUVR.[13] In addition, the spill-over effect of white matter might results in higher measurement of cortical uptake than its actual value. However, when measuring SUVR in amyloid PET, the reference area is set to cerebellum in most studies,[11,12,15,24–26] which is known to have very little accumulation of Aβ.[27] Furthermore, the difference between 18F-FC119S SUVR and 11C-PiB SUVR was very small (SUVR, 1.14 vs. 1.09), suggesting that such spill-over effect on the measurement of cortical uptake might be very small.
Contrary to cortical uptake, the nonspecific binding of 18F-FC119S to white matter (with the frontal cortex-to-white matter SUV ratio of 0.76) was slightly lower than that of 11C-PiB (ratio of 0.73) or other 18F-labeled amyloid radiotracers (with reported ratios ranging from 0.66 to 0.72)[24,28,29] in HC subjects. As the visual analysis of amyloid PET is based on a comparison of cortical uptake and white matter uptake,[6,8,10] amyloid radiotracer with low white matter uptake may be advantageous for visual analysis.
18F-FC119S global SUVR and 11C-PiB global SUVR showed significant correlation with each other. The slope of the linear correlation was 0.41. This slope is similar to or somewhat lower than those of other 18F labeled Aβ radiopharmaceuticals, such as 18F-flutemetamol (slope of 0.81),[13]18F-florbetapir (slopes ranging from 0.33 to 0.64),[30,31]18F-florbetaben (slope of 0.71),[11] and 18F-AZD4694.[24] Such discrepancy might be due to the similar or lower cortical uptake of 18F-FC119S compared with that of other 18F labeled Aβ radiopharmaceuticals.[11,13,30,31] However, future head-to-head comparison studies will be required to prove this.
In AD patients, 11C-PiB SUVR was relatively higher in the frontal and parietal cortices compared with the temporal and occipital cortices but 18F-FC119S SUVR was not. These findings are in line with the previous study comparing 11C-PiB and 18F-FACT, which has been considered to bind more preferentially to dense-cored amyloid plaque than 11C-PiB.[32] Regional differences in cerebral cortical SUVR were not observed between 11C-PiB and other 18F labeled amyloid tracers.[24,28,29] Therefore, the difference in regional distribution between diffuse and dense-cored amyloid plaque may be the cause of regional differences in cerebral cortical uptake between 11C-PiB and 18F-FC119S. However, further studies including histopathological evidence, such as postmortem brain analysis are necessary to support this hypothesis.
Compared with 18F-flutemetamol (90 minutes after injection)[15] or 18F-florbetaben (45–130 minutes after injection),[16]18F-FC119S has the advantage of starting PET imaging in a relatively short time after i.v. injection (30 minutes after injection). For 18F-florbetapir, PET images are obtained 30 to 50 minutes after i.v. injection.[6] On the other hand, image acquisition time of 18F-FC119S PET is 30 minutes, which is somewhat longer than other 18F labeled Aβ radiopharmaceuticals (10–20 minutes). Therefore, the total time spent for PET imaging after i.v. injection of 18F-FC119S (60 minutes) is similar to or shorter than those of other 18F labeled Aβ radiopharmaceuticals (40–150 minutes).[6,8,10]
The present study has several limitations. First, AD and MCI patients were diagnosed with clinical criteria only. No autopsy was performed. Second, the mean age of HC subjects (49 years) was significantly smaller than that of AD (74 years) or MCI patients (72 years). In visual analysis, none of the 28 HC subjects showed positive scan in this study. This was different from previous report showing that 18% and 10% of healthy controls showed positive scans on 11C-PiB PET[33] and 18F-florbetaben PET,[15] respectively. It has been also reported that 20% to 34% of healthy elderly aged over 75 years have Aβ neuropathology.[34] As all of our HC subjects were under the age of 62 years in the current study, future 18F-FC119S PET studies with healthy elderly aged over 75 years might be needed. Finally, since this study was performed with a relatively small number of subjects in a single institution, a multi-institutional study involving a larger number of subjects is required to verify the results of this study.
In conclusion, we could safely obtain images similar to 11C-PiB PET Aβ imaging for the brain using 18F-FC119S PET. The cortical uptake of 18F-FC119S was significantly correlated with the cortical uptake of 11C-PiB. Visual analyses of the 2 PET images were also in good agreement. Compared with 11C-PiB PET, 18F-FC119S PET yielded a higher effect size in AD patients and showed the slightly lower binding to white matter in HC subjects. The total time spent for 18F-FC119S PET imaging is similar or shorter than that for other 18F labeled Aβ radiotracers. These results suggest that 18F-FC119S might be suitable for imaging Aβ deposition.
Footnotes
Abbreviations: Aβ = beta amyloid, AD = Alzheimer's disease, HC = healthy control, MCI = mild cognitive impairment, SUVR = standardized uptake value ratio.
This work was supported by Establishment and Operation of Research Infrastructure for Radioisotope Application (50461-2017), funded by Ministry of Science, ICT and Future Planning, Republic of Korea
Conflicts of interest: None.
References
- [1].Wimo A, Winblad B, Aguero-Torres H, et al. The magnitude of dementia occurrence in the world. Alzheimer Dis Assoc Disord 2003;17:63–7. [DOI] [PubMed] [Google Scholar]
- [2].Mirra SS, Heyman A, McKeel D, et al. The Consortium to Establish a Registry for Alzheimer's Disease (CERAD). Part II. Standardization of the neuropathologic assessment of Alzheimer's disease. Neurology 1991;41:479–86. [DOI] [PubMed] [Google Scholar]
- [3].Rowe CC, Ng S, Ackermann U, et al. Imaging beta-amyloid burden in aging and dementia. Neurology 2007;68:1718–25. [DOI] [PubMed] [Google Scholar]
- [4].Klunk WE, Engler H, Nordberg A, et al. Imaging brain amyloid in Alzheimer's disease with Pittsburgh Compound-B. Ann Neurol 2004;55:306–19. [DOI] [PubMed] [Google Scholar]
- [5].Villemagne VL, Rowe CC. Amyloid PET ligands for dementia. PET Clin 2010;5:33–53. [DOI] [PubMed] [Google Scholar]
- [6].FDA prescribing information Florbetapir F 18. Available at: http://www.accessdata.fda.gov/drugsatfda_docs/label/2012/202008s000lbl.pdf. Accessed Dec 26, 2016. [Google Scholar]
- [7].Choi SR, Golding G, Zhuang Z, et al. Preclinical properties of 18F-AV-45: a PET agent for Abeta plaques in the brain. J Nucl Med 2009;50:1887–94. [DOI] [PMC free article] [PubMed] [Google Scholar]
- [8].FDA prescribing information flutemetamol F 18. Available at: http://www.accessdata.fda.gov/drugsatfda_docs/label/2014/203137s002lbl.pdf. Accessed Dec 26, 2016. [Google Scholar]
- [9].Zhang W, Oya S, Kung MP, et al. F-18 Polyethyleneglycol stilbenes as PET imaging agents targeting Abeta aggregates in the brain. Nucl Med Biol 2005;32:799–809. [DOI] [PubMed] [Google Scholar]
- [10].FDA prescribing information Florbetaben F 18. Available at: http://www.accessdata.fda.gov/drugsatfda_docs/label/2014/204677s000lbl.pdf. Accessed Dec 26, 2016. [Google Scholar]
- [11].Villemagne VL, Mulligan RS, Pejoska S, et al. Comparison of 11C-PiB and 18F-florbetaben for Abeta imaging in ageing and Alzheimer's disease. Eur J Nucl Med Mol Imaging 2012;39:983–9. [DOI] [PubMed] [Google Scholar]
- [12].Hatashita S, Yamasaki H, Suzuki Y, et al. [18F]Flutemetamol amyloid-beta PET imaging compared with [11C]PIB across the spectrum of Alzheimer's disease. Eur J Nucl Med Mol Imaging 2014;41:290–300. [DOI] [PubMed] [Google Scholar]
- [13].Landau SM, Thomas BA, Thurfjell L, et al. Amyloid PET imaging in Alzheimer's disease: a comparison of three radiotracers. Eur J Nucl Med Mol Imaging 2014;41:1398–407. [DOI] [PMC free article] [PubMed] [Google Scholar]
- [14].Clark CM, Schneider JA, Bedell BJ, et al. Use of florbetapir-PET for imaging beta-amyloid pathology. JAMA 2011;305:275–83. [DOI] [PMC free article] [PubMed] [Google Scholar]
- [15].Barthel H, Gertz HJ, Dresel S, et al. Cerebral amyloid-beta PET with florbetaben (18F) in patients with Alzheimer's disease and healthy controls: a multicentre phase 2 diagnostic study. Lancet Neurol 2011;10:424–35. [DOI] [PubMed] [Google Scholar]
- [16].Vandenberghe R, Van Laere K, Ivanoiu A, et al. 18F-flutemetamol amyloid imaging in Alzheimer disease and mild cognitive impairment: a phase 2 trial. Ann Neurol 2010;68:319–29. [DOI] [PubMed] [Google Scholar]
- [17].Lee BS, Chu SY, Kwon HR, et al. Synthesis and evaluation of 6-(3-[(18)F]fluoro-2-hydroxypropyl)-substituted 2-pyridylbenzothiophenes and 2-pyridylbenzothiazoles as potential PET tracers for imaging Abeta plaques. Bioorg Med Chem 2016;24:2043–52. [DOI] [PubMed] [Google Scholar]
- [18].Byun BH, Kim BI, Lim IH, et al. Quantification of amyloid-βdeposition using 18F-FC119S PET in human brains: a phase 0-1 study. EANM’15, 28th Annual EANM Congress of the European Association of Nuclear Medicine 2015, 10-14 October 2015, Hamburg, Germany. Eur J Nucl Med Mol Imaging 2015;42suppl 1:S1–924. [DOI] [PubMed] [Google Scholar]
- [19].Folstein MF, Folstein SE, McHugh PR. “Mini-mental state”. A practical method for grading the cognitive state of patients for the clinician. J Psychiatr Res 1975;12:189–98. [DOI] [PubMed] [Google Scholar]
- [20].Johansson K, Lindgren I, Widner H, et al. Can sensory stimulation improve the functional outcome in stroke patients? Neurology 1993;43:2189–92. [DOI] [PubMed] [Google Scholar]
- [21].Winblad B, Palmer K, Kivipelto M, et al. Mild cognitive impairment—beyond controversies, towards a consensus: report of the International Working Group on Mild Cognitive Impairment. J Intern Med 2004;256:240–6. [DOI] [PubMed] [Google Scholar]
- [22].McKhann G, Drachman D, Folstein M, et al. Clinical diagnosis of Alzheimer's disease: report of the NINCDS-ADRDA Work Group under the auspices of Department of Health and Human Services Task Force on Alzheimer's Disease. Neurology 1984;34:939–44. [DOI] [PubMed] [Google Scholar]
- [23].Tzourio-Mazoyer N, Landeau B, Papathanassiou D, et al. Automated anatomical labeling of activations in SPM using a macroscopic anatomical parcellation of the MNI MRI single-subject brain. Neuroimage 2002;15:273–89. [DOI] [PubMed] [Google Scholar]
- [24].Rowe CC, Pejoska S, Mulligan RS, et al. Head-to-head comparison of 11C-PiB and 18F-AZD4694 (NAV4694) for beta-amyloid imaging in aging and dementia. J Nucl Med 2013;54:880–6. [DOI] [PubMed] [Google Scholar]
- [25].Ito H, Shimada H, Shinotoh H, et al. Quantitative analysis of amyloid deposition in Alzheimer Disease using PET and the radiotracer (1)(1)C-AZD2184. J Nucl Med 2014;55:932–8. [DOI] [PubMed] [Google Scholar]
- [26].Akamatsu G, Ikari Y, Ohnishi A, et al. Automated PET-only quantification of amyloid deposition with adaptive template and empirically pre-defined ROI. Phys Med Biol 2016;61:5768–80. [DOI] [PubMed] [Google Scholar]
- [27].Svedberg MM, Hall H, Hellstrom-Lindahl E, et al. [(11)C]PIB-amyloid binding and levels of Abeta40 and Abeta42 in postmortem brain tissue from Alzheimer patients. Neurochem Int 2009;54:347–57. [DOI] [PubMed] [Google Scholar]
- [28].Wong DF, Rosenberg PB, Zhou Y, et al. In vivo imaging of amyloid deposition in Alzheimer disease using the radioligand 18F-AV-45 (flobetapir F 18). J Nucl Med 2010;51:913–20. [DOI] [PMC free article] [PubMed] [Google Scholar]
- [29].Villemagne VL, Ong K, Mulligan RS, et al. Amyloid imaging with 18F-florbetaben in Alzheimer disease and other dementias. J Nucl Med 2011;52:1210–7. [DOI] [PubMed] [Google Scholar]
- [30].Wolk DA, Zhang Z, Boudhar S, et al. Amyloid imaging in Alzheimer's disease: comparison of florbetapir and Pittsburgh compound-B positron emission tomography. J Neurol Neurosurg Psychiatry 2012;83:923–6. [DOI] [PMC free article] [PubMed] [Google Scholar]
- [31].Landau SM, Breault C, Joshi AD, et al. Amyloid-beta imaging with Pittsburgh compound B and florbetapir: comparing radiotracers and quantification methods. J Nucl Med 2013;54:70–7. [DOI] [PMC free article] [PubMed] [Google Scholar]
- [32].Ito H, Shinotoh H, Shimada H, et al. Imaging of amyloid deposition in human brain using positron emission tomography and [18F]FACT: comparison with [11C]PIB. Eur J Nucl Med Mol Imaging 2014;41:745–54. [DOI] [PubMed] [Google Scholar]
- [33].Hatashita S, Yamasaki H. Clinically different stages of Alzheimer's disease associated by amyloid deposition with [11C]-PIB PET imaging. J Alzheimers Dis 2010;21:995–1003. [DOI] [PubMed] [Google Scholar]
- [34].Bennett DA, Schneider JA, Arvanitakis Z, et al. Neuropathology of older persons without cognitive impairment from two community-based studies. Neurology 2006;66:1837–44. [DOI] [PubMed] [Google Scholar]


