

Abstract
Multicellular tumor spheroids (MCTS) are valuable in vitro tumor models frequently used to evaluate the penetration and efficacy of therapeutics. In this study, we evaluated potential differences in epigenetic markers, i.e. histone post-translational modifications (PTMs), in the layers of the HCT116 colon carcinoma MCTS. Cells were grown in agarose-coated 96 well plates, forming reproducible 1mm diameter MCTS. The MCTS were fractionated into three radially concentric portions, generating samples containing cells from the core, the mid and the external layers. Using mass spectrometry (MS) based proteomics and EpiProfile, we quantified hundreds of histone peptides in different modified forms; by combining the results of all experiments we quantified the abundance of 258 differently modified peptides, finding significant differences in their relative abundance across layers. Among these differences, we detected higher amounts of the repressive mark H3K27me3 in the external layers as compared to the core. We then evaluated the epigenetic response of MCTS following UNC1999 treatment, a drug targeting the enzymes that catalyze H3K27me3, namely the polycomb repressive complex 2 (PRC2) subunits enhancer of zeste 1 (EZH1) and enhancer of zeste 2 (EZH2). UNC1999 treatment resulted in significant differences in MCTS diameter under drug treatment of varying duration. Using matrix-assisted laser desorption/ionization (MALDI) imaging we determined that the drug penetrates the entire MCTS. Proteomic analysis revealed a decrease in abundance of H3K27me3 as compared to untreated sample, as expected. Interestingly, we observed a comparable growth curve for MCTS under constant drug treatment over 13 days with those treated for only four days at the beginning of their growth. We thus demonstrate that MS based proteomics can define significant differences in histone PTM patterns in sub-millimetric layers of 3D cultures. Moreover, we show that our model is suitable for monitoring drug localization and regulation of histone PTMs after drug treatment.
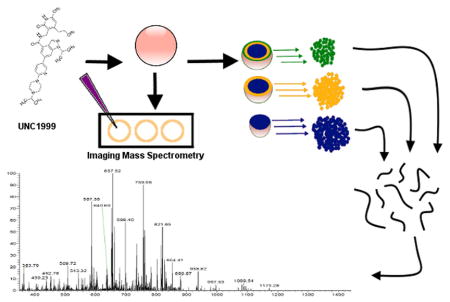
Graphical Abstract
Introduction
The Role of Histones
Histones are protein complexes that interact with DNA, providing structural support and organization for chromosomes in eukaryotic cells.1 Histones act like a spindle, winding and compacting DNA into chromatin. The tightness of the winding affects the transcription of genes wound over the histones. Modification of the DNA or post-translational modification of histones can change which genes are wound over histones, which affects the transcription of these genes.2 The inheritable changes in transcription caused by chemical modifications of the chromatin without changing the gene sequence are the focus of epigenetics.3
Histone PTMs affect the strength of the interaction between the histone and DNA. These PTMs include ubiquitylation, SUMOylation, phosphorylation, acetylation, and methylation. Each histone PTM can play multiple roles to modulate chromatin structure and increase or decrease histone affinity for DNA.2,4 Hyper-methylation of histone H3 lysine 27 (H3K27) has been implicated in cancer,5 and found to influence tumor cell proliferation through repression of genes by chromatin remodeling.6,7 H3K27 di- and trimethylation (me2/me3) is controlled by the polycomb repressive complex 2 (PRC2),8 which contains the methyltransferase family enhancer of zeste homologs 1 and 2, aka EZH1 and EZH2.9,10 These modifications are generally associated with gene silencing. In fact, by inhibiting the PRC2 complex and/or EZH1/2 activity through pharmaceutical intervention, the repressed genes can be reactivated after turnover of triple methylation.11,12
The MCTS model system
The multicellular tumor spheroid (MCTS) is a three-dimensional (3D) cell culture system. MCTS are an in vitro model system of intermediate complexity for the study of tumors.13 Multiple MCTS of uniform size and shape can be grown concurrently in a 96-well plate format.14 They grow to a diameter of about 1mm and reach full size after two weeks in culture. MCTS are chemically and phenotypically reproducible from plate to plate, enabling bulk MCTS analyses using single or multiple plates.14 MCTS partially recapitulate the tumor microenvironment through their growth patterns.15 As the MCTS grows, several radially symmetric chemical gradients develop. Gradients for nutrients, lactate and other species are established in the MCTS and impact the viability of the cells within the structure. The outer proliferative layer of cells grow in normoxic conditions and neutral pH, while the perinecrotic core region experiences hypoxia and lower pH conditions.16 The cells near the core are entering or preparing to enter necrosis or apoptosis. Many of the cells in the core are dead, but the core does contain some living cells along with cell debris from necrosis and apoptosis.13–16 The middle quiescent layer contains cells that are mostly in cell-cycle arrest. The cells in the quiescent layer do not actively divide, but maintain other cellular processes.
MCTS can be harvested in their concentric cell layers for additional analyses through a process called serial trypsinization. This procedure enables studies of MCTS cell subpopulations.15 A sequence of trypsin treatments progressively dissociates cells from the MCTS, resulting in a separation of sub-millimetric radial layers. McMahon et al. obtained the isolated fractions of cells from outer, intermediate, and necrotic regions of multiple MCTS. Using quantitative iTRAQ labeling, they examined protein expression profiles from the MCTS regions and quantified abundance changes.17 We previously employed serial trypsinization to characterize the thickness of the layers generated by serial trypsinization and study the metabolism of glycosphingolipids in different regions of MCTS18 as well as quantitatively analyzing drug and active metabolites in MCTS.19
MCTS provide a model system for evaluation of drug distribution over time. MCTS simulate tissue drug transport,20 providing a more realistic in vitro testing platform as compared to 2D cell culture. The spatial distribution of irinotecan and its metabolites in HCT116 MCTS was mapped with imaging mass spectrometry (MS),21 and later with quantitative tandem mass spectrometry (MS/MS).19 Thanks to the preliminary successes, the method has been further applied to evaluate the distribution of other drugs using multiple different MCTS systems.22–25 Monitoring spatial distribution of drugs and drug metabolites in MCTS provides crucial information in determining optimum duration and dosage of drug treatment.
MCTS Epigenetics
MCTS and other 3D cultures exhibit modified epigenetic profiles and better approximate tumor epigenetics when compared to 2D cell culture. Cesarz and Tamama found histone H3 lysine 9 acetylation (H3K9ac) increased when mesenchymal stem cells were cultured as MCTS, when compared to 2D cultured mesenchymal stem cells.26 When introduced to matrix conditioned with human embryonic stem cells (hESC), C8161 melanoma cultures attained phenotypes similar to 3D cultures formed by hESC. The altered microenvironment induced multiple epigenetic changes in the melanoma cells.27 Laminin-1 was shown as an inducer of epigenetic change in 3D breast cancer cultures by Benton et al.28 The changes in matrix composition affected the methylation of promoter regions in the DNA. In CP70 ovarian cancer cells, alterations in chromatin structure through 2D-to-3D transitions were reflected in the increase of repressive-marked promoters and a decrease in multivalent (combination of repressive and permissive) markers.29 These studies implicate the 3D microenvironment as a factor in epigenetic alteration.
MCTS have been used as models in previous epigenetic drug research. An EZH2 methyltransferase inhibitor, GSK343, was tested for effectiveness in ovarian cancer MCTS.30 Prospective inhibitors of EZH2 were screened in ovarian cancer MCTS in a separate study, identifying multiple small molecule inhibitors.31 In each effort, the investigators utilized the MCTS as a system more similar to tumors to provide accurate epigenetic screening data. None of these studies utilized the spatial heterogeneity of MCTS to examine drug distribution or epigenetic alterations in MCTS layers over time.
Proteomic Analyses
Due to the high mass resolution, exact localization of modifications, and high sensitivity, MS-based proteomics is a widely-adopted technique for the characterization of proteins and proteomes. In particular, MS has been extensively applied for the quantification of histone peptides, due to the importance of such PTMs in transcription and epigenetics.32–34 Recently, data independent acquisition (DIA) has been established for the analysis of histone peptides, leading to the possibility to re-mine datasets and quantify all isobarically modified peptides in an unbiased manner.35–37 There are established workflows for histone analysis by MS for both data dependent acquisition and DIA. One effective approach includes propionic anhydride derivatization of free amines to assist tryptic digestion into peptides of suitable length, and increase hydrophobicity of histone peptides for better chromatographic separation.38 With proteomics, we can study the histone modifications in biological model systems, such as MCTS.
The goal of this study is to establish the usefulness of MCTS tumor models combined with MS histone analysis as a tool for epigenetic drug evaluation. MS data were compared to growth assays to gauge phenotypic effects using the same batch of MCTS. The effects of epigenetic drug treatment on the epigenetic code were analyzed and quantified directly using mass spectrometry-based proteomic analysis in a spatiotemporal manner. Here, we evaluated the penetration and effects of UNC1999, a small-molecule inhibitor of EZH1 and EZH2,39 in HCT116 MCTS. UNC1999 was previously tested in several cancer systems, including mixed lineage leukemia (MLL) -rearranged leukemia,40 multiple myeloma,41 and colon cancer,42 as well as the non-cancer system chronic graft-versus-host disease.43 UNC1999 was shown to have high potency in cell cultures without causing cell death, as well as high specificity toward the EZH1/2 enzymes.39 Because it is orally bioavailable, highly specific, and effective at low concentrations, UNC1999 is a practical test compound to evaluate this epigenetic drug screening platform.
For the first time, the spatial distribution of an epigenetic drug, phenotypic data, and quantitative spatial data with both modified and unmodified histone peptides were obtained in one study, using previously established and vetted workflows in combination. By combining this data collection into one workflow, we obtained an unprecedented amount of information about epigenetic drug effects on the MCTS system with regards to epigenetic alterations by both MS and traditional assays using the same cohort of MCTS.
Materials and Methods
Materials
HCT116 cells were obtained from the ATCC. Dilute cell culture-grade trypsin with EDTA (GE Hyclone, 0.05% trypsin, 0.2 g/L EDTA) was used for the serial trypsinization process. A 2% solution of agarose (Sigma) was used for coating 96-well plates. Ultra-low binding round bottom 96-well plates (Thermo) were used for the growth assay. UNC1999 and dimethyl sulfoxide (DMSO) were obtained from Cayman Chemicals and Sigma. UNC1999 was dissolved in DMSO at 10 mM and then diluted to a final concentration of 5 μM in cell culture media. McCoy’s 5A media (Gibco) supplemented with 10% FBS and 1% L-Glutamine was sterile filtered and used for all cell culture experiments.
MCTS Growth and Serial Trypsinization
MCTS from HCT116 cells were grown in the inner 60 wells of agarose-coated 96-well plates as previously described.14,44 Monolayer cells were trypsinized from a T25 cell culture flask, and cells were counted on a hemocytometer grid prior to suspension in plating media. Each well was seeded with 6000 cells in 200 μL of media. Three experimental conditions were used: empty vehicle (without drug), early treatment, and late treatment. Eight plates were grown for each experimental condition, for a total of 480 MCTS per condition (Figure 1A). The plating media for the early treatment contained 5 μM UNC1999 drug in DMSO. The plating media for late treatment and empty vehicle conditions contained an equivalent volume of DMSO without drug. All plates were incubated at 37°C and 5% CO2. MCTS formations were observed on the third day. On day 4 after plating, the media was completely exchanged; all conditions received empty vehicle media. MCTS growth was monitored for 9 days, with 100 μL empty vehicle media changes every 48 hours. On day 13, the late treatment condition media was completely exchanged with media containing 5 μM UNC1999 drug in DMSO. MCTS from early treatment and control were harvested on day 13 and subjected to serial trypsinization as previously described,17 with the exception that serial trypsinization was scaled up to accommodate four plates at a time. Cell layers were collected into 50 mL Falcon tubes. Micrographs of the MCTS were obtained immediately prior to serial trypsinization, and MCTS measurements were scaled against a standard hemocytometer grid. On day 17, late treatment MCTS were harvested and subjected to scaled up serial trypsinization. Serial trypsinization products were centrifuged at 1000 g for five minutes, and media-trypsin supernatant was removed, leaving cell pellets behind. Cells were washed with cold phosphate buffered saline, centrifuged again, and the saline was removed. Cells were frozen at −80°C until MS sample preparation.
Figure 1. Workflow for histone PTM spatial analysis.

(A) MCTS were grown in 24 agarose-coated plates consisting of eight replicates each of three separate conditions. A growth assay for each condition was performed in an ultra-low-binding round-bottom plate (lower right plate). (B) MCTS were micrographed, and imaging mass spectrometry was performed to analyze drug distribution. (C) Serial trypsinization was performed to fractionate the MCTS into outer, middle, and core layers. (D) After histone extraction, high-resolution mass spectrometry was performed.
Concurrently, an ultra-low binding 96-well round bottom plate was plated in a similar manner to the previous plates, with the following exceptions: no agarose was used to coat the bottom of the inner 60 wells of the plate, and the plate was split into quadrants. Two quadrants were plated with drug-containing media consisting of a 5 μM UNC1999 solution. The other two quadrants were plated with empty vehicle media. Micrographs of each well were obtained every day after MCTS formed (Figure 1B). MCTS were measured and scaled as stated above. On day 4 after plating, the media was exchanged. The two quadrants in the top half of the plate retained their respective conditions (full-time empty vehicle and full-time treatment conditions), while the bottom two quadrants received new conditions. The previously treated quadrant received empty vehicle media (four-day treatment/nine-day empty vehicle, 4T-9EV), while the bottom (previously empty vehicle) quadrant received drug-containing media (four-day empty vehicle/9-day treatment, 4EV/9T). MCTS were grown for 13 days with 100 μL media changes every 48 hours.
Phenotypic Data Collection
Diameter measurements obtained via microscopy from the ultra-low binding plate were compiled (Supplementary Table S2). The measurements for full-time treatment, full-time empty vehicle, 4T-9EV, and 4EV-9T were each averaged, and the standard deviation was obtained. The variance of each distribution was compared with an F-test to determine whether the variances were equal. A two-tailed independent t-test was applied to sample pairs to determine statistical significance (p<0.05).
Histone Preparation and Mass Spectrometry of Histone Peptides
Nuclei were isolated and histone proteins were extracted as described in the protocol of Sidoli et al.38 Briefly, histones were acid extracted from nuclei with 0.2 M H2SO4 for 2 hours and precipitated with 33% trichloroacetic acid (TCA) overnight. The derivatization and digestion were performed as previously described.38 Briefly, histones were dissolved in 30 μL of 50 mM NH4HCO3, pH 8.0, and a mixture of propionic anhydride with acetonitrile (ratio of 1:3 (v/v)) was added to the histone sample in the ratio of 1:4 (v/v) for 20 minutes at room temperature. This reaction was performed twice. Histones were then digested with trypsin (enzyme:sample ratio 1:20, 6 hours, room temperature) in 50 mM NH4HCO3. After digestion, derivatization was repeated to propionylate peptide N-termini. Samples were desalted prior LC-MS analysis using C18 Stage-tips. Samples were then separated using a 75 μm ID × 17 cm Reprosil-Pur C18-AQ (3 μm; Dr. Maisch GmbH, Germany) nano-column mounted on an EASY-nLC nanoHPLC (Thermo Scientific, San Jose, Ca, USA). The HPLC gradient was as follows: 2% to 28% solvent B (A = 0.1% formic acid; B = 95% MeCN, 0.1% formic acid) over 45 minutes, from 28% to 80% solvent B in 5 minutes, 80% B for 10 minutes at a flow-rate of 300 nL/min. nLC was coupled online to an LTQ-Orbitrap Elite mass spectrometer (Thermo Scientific) and data were acquired using data-independent acquisition (DIA) (Figure 1D) as previously described.39,40 Briefly, full scan MS (m/z 300–1100) was acquired in the Orbitrap with a resolution of 120,000 (at 200 m/z) and an AGC target of 5×10e5. MS/MS was performed in the ion trap with sequential isolation windows of 50 m/z with an AGC target of 3×10e4, a CID collision energy of 35 and a maximum injection time of 50 msec. MS/MS data were collected in centroid mode. All raw files are available on https://chorusproject.org at the project no. 1129. Data was obtained with biological triplicate for each condition.
nLC-MS/MS Data Analysis
Data were searched using EpiProfile.45 The peptide relative ratio was calculated using the total area under the extracted ion chromatograms of all peptides with the same amino acid sequence (including all of its modified forms) as 100%. For isobaric peptides, the relative ratio of two isobaric forms was estimated by averaging the ratio for each fragment ion with different mass between the two species. Statistical significance was assessed using ANOVA with excel (resource package real-statistics.com), and changes between treated and untreated or between spheroid layers were considered significant when ANOVA p-value was <0.05. When binary comparisons were performed (Supplementary Table S1) t-test was used instead of ANOVA for p-value calculation. For heatmap generation we converted relative abundances into z-score normalized values, in order to highlight relative changes for each mark across conditions.
MALDI IMS and Data Analysis
The slides were allowed to dry in a vacuum desiccator for 30 min. Matrix (alpha-cyano-4-hydroxycinnamic acid, CHCA) was prepared in 50:50 HPLC-grade acetonitrile (ACN) -water with 0.1% trifluoroacetic acid (TFA) (EMD, Billerica, MA) to yield a final concentration of 10 mg/mL, and was applied using an airbrush onto the sample; or, 5 mg/mL CHCA matrix was applied using a TM-Sprayer from HTX Technologies (Carrboro, NC) with a constant flow of sheath gas (10 psi) delivered conjointly with the matrix solution spray. The system was operated at a flow rate of 0.12 mL/min and the temperature was kept at 75 °C. The TM-Sprayer software was used for operation. For IMS data acquisition, 800 laser shots were accumulated per array position with a lateral resolution of 75 μm diameter using the “large” focus setting, or 35 μm diameter using the “small” focus setting, in the mass range of m/z 200–1000 Da. Mass spectra were acquired using an UltrafleXtreme TOF/TOF mass spectrometer (Bruker Daltonik, Bremen, Germany), positive mode at 1000 Hz. External calibration was performed using a custom peptide mixture by spotting the standards on a region near the MCTS section. The ion images were visualized using FlexImaging (ver. 4.0; Bruker Daltonics) or analyzed with SCiLS Lab (ver. 2015b; Bremen, Germany).
Results and Discussion
The distributions of histone PTMs were examined by high-resolution MS in monolayer cell culture, whole MCTS, and in MCTS layers. A comparison between whole untreated MCTS and monolayer cell culture was performed first, to determine if there were any differences between monolayer and MCTS histone PTMs. The histone PTMs in the untreated MCTS showed several differentially modified histone variants when compared to the monolayer cell culture (Figure 2A; Supplementary Table S1). Large swaths of histone PTMs were differentially modified with a variety of modifying groups, including H3K9ac, H4K12ac, H3K9me3, and H3K4me1, among others. In particular, H3K27me3 was increased in the MCTS compared to monolayer cell culture. Monolayer cell culture is currently a standard cancer model system, and has previously been used in numerous drug studies. This result was somewhat expected, as 3D cell culture better recapitulates the tumor microenvironment15 and epigenetic changes have been found in 3D culture in the past.26,29 H3K27me3 has been previously implicated in cancer,5 and loss of H3K27me3 has been previously shown to decrease proliferation of colon cancer cells.46 An increase in H3K27me3 indicates an increase in general repression for genes within the MCTS as compared to monolayer cell culture. Significant differences in H3K27me3 abundance were seen when comparing the middle layer to the core layer, as well as significant differences in total H3K27 methylation when the outer and core layers were compared (Figure 2B).
Figure 2. Expression heatmaps of histone PTMs for monolayer culture and MCTS layers.

(A) HCT116 monolayer cell cultures and MCTS show specific profiles of histone PTMs. Under treatment with UNC1999, the histone profiles are altered compared to the empty vehicle. Several clusters of histones are modified between the MCTS layers and the monolayer cell culture, which correlates with altered phenotypes between MCTS and monolayer cell culture. The histone modifications shown here are histone H3 and H4 modifications that are not specifically altered due to UNC1999 treatment, but illustrate the perturbations resulting from MCTS formation and treatment in terms of histone modifications. Each sample type was analyzed in biological triplicate. (B) The layers of MCTS have differing abundances of shared histone PTMs. Of note in this study is H3K27 methylation variants (highlighted), which are differentially distributed among the layers of untreated MCTS. H3K27me3 is found in greater abundance in the core, while H3K27me1/2 are more abundant in the outer and middle layers. For the y axes comparison to p-values, -log(0.05)=4.32
We then examined epigenetic drug treatment of MCTS to determine whether the MCTS histone PTM variants could be altered, and whether the alterations could be detected and quantified accurately. We first verified the penetration of UNC1999 in the MCTS using MALDI imaging mass spectrometry (Figure 1B). MALDI imaging MS showed that UNC1999 penetrates the MCTS completely within 3 days of treatment (Figure 3; Supplementary Figures S1 and S2). Next, we examined whether changes in the histone modifications were detectable with UNC1999 treatment, with a focus on H3K27 modifications. By using EpiProfile we quantified hundreds of histone peptides in different modified forms. Combining the results of all experiments (treated and untreated layers), we quantified the relative abundance of 258 differently modified peptides (Supplementary Table S1). Comparisons between the layers were performed using all histone modifications detected within and among each sample type (Supplementary Table S1). Multiple significant changes in histone peptide abundance were observed between the control layers, between the treated and control layers, and between the monolayer cells and MCTS. Among these peptides were H3K27 peptides, with and without modifications. A decrease in the abundance of the H3K27me3 modification was seen in the outer and middle layers of the treated MCTS compared to the control, corresponding with the penetration of UNC1999 into the MCTS. However, the core of the MCTS does not show a dramatic decrease in the abundance of H3K27me3 in the treated condition. This constancy could be due to the time frame of the penetration of UNC1999 versus the timeframe of histone turnover. From previous quantitative mass spectrometry data, histone turnover takes about four days, but can vary with modification status.47 While the drug completely penetrated the MCTS within 72 hours of treatment, it may not have had time to alter the epigenetic modifications. Further, most of the cells in the core of the MCTS are dead or dying. Enzymatic activity of DNA modifications may be decreased or non-existent in these compromised cells.
Figure 3. MALDI imaging mass spectrometry of UNC1999 distribution across the MCTS.

MCTS treated with 5 μM UNC1999 for 24, 48, and 72 hours, and empty vehicle MCTS, were imaged on a Bruker UltrafleXtreme MALDI-TOF mass spectrometer, and an ion map was created for the UNC1999 [M+H]+ (m/z 570.295) and UNC1999 [M+Na]+ (m/z 592.384). The drug is distributed throughout the MCTS, and no corresponding ion occurs in the control (empty vehicle) spectrum. This data indicates that UNC1999 completely penetrates the MCTS within 72 hours. Laser spot size = 35 μm.
Along with the evaluation of the histone PTMs by MS, we sought to evaluate phenotypic effects of UNC1999 treatment on MCTS. Because the core of the MCTS did not show the expected decrease in H3K27me3, and to determine whether the MCTS would recover the H3K27me3 modification after removal of treatment, we evaluated four conditions of drug treatment in the phenotypic growth assay (4T-9EV, 4EV-9T, control, and full time treatment) via microscopy images (Figure 1, A and B), and examined three conditions with mass spectrometry (4T-9EV, control, and late treatment on day 13). Of the four conditions, we chose the three conditions for MS analysis that generally resulted in structurally stable MCTS. One of the conditions (full-time treatment) resulted in complete dissociation of the MCTS within two rounds of serial trypsinization, thus making it challenging to analyze by MS. The structural weakness of the MCTS after full-time treatment appears to be due to a lack of structure surrounding the necrotic core, consistent with previous reports of lowered proliferation after EZH2 inhibition.11,46 Late treatment (on day 13) was chosen for analysis as opposed to an earlier treatment because the MCTS from earlier treatments do not reach similar sizes to control (Supplementary Figure S3). Treatment on or around day 13 does not affect the diameter of the MCTS, which allows for similar cell collection between the control and late treatment conditions. MCTS with late treatment on day 13 still show epigenetic changes from treatment. The cell collection is reproducible with serial trypsinization, allowing us to adjust for cell numbers for 4T-9EV.
MCTS grown in the presence of UNC1999 showed arrested growth compared to the empty vehicle. The growth assay in the ultra low-binding round bottom plate tested four conditions and all treatment conditions showed inhibited growth when UNC1999 was present as compared to the empty vehicle (Figure 4; Supplementary Figure S3). MCTS treated with UNC1999 during initial growth were ~ 30% smaller than their negative control counterparts on day 10 (0.69 ± 0.01 mm treated compared to 0.97 ± 0.01 mm empty vehicle, Figure 4B; Supplementary Table S2; Supplementary Figure S3). The full-time treatment MCTS showed slower growth compared to the control MCTS over the entire growth period up to day ten, after which ~50% of the population rapidly deteriorated, shedding cell debris (Supplementary Figure S3) and resulting in several MCTS that were outside the focal range of the microscope. MCTS plated under drug treatment also showed smaller diameters from the start of measurements, despite holding other growth variables constant. The empty vehicle MCTS that were treated with UNC1999 after day four showed arrested growth, starting roughly three days post treatment. A three-day delay is notable because it is consistent with turnover of an epigenetic modification through histone turnover. The initial treated MCTS that were switched to empty vehicle media show little to no acceleration in growth rate up to day ten, when ~33% of this population began to deteriorate and collapse. Observation of the deteriorating MCTS was an unexpected result, as the inhibition of EZH2 appears to result in lowered proliferation rates of non-mutant cancer cells.11,46 The loss of the cultures may be explained by lack of MCTS superstructure resulting from lowered proliferation rates. Future studies will include viability assays based on cell number.
Figure 4. Arrangement of UNC1999 drug treatment conditions.

(A) Four sections of 15 MCTS each were used for the growth assay in the shown arrangement. (B) Growth curves are shown for MCTS under four UNC1999 treatment conditions in ultra-low-binding round-bottom plates. Full time control MCTS (empty vehicle) grew to a diameter of about 1 mm. Treatment with UNC1999 resulted in smaller diameter MCTS. Full time drug treatment and early treatment (4T-9EV) resulted in a significantly lower diameter (p ≤ 0.01) compared to both the full-time control and the late treatment (4EV-9T), as well as some population collapse (5 lost in 4T-9EV, 8 lost in full-time treatment). No significant difference in diameter was observed in full time treatment compared to 4T-9EV.
Changes to the histone modifications of the MCTS under growth assay conditions that were able to be harvested by serial trypsinization and late-stage treatment were analyzed with high-resolution MS (Figure 1D). This analysis was performed to provide a direct look at the changes that occur under UNC1999 treatment across the layers of the MCTS. Under treatment, the distribution of H3K27 methylation is altered across the MCTS (Figure 5). The drug penetrated the MCTS to the core and decreased the incidence of the H3K27me3 modification throughout the MCTS where the drug was present. The decrease in H3K27me3 corresponds with the increase in H3K27me1 and H3K27me2 in varying degrees (highlighted in Figure 5). These distributions can be correlated with the results observed in the respective cell culture treatment conditions (Figure 4B), where we observe growth inhibition in the same samples as we see a decrease in H3K27me3 abundance. Interestingly, the percent abundance of the unmodified peptides remained constant across treatment conditions, suggesting that H3K27me3 is demethylated into H3K27me1/2.
Figure 5. Spatial distribution of histone PTMs in layers and treatment conditions.

Each layer of the MCTS has a distinct profile of histone modifications under different treatment conditions. (A) depicts the z-score heatmap of the core, (B) depicts the middle, and (C) depicts the outer layer. Each column is a combination of three biological replicate analyses.
This combination approach provides sub-millimetric spatial resolution of histone peptides in conjunction with high-resolution imaging of drug distribution, which allows for direct examination of drug effects on histone PTMs. Phenotypic changes can be correlated to altered PTM states in the same workflow. Previous epigenetic drug evaluations focused on phenotypic changes without delving into drug distribution and without identifying multiple epigenetic alterations, while this method approaches all three of these fields with one sample pool. The combination of the growth assay and mass spectrometry provides a powerful tool for the understanding of epigenetic drug effects by coupling quantitative data with physical attributes. Several reports have shown that a decrease in H3K27me3 is associated with decreased proliferation rates in monolayer cancer cells.11,46 The growth assay in this study shows that the diameter of the MCTS decreases when H3K27me3 levels are down, possibly due to a decrease in proliferation of cells. H3K27me3 is a repressive histone modification that leads to gene silencing. This modification is primarily regulated by the PRC2 complex in adults, but several demethylases have been identified that can act to remove at least one methyl group from H3K27.48–51 Our results show that H3K27me3 is downregulated when UNC1999 is present, as compared to the control. As UNC1999 inhibits the activity of EZH2, and the total abundance of the modified peptides remains static from control to treated samples, we infer that other enzymes are affecting the H3K27 methylation status and altering the distribution of the modification across the MCTS. The growth assay can be replicated with numerous epigenetic drugs and, in conjunction with MS/MS, give a clearer picture of the epigenetic phenomena occurring.
The MCTS model allows for adjustments in the experimental parameters, while still providing a more accurate environment for drug evaluation. The MCTS in this study matured in about thirteen days, but effects of the drug on MCTS growth were seen in as little as three days. Because the spatial distribution of the drug and histone PTMs was under investigation, we allowed the MCTS to continue to grow, but the MCTS could have been harvested at any point during the experiment for MS analysis. The process of serial trypsinization was scaled up to decrease sample collection time without compromising spatial selectivity of the cells. Previously only about 30 MCTS were used for cell collection.17 In this study, four plates of MCTS (240 MCTS) were trypsinized at one time. By decreasing the time taken for cell collection, all plates could be trypsinized on the same day, rather than trypsinizing MCTS over multiple days. Using larger or smaller batches of MCTS can decrease total time investment for cell collection and minimize experimental variability, allowing time course studies or endpoint spatial analysis of drug effects. Together, the factors of growth, scalability, and accuracy of biological responses provide a robust and useful screening tool.
Conclusions
Epigenetic drugs are an emerging field of chemotherapeutics due to their promising results in anti-cancer applications. However, complementary tools for characterizing their mechanism and penetration are needed to fully evaluate their efficacy and side effects. By using our combinatorial approach of microscopy, phenotypic assay and high-resolution MS we obtained both phenotypic data and direct scrutiny of the histone code. Specifically, we treated HCT116 MCTS with UNC1999 and observed both phenotypic effects and an overall decrease in the spatial distribution of the EZH2 target, H3K27me3. This platform is a novel combination of multiple reliable methods that could be used to examine a wide range of epigenetic drugs. Both the direct effects of the drugs on histones and side effects of the drugs were interrogated; we observed decreased diameter of the MCTS culture under treatment, corresponding with H3K27me3 decrease, as well as unexpected loss of culture structure under continuous treatment. We believe that this method will be useful in a high-throughput fashion, where multiple drugs ‘in the pipeline’ can be screened in a high-accuracy, comprehensive fashion.
Supplementary Material
Table S1: Peptides identified and quantified with high-resolution mass spectrometry analysis
Table S2: MCTS diameter measurements from growth assay
Figure S1: MALDI IMS ion maps of UNC1999 fragment treated for 24, 48, and 72 hours, and empty vehicle MCTS
Figure S2: Species of UNC1999 detected in MALDI IMS of treated MCTS
Figure S3: Representative MCTS images from day 3, day 7, and day 13 of the MCTS growth assay This material is available free of charge via the Internet at http://pubs.acs.org.
Acknowledgments
A. Hummon was supported by the National Institutes of Health (R01GM110406-ABH), and the National Science Foundation (CAREER Award, CHE-1351595). Acquisition of the MALDI TOF-TOF instrument was supported by the National Science Foundation under award 1625944. B. Garcia was supported by NIH grants GM110174 and P01CA196539, and a Leukemia and Lymphoma Society Robert Arceci Scholar Award. P. Feist was supported by an Arthur J. Schmitt Presidential Fellowship. We gratefully acknowledge the generosity of the Sweedler lab for use of their UltrafleXtreme instrument and Dr. Susan Skube for editing assistance.
References
- 1.Mariño-Ramírez L, Kann MG, Shoemaker BA, Landsman D. Expert Rev Proteomics. 2005;2:719–729. doi: 10.1586/14789450.2.5.719. [DOI] [PMC free article] [PubMed] [Google Scholar]
- 2.Li E. Nat Rev Genet. 2002;3:662–673. doi: 10.1038/nrg887. [DOI] [PubMed] [Google Scholar]
- 3.Holliday R. Philos Trans R Soc Lond B Biol Sci. 1990;326:329–338. doi: 10.1098/rstb.1990.0015. [DOI] [PubMed] [Google Scholar]
- 4.Weinhold B. Environ Health Perspect. 2006;114:A160–A167. doi: 10.1289/ehp.114-a160. [DOI] [PMC free article] [PubMed] [Google Scholar]
- 5.Yoo KH, Hennighausen L. Int J Biol Sci. 2012;8:59–65. doi: 10.7150/ijbs.8.59. [DOI] [PMC free article] [PubMed] [Google Scholar]
- 6.Rougeulle C, Chaumeil J, Sarma K, Allis CD, Reinberg D, Avner P, Heard E. Mol Cell Biol. 2004;24:5475–5484. doi: 10.1128/MCB.24.12.5475-5484.2004. [DOI] [PMC free article] [PubMed] [Google Scholar]
- 7.Barski A, Cuddapah S, Cui K, Roh TY, Schones DE, Wang Z, Wei G, Chepelev I, Zhao K. Cell. 2007;129:823–837. doi: 10.1016/j.cell.2007.05.009. [DOI] [PubMed] [Google Scholar]
- 8.Ferrari KJ, Scelfo A, Jammula S, Cuomo A, Barozzi I, Stützer A, Fischle W, Bonaldi T, Pasini D. Mol Cell. 2014;53:49–62. doi: 10.1016/j.molcel.2013.10.030. [DOI] [PubMed] [Google Scholar]
- 9.Shen X, Liu Y, Hsu YJ, Fujiwara Y, Kim J, Mao X, Yuan GC, Orkin SH. Mol Cell. 2008;32:491–502. doi: 10.1016/j.molcel.2008.10.016. [DOI] [PMC free article] [PubMed] [Google Scholar]
- 10.Margueron R, Li G, Sarma K, Blais A, Zavadil J, Woodcock CL, Dynlacht BD, Reinberg D. Mol Cell. 2008;32:503–518. doi: 10.1016/j.molcel.2008.11.004. [DOI] [PMC free article] [PubMed] [Google Scholar]
- 11.Qi W, Chan H, Teng L, Li L, Chuai S, Zhang R, Zeng J, Li M, Fan H, Lin Y, Gu J, Ardayfio O, Zhang JH, Yan X, Fang J, Mi Y, Zhang M, Zhou T, Feng G, Chen Z, Li G, Yang T, Zhao K, Liu X, Yu Z, Lu CX, Atadja P, Li E. Proc Natl Acad Sci. 2012;109:21360–21365. doi: 10.1073/pnas.1210371110. [DOI] [PMC free article] [PubMed] [Google Scholar]
- 12.McCabe MT, Ott HM, Ganji G, Korenchuk S, Thompson C, Van Aller GS, Liu Y, Graves AP, Iii ADP, Diaz E, LaFrance LV, Mellinger M, Duquenne C, Tian X, Kruger RG, McHugh CF, Brandt M, Miller WH, Dhanak D, Verma SK, Tummino PJ, Creasy CL. Nature. 2012;492:108–112. doi: 10.1038/nature11606. [DOI] [PubMed] [Google Scholar]
- 13.Sutherland RM, McCredie JA, Inch WR. J Natl Cancer Inst. 1971;46:113–120. [PubMed] [Google Scholar]
- 14.Feist PE, Sun L, Liu X, Dovichi NJ, Hummon AB. Rapid Commun Mass Spectrom. 2015;29:654–658. doi: 10.1002/rcm.7150. [DOI] [PMC free article] [PubMed] [Google Scholar]
- 15.Freyer JP, Sutherland RM. Cancer Res. 1980;40:3956–3965. [PubMed] [Google Scholar]
- 16.Li H, Hummon AB. Anal Chem. 2011;83:8794–8801. doi: 10.1021/ac202356g. [DOI] [PubMed] [Google Scholar]
- 17.McMahon KM, Volpato M, Chi HY, Musiwaro P, Poterlowicz K, Peng Y, Scally AJ, Patterson LH, Phillips RM, Sutton CW. J Proteome Res. 2012;11:2863–2875. doi: 10.1021/pr2012472. [DOI] [PubMed] [Google Scholar]
- 18.Keithley RB, Weaver EM, Rosado AM, Metzinger MP, Hummon AB, Dovichi NJ. Anal Chem. 2013;85:8910–8918. doi: 10.1021/ac402262e. [DOI] [PMC free article] [PubMed] [Google Scholar]
- 19.Liu X, Hummon AB. J Am Soc Mass Spectrom. 2015;26:577–586. doi: 10.1007/s13361-014-1071-0. [DOI] [PMC free article] [PubMed] [Google Scholar]
- 20.Theodoraki MA, Rezende CO, Chantarasriwong O, Corben AD, Theodorakis EA, Alpaugh ML. Oncotarget. 2015;6:21255–21267. doi: 10.18632/oncotarget.4013. [DOI] [PMC free article] [PubMed] [Google Scholar]
- 21.Liu X, Weaver EM, Hummon AB. Anal Chem. 2013;85:6295–6302. doi: 10.1021/ac400519c. [DOI] [PMC free article] [PubMed] [Google Scholar]
- 22.Dufau I, Frongia C, Sicard F, Dedieu L, Cordelier P, Ausseil F, Ducommun B, Valette A. BMC Cancer. 2012;12:1–11. doi: 10.1186/1471-2407-12-15. [DOI] [PMC free article] [PubMed] [Google Scholar]
- 23.Monazzam A, Razifar P, Simonsson M, Qvarnström F, Josephsson R, Blomqvist C, Långström B, Bergström M. Cancer Cell Int. 2006;6:6. doi: 10.1186/1475-2867-6-6. [DOI] [PMC free article] [PubMed] [Google Scholar]
- 24.Perche F, Torchilin VP. Cancer Biol Ther. 2012;13:1205–1213. doi: 10.4161/cbt.21353. [DOI] [PMC free article] [PubMed] [Google Scholar]
- 25.Mueller-Klieser W. Am J Physiol. 1997;273:C1109–1123. doi: 10.1152/ajpcell.1997.273.4.C1109. [DOI] [PubMed] [Google Scholar]
- 26.Cesarz Z, Tamama K. Stem Cells Int. 2016;2016:9176357. doi: 10.1155/2016/9176357. [DOI] [PMC free article] [PubMed] [Google Scholar]
- 27.Postovit LM, Seftor EA, Seftor REB, Hendrix MJC. Stem Cells. 2006;24:501–505. doi: 10.1634/stemcells.2005-0459. [DOI] [PubMed] [Google Scholar]
- 28.Benton G, Crooke E, George J. FASEB J. 2009;23:3884–3895. doi: 10.1096/fj.08-128702. [DOI] [PubMed] [Google Scholar]
- 29.Bapat SA, Jin V, Berry N, Balch C, Sharma N, Kurrey N, Zhang S, Fang F, Lan X, Li M, Kennedy B, Bigsby RM, Huang THM, Nephew KP. Epigenetics. 2010;5:716–729. doi: 10.4161/epi.5.8.13014. [DOI] [PMC free article] [PubMed] [Google Scholar]
- 30.Amatangelo M, Garipov A, Li H, Conejo-Garcia JR, Speicher D, Zhang R. Cell Cycle. 2013;12:2113–2119. doi: 10.4161/cc.25163. [DOI] [PMC free article] [PubMed] [Google Scholar]
- 31.Bitler BG, Aird KM, Garipov A, Li H, Amatangelo M, Kossenkov AV, Schultz DC, Liu Q, Shih IM, Conejo-Garcia JR, Speicher DW, Zhang R. Nat Med. 2015;21:231–238. doi: 10.1038/nm.3799. [DOI] [PMC free article] [PubMed] [Google Scholar]
- 32.Siuti N, Kelleher NL. Nat Methods. 2007;4:817–821. doi: 10.1038/nmeth1097. [DOI] [PMC free article] [PubMed] [Google Scholar]
- 33.Britton LMP, Gonzales-Cope M, Zee BM, Garcia BA. Expert Rev Proteomics. 2011;8:631–643. doi: 10.1586/epr.11.47. [DOI] [PMC free article] [PubMed] [Google Scholar]
- 34.Huang H, Lin S, Garcia BA, Zhao Y. Chem Rev. 2015;115:2376–2418. doi: 10.1021/cr500491u. [DOI] [PMC free article] [PubMed] [Google Scholar]
- 35.Sidoli S, Simithy J, Karch KR, Kulej K, Garcia BA. Anal Chem. 2015;87:11448–11454. doi: 10.1021/acs.analchem.5b03009. [DOI] [PMC free article] [PubMed] [Google Scholar]
- 36.Sidoli S, Fujiwara R, Garcia BA. Proteomics. 2016;16:2095–2105. doi: 10.1002/pmic.201500527. [DOI] [PMC free article] [PubMed] [Google Scholar]
- 37.Sidoli S, Lin S, Xiong L, Bhanu NV, Karch KR, Johansen E, Hunter C, Mollah S, Garcia BA. Mol Cell Proteomics. 2015;14:2420–2428. doi: 10.1074/mcp.O114.046102. [DOI] [PMC free article] [PubMed] [Google Scholar]
- 38.Sidoli S, Bhanu NV, Karch KR, Wang X, Garcia BA. J Vis Exp. 2016;111:e54112. doi: 10.3791/54112.. [DOI] [PMC free article] [PubMed] [Google Scholar]
- 39.Konze KD, Ma A, Li F, Barsyte-Lovejoy D, Parton T, MacNevin CJ, Liu F, Gao C, Huang XP, Kuznetsova E, Rougie M, Jiang A, Pattenden SG, Norris JL, James LI, Roth BL, Brown PJ, Frye SV, Arrowsmith CH, Hahn KM, Wang GG, Vedadi M, Jin J. ACS Chem Biol. 2013;8:1324–1334. doi: 10.1021/cb400133j. [DOI] [PMC free article] [PubMed] [Google Scholar]
- 40.Xu B, On DM, Ma A, Parton T, Konze KD, Pattenden SG, Allison DF, Cai L, Rockowitz S, Liu S, Liu Y, Li F, Vedadi M, Frye SV, Garcia BA, Zheng D, Jin J, Wang GG. Blood. 2014;125:346–357. doi: 10.1182/blood-2014-06-581082. [DOI] [PMC free article] [PubMed] [Google Scholar]
- 41.Rizq O, Mimura N, Koide S, Ma A, Jin J, Iseki T, Nakaseko C, Iwama A. Blood. 2014;124:2094–2094. [Google Scholar]
- 42.Katona B, Liu Y, Ma A, Jin J, Hua X. Gastroenterology. 2014;146:S-626. [Google Scholar]
- 43.Flynn RP, Goodman K, Qi J, Jing D, Panoskaltsis-Mortari A, Yi Z, Dong C, Liu X, MacDonald KPA, Hill GR, Serody JS, Murphy WJ, Luznik L, Maillard I, Koreth J, Cutler CS, Soiffer RJ, Antin JH, Ritz J, Melnick AM, Bradner JE, Blazar BR. Blood. 2014;124:535–535. [Google Scholar]
- 44.Friedrich J, Seidel C, Ebner R, Kunz-Schughart LA. Nat Protoc. 2009;4:309–324. doi: 10.1038/nprot.2008.226. [DOI] [PubMed] [Google Scholar]
- 45.Yuan ZF, Lin S, Molden RC, Cao XJ, Bhanu NV, Wang X, Sidoli S, Liu S, Garcia BA. Mol Cell Proteomics. 2015;14:1696–1707. doi: 10.1074/mcp.M114.046011. [DOI] [PMC free article] [PubMed] [Google Scholar]
- 46.Fussbroich B, Wagener N, Macher-Goeppinger S, Benner A, Fälth M, Sültmann H, Holzer A, Hoppe-Seyler K, Hoppe-Seyler F. PLoS ONE. 2011;6:e21651. doi: 10.1371/journal.pone.0021651. [DOI] [PMC free article] [PubMed] [Google Scholar]
- 47.Zee BM, Levin RS, DiMaggio PA, Garcia BA. Epigenetics Chromatin. 2010;3:22. doi: 10.1186/1756-8935-3-22. [DOI] [PMC free article] [PubMed] [Google Scholar]
- 48.Agger K, Cloos PAC, Christensen J, Pasini D, Rose S, Rappsilber J, Issaeva I, Canaani E, Salcini AE, Helin K. Nature. 2007;449:731–734. doi: 10.1038/nature06145. [DOI] [PubMed] [Google Scholar]
- 49.De Santa F, Totaro MG, Prosperini E, Notarbartolo S, Testa G, Natoli G. Cell. 2007;130:1083–1094. doi: 10.1016/j.cell.2007.08.019. [DOI] [PubMed] [Google Scholar]
- 50.Kruidenier L, Chung C, Cheng Z, Liddle J, Che K, Joberty G, Bantscheff M, Bountra C, Bridges A, Diallo H, Eberhard D, Hutchinson S, Jones E, Katso R, Leveridge M, Mander PK, Mosley J, Ramirez-Molina C, Rowland P, Schofield CJ, Sheppard RJ, Smith JE, Swales C, Tanner R, Thomas P, Tumber A, Drewes G, Oppermann U, Patel DJ, Lee K, Wilson DM. Nature. 2012;488:404–408. doi: 10.1038/nature11262. [DOI] [PMC free article] [PubMed] [Google Scholar]
- 51.Lan F, Bayliss PE, Rinn JL, Whetstine JR, Wang JK, Chen S, Iwase S, Alpatov R, Issaeva I, Canaani E, Roberts TM, Chang HY, Shi Y. Nature. 2007;449:689–694. doi: 10.1038/nature06192. [DOI] [PubMed] [Google Scholar]
Associated Data
This section collects any data citations, data availability statements, or supplementary materials included in this article.
Supplementary Materials
Table S1: Peptides identified and quantified with high-resolution mass spectrometry analysis
Table S2: MCTS diameter measurements from growth assay
Figure S1: MALDI IMS ion maps of UNC1999 fragment treated for 24, 48, and 72 hours, and empty vehicle MCTS
Figure S2: Species of UNC1999 detected in MALDI IMS of treated MCTS
Figure S3: Representative MCTS images from day 3, day 7, and day 13 of the MCTS growth assay This material is available free of charge via the Internet at http://pubs.acs.org.