

Abstract
Enterochromaffin (EC) cells located in the gastrointestinal (GI) tract provide the vast majority of serotonin (5‐HT) in the body and constitute half of all enteroendocrine cells. EC cells respond to an array of stimuli, including various ingested nutrients. Ensuing 5‐HT release from these cells plays a diverse role in regulating gut motility as well as other important responses to nutrient ingestion such as glucose absorption and fluid balance. Recent data also highlight the role of peripheral 5‐HT in various pathways related to metabolic control. Details related to the manner by which EC cells respond to ingested nutrients are scarce and as that the nutrient environment changes along the length of the gut, it is unknown whether the response of EC cells to nutrients is dependent on their GI location. The aim of the present study was to identify whether regional differences in nutrient sensing capability exist in mouse EC cells. We isolated mouse EC cells from duodenum and colon to demonstrate differential responses to sugars depending on location. Measurements of intracellular calcium concentration and 5‐HT secretion demonstrated that colonic EC cells are more sensitive to glucose, while duodenal EC cells are more sensitive to fructose and sucrose. Short‐chain fatty acids (SCFAs), which are predominantly synthesized by intestinal bacteria, have been previously associated with an increase in circulating 5‐HT; however, we find that SCFAs do not acutely stimulate EC cell 5‐HT release. Thus, we highlight that EC cell physiology is dictated by regional location within the GI tract, and identify differences in the regional responsiveness of EC cells to dietary sugars.
Keywords: Enterochromaffin, nutrients, serotonin
Introduction
Enteroendocrine (EE) cells are specialized epithelial cells within the gastrointestinal (GI) tract equipped to release an array of hormones and peptides in response to environmental cues. Collectively they constitute the largest endocrine tissue in our body. Enterochromaffin (EC) cells represent around half of all EE cells, and produce ~95% of total body serotonin (5‐hydroxytryptophan, 5‐HT), including all plasma 5‐HT (Gershon and Tack 2007). These are endoderm‐derived cells that express the non‐neuronal isoform of tryptophan hydroxylase, TPH1 (Walther et al. 2003), which synthesizes 5‐HT for subsequent packaging into vesicles. 5‐HT secretion from primary EC cells results from membrane depolarization triggering the entry of extracellular Ca2+ through L‐type voltage‐gated Ca2+ channels (Raghupathi et al. 2013; Zelkas et al. 2015). Much research has focused on roles of gut‐derived 5‐HT within the GI tract, including our own work proving that GI motility is regulated by gut‐derived 5‐HT but can be maintained without it (Keating and Spencer 2010; Spencer et al. 2011).
Studies in mucosal tissue from the human colon, immortalized cell line models of EC cells (BON cells), and human primary colonic EC cell cultures demonstrate that 5‐HT is released in response to a variety of stimuli (Modlin et al. 2006; Kidd et al. 2008; Symonds et al. 2015), including nutrients. EC cells are exposed to ingested nutrients, bile acids, and signals produced by gut microflora, as well as to circulating nutrients. Each nutrient source may have distinct effects on EC cell signaling outputs. For example, luminal glucose triggers 5‐HT release from guinea pig primary colonic EC cells and intact mouse tissue preparations (Zelkas et al. 2015). The sodium‐dependent glucose transporters SGLT1 and SGLT3 have each been implicated in driving membrane depolarization in response to increased glucose in BON cells and rodent intestine, respectively (Kim et al. 2001; Freeman et al. 2006).
Dietary nutrients present in the GI tract also change throughout its length. For example, hexoses such as glucose and fructose are preferentially detected and absorbed in the proximal intestine for use in energy metabolism. Luminal glucosidase enzymes hydrolyze more complex sugars, a process which has been associated with reduced feeding behavior via the 5‐HT3 receptor (Savastano et al. 2005b). Under healthy conditions, absorption of luminal sugars is largely complete by the time ingested contents have reached the colon. Additionally, GI microbiota, found primarily in the colon, are capable of producing their own nutrient sources including short‐chain fatty acids (SCFAs). SCFAs have recently been shown to enhance 5‐HT synthesis in EC cells (Fukumoto et al. 2003; Alemi et al. 2013; Nzakizwanayo et al. 2015; Yano et al. 2015), possibly through activation of the free fatty acid receptor 2 (FFAR2) (Akiba et al. 2015). Given that the types of nutrients and their respective concentrations differ along the GI tract, the mechanisms involved in sensing these nutrients may also be dependent on location within the GI tract. To understand this further, we have isolated primary EC cells from the duodenum and colon of mice to undertake comparative studies of responses to specific nutrient types.
Methods
Primary mouse EC cell isolation
Animal studies were performed in accordance with the guidelines of the Animal Ethics Committee of Flinders University. Male, 8‐ to 16‐week‐old C57BL/6 mice fed a standard chow diet were humanely killed by isoflurane overdose and cervical dislocation. Duodenum and colon were immediately removed and EC cells isolated and purified according to our previously published methods (Raghupathi et al. 2013; Martin et al. 2017). In brief, the mucosal layer was removed in 4°C Krebs buffer (in mmol/L; NaCl 140, KCl 5, CaCl2 2, MgCl2 1, HEPES 10, d‐glucose 5, pH 7.4), minced, and digested in a combination of 1 part collagenase A (3 mg mL−1, Roche Diagnostics GmbH, Mannheim, Germany) and 2 parts 0.05% trypsin‐EDTA (Sigma‐Aldrich, St. Louis, MO, USA) at 37°C for 30–40 min with constant agitation. Tissue digestion was inactivated by addition of equal volumes of DMEM culture media (Gibco, Grand Island, NY, USA) containing 10% FBS, 1% l‐glutamine, and 1% penicillin–streptomycin, and the digestion mixture was filtered through a 40‐μm cell strainer (Grainer Bio‐One, Monroe, NC, USA) and centrifuged at 600g. The supernatant was removed and the resulting pellet resuspended in 1 mL of culture media, which was then layered on top of a Percoll (Sigma‐Aldrich) density gradient formed according to the manufacturer's instructions. Following centrifugation at 1100g for 8 min and slow braking, EC cells were harvested at a Percoll density of 1.059–1.07 g L−1. Harvested cells were washed once, then resuspended in culture media. EC cell viability was measured by Trypan blue staining (0.2% final concentration) followed by cell counting using a hemocytometer. Cells were considered viable if they completely excluded the dye. The purity of EC cell‐isolated cultures was determined by immunofluorescence staining for 5‐HT and TPH1, as per our previously described methods (Raghupathi et al. 2013, 2016; Nzakizwanayo et al. 2015; Martin et al. 2017).
Ca2+ flux by flow cytometry
Isolated EC cells were centrifuged at 500g for 4 min, then resuspended in 1 mL of Hank's balanced salt solution (HBSS, Sigma‐Aldrich) supplemented with 1 mmol/L Ca2+ and 20 mmol/L HEPES. EC cells were incubated at 37°C for 35 min in the presence of the Ca2+ indicators, Fluo‐3 and Fura Red, washed once with HBSS, centrifuged at 450g for 4 min, then resuspended in HBSS at a final volume of 150 μL per FACS tube, with 1.0–3.0 × 10⁵ cells per tube. Intracellular Ca2+ (Ca2+ (i)) flux was determined using a BD FACSCanto II (BD Biosciences) flow cytometer. Following a 10‐sec baseline recording, a stimulation solution containing 100–500 mmol/L of one of the hexoses: glucose, fructose, sucrose, α‐MG, or 1–100 mmol/L of the SCFAs: acetate, butyrate, or propionate, was added and recording continued for a further 150 sec. The concentrations of hexoses were chosen based on luminal glucose concentrations within the GI tract having been proposed to reach 300 mmol/L at the brush‐border membrane (BBM) following a meal (Pappenheimer 1993), while the sucrose concentration of a standard sugar‐sweetened beverage can exceed 600 mmol/L. In colon preparations, however, the concentration of the different sugar stimulants did not exceed 300 mmol/L, as concentrations higher than this significantly decreased cell viability. SCFA concentrations were based on the concentrations reported in the lumen of the colon under healthy conditions (Cummings et al. 1987; Yajima and Sakata 1992; Topping and Clifton 2001; Alex et al. 2013). The Ca2+‐ATPase blocker, thapsigargin (TG), was used as a positive control to test the ability of cells to respond and for proper Ca2+ indicator loading. Data were expressed as the relative change in the ratio of Fluo‐3/Fura Red over time using FlowJo V10 (LLC, USA) for analyses. Changes in Fluo‐3/Fura Red were compared to the baseline time period for each recording, and compared to responses in unstimulated conditions (control). Baseline subtracted net area under the curve (AUC) was quantified using GraphPad PRISM 5.04 software.
5‐HT secretion by ELISA
Isolated EC cells were suspended in prewarmed Krebs solution containing 5‐HT stabilizer buffer (Labor Diagnosticka Nord) and 1 μmol/L fluoxetine, to block potential 5‐HT reuptake via SERT and reduce potential metabolism of 5‐HT, and added to a 96‐well plate at a density of 1.5–2 × 10⁴ cells in 120 μL per well. Cells were incubated to adhere and equilibrate for 30 min at 37°C, 5% CO2. From each well, half the volume was collected (representing 0 min) and replaced with an equal volume of stimulation solution at two times concentration to achieve the desired assay concentration. To determine the minimum incubation time for detectable changes in 5‐HT concentration using 5‐HT ELISA, a time course was determined with exposure to glucose, sampling at 2, 5, 10, 20, and 120 min intervals. Since 20 min was the minimum incubation time for detectable changes in 5‐HT secretion by ELISA, we used this time frame as the bases for all hexose stimulation experiments. Forty μL of solution was collected from each well after 20 min exposure to hexose stimulants, and 2 h exposure to SCFAs, placed on ice, and immediately stored at −20°C until further use. 5‐HT content of each sample was measured using a 5‐HT ELISA kit (BA E‐5900, BioStrategy) according to the manufacturer's instructions. Preliminary experiments were performed to confirm that addition of stimuli to supernatant in the absence of any cells does not influence the results of this ELISA (data not shown). Data are expressed as net 5‐HT secretion since 0 min, normalized to cell number.
Results
Glucose
Calcium flux is a rapid and sensitive measure of cell activation. We monitored Ca2+ flux by flow cytometry by preloading the cells with the Ca2+ indicators Fluo‐3 and Fura red. These sensors increase and decrease fluorescence upon exposure to Ca2+, respectively, allowing a ratiometric analysis to be performed (Dustin 2000). The Fluo‐3/Fura red ratio was used to represent a comparable unit of intracellular Ca2+ level (Ca2+ (i)), while net AUC (prestimulation baseline subtracted area under the curve) represented a measure of total net Ca2+ flux within the stimulation time period. For unstimulated control cells (in 5 mmol/L glucose), Ca2+ (i) and AUC were relatively unchanged across the 150 sec time period (Fig 1A and B). Stimulation of duodenal EC cells with 100 mmol/L glucose caused a sustained reduction in Ca2+ (i) compared to prestimulation baseline (Fig 1A), resulting in a negative total net flux compared to the unstimulated control (AUC P < 0.01, Fig. 1B). No change in Ca2+ (i) from baseline, or change in AUC compared to unstimulated (5 mmol/L) control, was observed in response to 300 mmol/L glucose. However, 500 mmol/L glucose increased Ca2+ (i) (P < 0.001 vs. control, Fig. 3A and B), exceeding that observed with positive stimulatory control, TG (P < 0.05 vs. control). In order to relate these findings to 5‐HT secretion, 5‐HT release was determined by immunoassay. 5‐HT release from duodenal EC cells increased 20 min after exposure to 500 mmol/L glucose (0.36 ± 0.09 nmol/104 cells), in comparison to 500 mmol/L α‐MG (0.01 ± 0.07 nmol/104 cells, P < 0.01) or 5 mmol/L glucose exposure (control group, 0.04 ± 0.04 nmol/104 cells, P < 0.01, Fig. 1C).
Figure 1.
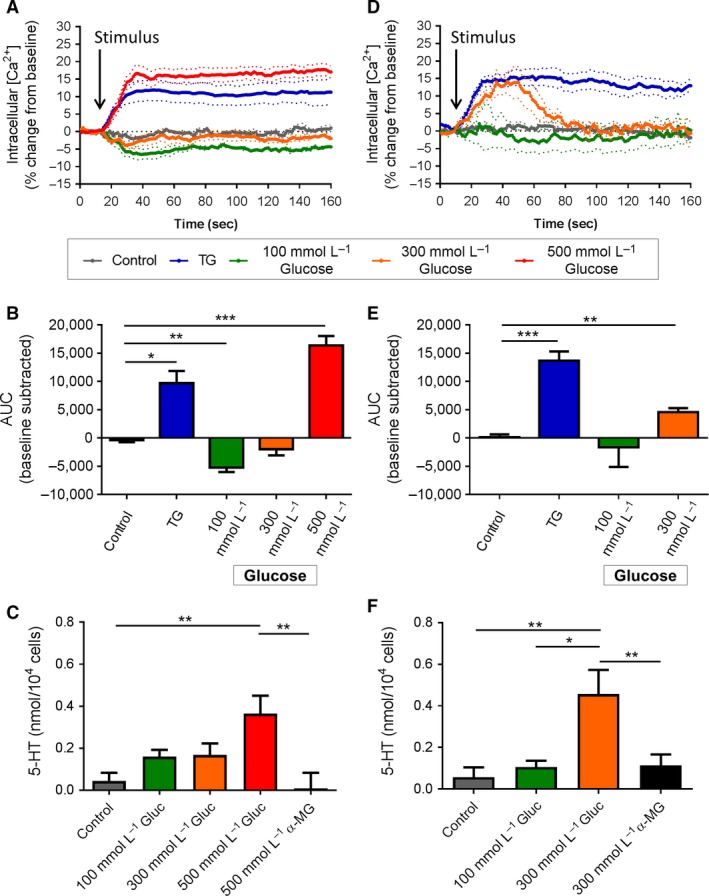
Effect of acute glucose stimulation on duodenal and colonic EC cells. (A) Time course of Ca2+ (i) changes in duodenal EC cells in response to glucose, shown as % change from baseline. Dotted lines indicate SEM. Arrow indicates time of stimulus addition (n = 3–8 mice). TG, thapsigargin. (B) AUC of Ca2+ (i) in duodenal EC cells. *P < 0.05, **P < 0.01, ***P < 0.001 (n = 3–8 mice). (C) Release of 5‐HT from duodenal EC cells in culture following 20 min exposure to glucose (Gluc) or α‐MG. *P < 0.01 (n = 4–7 mice). (D) Time course of Ca2+ (i) changes in colonic EC cells in response to glucose, shown as % change from baseline. Arrow indicates time of stimulus addition (n = 4–6 mice). (E) AUC of Ca2+ (i) in colonic EC cells. **P < 0.01, ***P < 0.001 (n = 4–6 mice). (F) Release of 5‐HT from colonic EC cells in culture following 20 min exposure to glucose (Gluc) or α‐MG. *P < 0.05, **P < 0.01 (n = 6–7 mice). Data are shown as mean ± SEM. AUC, area under the curve.
In colonic cells, exposure to 100 mmol/L glucose had no effect on Ca2+ (i) levels. However, 300 mmol/L glucose transiently raised Ca2+ (i) (Fig 1D) resulting in increased total net Ca2+ flux (AUC P < 0.01 vs. control, Fig. 1E). Release of 5‐HT from colonic EC cell in 20 min was increased when exposed to 300 mmol/L glucose (0.46 ± 0.12 nmol/104 cells), in comparison to 100 mmol/L glucose (0.11 ± 0.03 nmol/104 cells, P < 0.01), to 300 mmol/L of the nonmetabolizable sugar α‐MG (0.11 ± 0.05 nmol/104 cells, P < 0.01) or to the 5 mmol/L glucose control (0.06 ± 0.05 nmol/104 cells, P < 0.01, Fig. 1F).
Fructose
Exposure of duodenal EC cells to 100 mmol/L fructose did not change Ca2+ (i). However, dose‐dependent increases in Ca2+ (i) were observed in response to 300 mmol/L (AUC P < 0.05 vs. control) and 500 mmol/L fructose (AUC P < 0.05 vs. control), with the latter response comparable to that seen with TG (P < 0.01 vs. control, Fig. 2A and B). Fructose exposure also increased 5‐HT secretion from duodenal EC cells at both 300 mmol/L (0.88 ± 0.12 nmol/104 cells, P < 0.001 vs. control and α‐MG) and 500 mmol/L fructose (0.79 ± 0.18 nmol/104 cells, P < 0.001 vs. control and α‐MG). No change in 5‐HT secretion was seen with α‐MG exposure (Fig. 2C).
Figure 2.
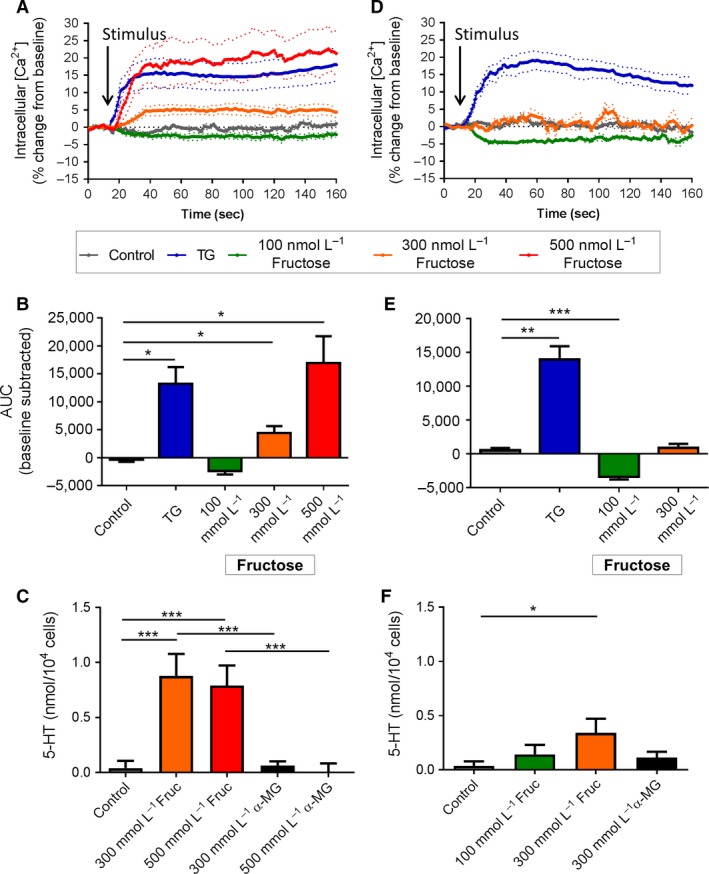
Effect of acute fructose stimulation on duodenal and colonic EC cells. (A) Time course of Ca2+ (i) changes in duodenal EC cells in response to fructose, shown as % change from baseline. Dotted lines indicate SEM. Arrow indicates time of stimulus addition (n = 3–9 mice). (B) AUC of Ca2+ (i) in duodenal EC cells. *P < 0.05 (n = 3–9 mice). (C) Release of 5‐HT from duodenal EC cells in culture following 20 min exposure to fructose (Fruc) or α‐MG. ***P < 0.001 (n = 4–9 mice). (D) Time course of Ca2+ (i) changes in colonic EC cells in response to fructose, shown as % change from baseline. Arrow indicates time of stimulus addition (n = 4–8 mice). (E) AUC of Ca2+ (i) in colonic EC cells. ***P < 0.001 (n = 4–8 mice). (F) Release of 5‐HT from colonic EC cells in culture following 20 min exposure to fructose (Fruc) or α‐MG. *P < 0.05 (n = 3–9 mice). Data are shown as mean ± SEM. AUC, area under the curve.
The Ca2+ (i) response to fructose in colonic EC cells differed to that in duodenal EC cells (Fig. 2D). Exposure to 100 mmol/L fructose decreased Ca2+ (i) in colonic EC cells (AUC P < 0.001 vs. control), but Ca2+ (i) did not change in the presence of 300 mmol/L fructose (Fig. 2E), as occurred in duodenal EC cells. 5‐HT secretion, however, was triggered from colonic EC cells after 20 min exposure to 300 mmol/L fructose (0.34 ± 0.13 nmol/104 cells, P < 0.01 vs. control, Fig. 2F).
Sucrose
Exposure of duodenal EC cells to 300 mmol/L sucrose induced a rapid and sustained increase in Ca2+ (i) (AUC P < 0.01 vs. control), comparable with that seen with TG (P < 0.01 vs. control, Fig. 3A and B). An increase in 5‐HT secretion from duodenal EC cells was also seen with exposure to 300 mmol/L sucrose (0.61 ± 0.18 nmol/104 cells, P < 0.01 vs. control), which did not occur with exposure to 300 mmol/L α‐MG (P < 0.05 vs. 300 mmol/L sucrose, Fig. 3C).
Figure 3.
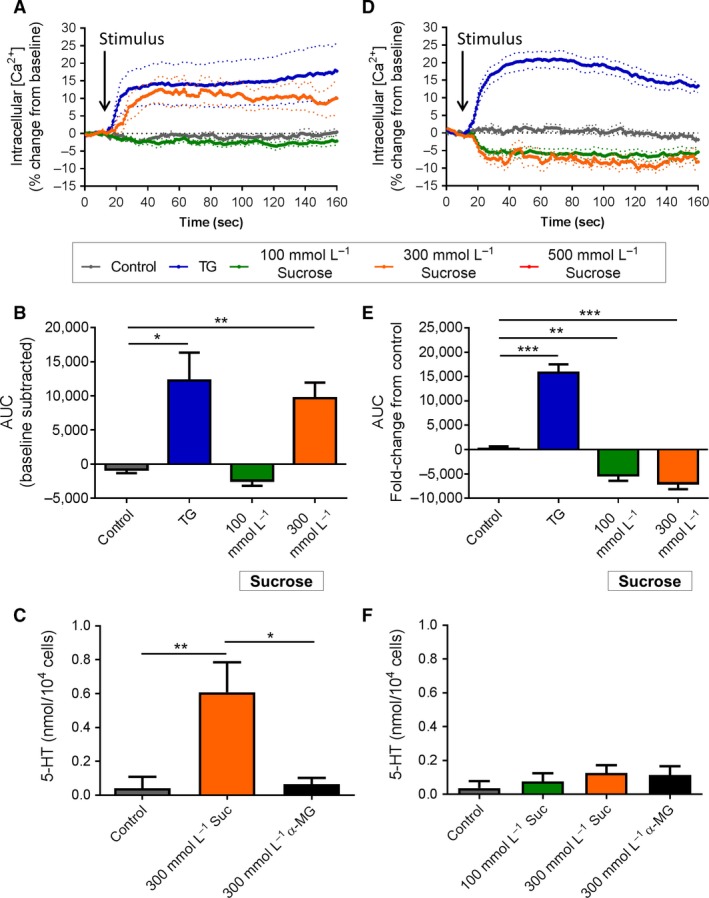
Effect of acute sucrose stimulation on duodenal and colonic EC cells. (A) Time course of Ca2+ (i) changes in duodenal EC cells in response to sucrose, shown as % change from baseline. Dotted lines indicate SEM. Arrow indicates time of stimulus addition (n = 4–5 mice). (B) AUC of Ca2+ (i) in duodenal EC cells. *P < 0.05, **P < 0.01 (n = 4–5 mice). (C) Release of 5‐HT from duodenal EC cells in culture following 20 min exposure to sucrose (Suc) or α‐MG. *P < 0.05, **P < 0.01 (n = 6–11 mice). (D) Time course of Ca2+ (i) changes in colonic EC cells in response to sucrose, shown as % change from baseline. Arrow indicates time of stimulus addition (n = 5 mice). (E) AUC of Ca2+ (i) in colonic EC cells. **P < 0.01, ***P < 0.001 (n = 5 mice). (F) Release of 5‐HT from colonic EC cells in culture following 20 min exposure to sucrose (Suc) or α‐MG (n = 3–9 mice). Data are shown as mean ± SEM. AUC, area under the curve.
A decrease in Ca2+ (i) was observed in colonic EC cells in response to both 100 mmol/L sucrose (P < 0.01 vs. control) and 300 mmol/L sucrose (P < 0.001 vs. control) (Fig. 3D and E). No increase in 5‐HT secretion was observed at any of the sucrose concentrations (Fig. 3F).
SCFA
EC cells were tested for response to the SCFAs acetate, butyrate, and propionate. Duodenal EC cells did not change Ca2+ (i) or secrete 5‐HT in response to a range of acetate concentrations from 1 to 100 mmol/L (Fig. 4A–C). Ca2+ (i) was reduced in colonic EC cells in response to 1 mmol/L (P < 0.05 vs. control) and 100 mmol/L acetate (P < 0.05 vs. control, Fig. 4D and E), however, this was not associated with any changes in 5‐HT secretion (Fig. 4F).
Figure 4.
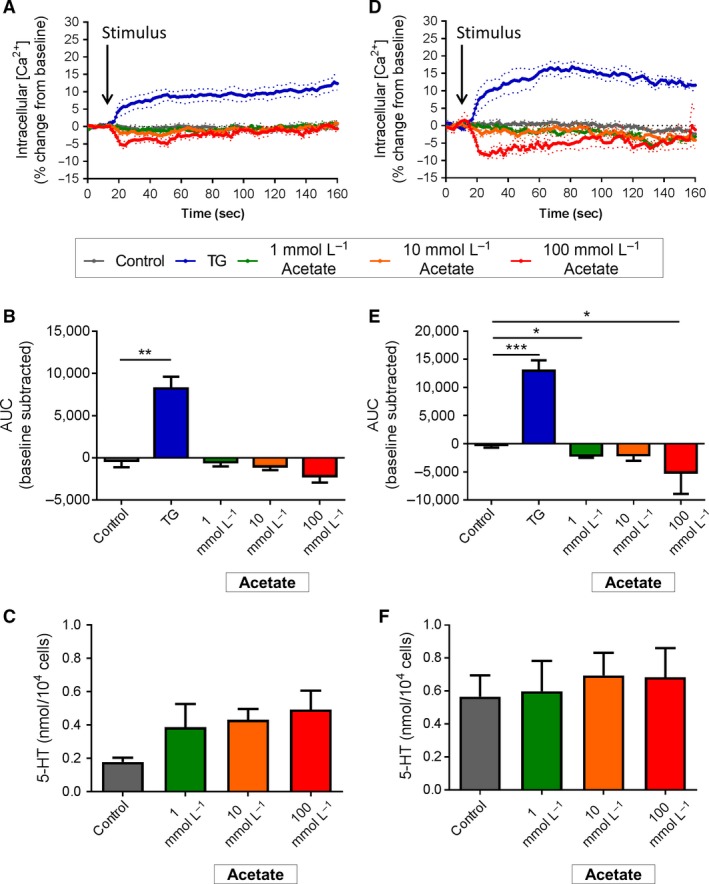
Effect of acetate stimulation on duodenal and colonic EC cells. (A) Time course of Ca2+ (i) changes in duodenal EC cells in response to acetate, shown as % change from baseline. Dotted lines indicate SEM. Arrow indicates time of stimulus addition (n = 4–5 mice). (B) AUC of Ca2+ (i) in duodenal EC cells. ** P < 0.01 (n = 5 mice). (C) Release of 5‐HT from duodenal EC cells in culture following 2 h exposure to acetate (Acet) or α‐MG. (n = 5–6 mice). (D) Time course of Ca2+ (i) changes in colonic EC cells in response to sucrose, shown as % change from baseline. Arrow indicates time of stimulus addition (n = 4–7 mice). (E) AUC of Ca2+ (i) in colonic EC cells. *P < 0.05, ***P < 0.001 (n = 4–7 mice). (F) Release of 5‐HT from colonic EC cells in culture following 2 h exposure to acetate (n = 5–8 mice). Data are shown as mean ± SEM. AUC, area under the curve.
Exposure to increasing concentrations of butyrate from 1 to 30 mmol/L did not alter Ca2+ (i) or release 5‐HT from duodenal EC cells (Fig. 5A–C). In colonic EC cells, however, Ca2+ (i) was reduced after exposure to both 15 mmol/L (P < 0.05 vs. control, Fig 5D) and 30 mmol/L butyrate (P < 0.05 vs. control, Fig. 5E). No change in 5‐HT secretion was observed after 2 hr incubation with butyrate (Fig. 5F).
Figure 5.
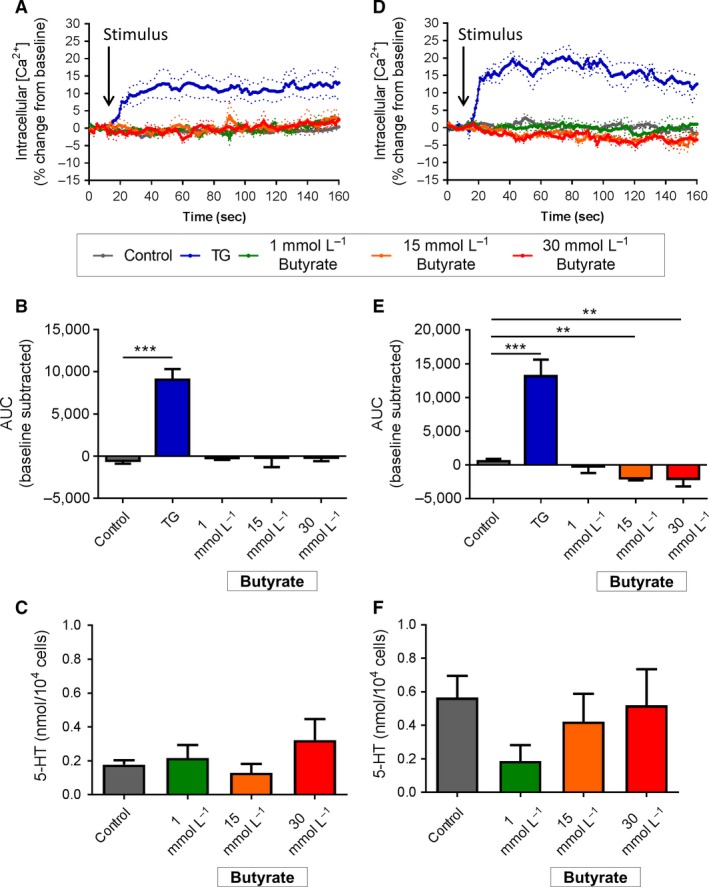
Effect of butyrate stimulation on duodenal and colonic EC cells. (A) Time course of Ca2+ (i) changes in duodenal EC cells in response to butyrate, shown as % change from baseline. Dotted lines indicate SEM. Arrow indicates time of stimulus addition (n = 4–5 mice). (B) AUC of Ca2+ (i) in duodenal EC cells. ***P < 0.001 (n = 4–5 mice). (C) Release of 5‐HT from duodenal EC cells in culture following 2 h exposure to butyrate (But) or α‐MG (n = 5 mice). (D) Time course of Ca2+ (i) changes in colonic EC cells in response to butyrate, shown as % change from baseline. Arrow indicates time of stimulus addition (n = 3–4 mice). (E) AUC of Ca2+ (i) in colonic EC cells. **P < 0.01 (n = 3–4 mice). (F) Release of 5‐HT from colonic EC cells in culture following 2 h exposure to butyrate. (n = 5–7 mice). Data are shown as mean ± SEM. AUC, area under the curve
Duodenal EC cells did not change Ca2+ (i) or secrete 5‐HT in response to increasing concentrations of propionate from 1 to 30 mmol/L (Fig. 6A–C). Colonic EC cells were unresponsive to 1 mmol/L propionate, however, Ca2+ (i) decreased upon exposure to 15 mmol/L (P < 0.05 vs. control) and 30 mmol/L propionate (P < 0.05 vs. control, Fig. 6D and E). This was not associated with any change in 5‐HT secretion after 2 h exposure to propionate (Fig. 6F).
Figure 6.
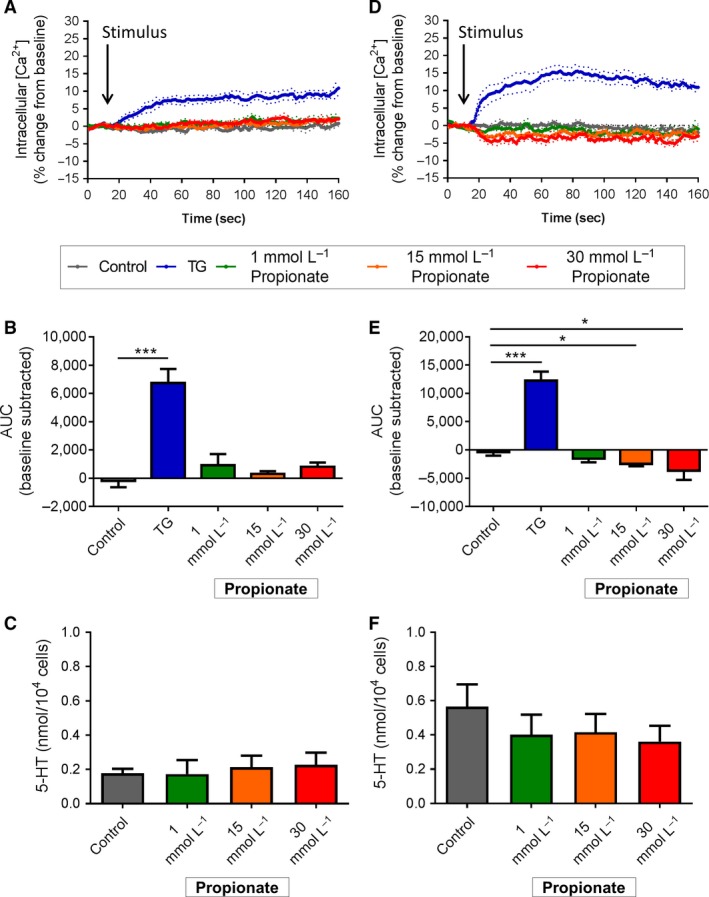
Effect of propionate stimulation on duodenal and colonic EC cells. (A) Time course of Ca2+ (i) changes in duodenal EC cells in response to propionate, shown as % change from baseline. Dotted lines indicate SEM. Arrow indicates time of stimulus addition (n = 4 mice). (B) AUC of Ca2+ (i) in duodenal EC cells. *P < 0.05, ***P < 0.001 (n = 4 mice). (C) Release of 5‐HT from duodenal EC cells in culture following 2 h exposure to propionate (Prop) or α‐MG (n = 5 mice). (D) Time course of Ca2+ (i) changes in colonic EC cells in response to propionate, shown as % change from baseline. Arrow indicates time of stimulus addition (n = 5 mice). (E) AUC of Ca2+ (i) in colonic EC cells. *P < 0.05, ***P < 0.001 (n = 5 mice). (F) Release of 5‐HT from colonic EC cells in culture following 2 h exposure to propionate (n = 5–6 mice). Data are shown as mean ± SEM. AUC, area under the curve.
Discussion
This study compared differences in nutrient sensing capacity in primary mouse EC cells obtained from duodenum and colon of the same animal. This provides a powerful approach allowing for a paired comparison of nutrient responses in EC cells obtained from different regions of the GI tract. A major finding is our demonstration of region‐specific responses of duodenal and colonic EC cells to sugars, as evidenced by differential increases in Ca2+ (i) and 5‐HT release. In particular, colonic EC cells showed higher sensitivity to glucose, while duodenal EC cells were more sensitive to fructose and sucrose. While sugars were found to elicit secretion of gut 5‐HT, acute exposure to SCFAs did not. Importantly, this 5‐HT secretion was nutrient dependent and did not occur secondary to osmotic influences, as the nonmetabolizable glucose analog, α‐MG, did not increase 5‐HT secretion in either duodenal or colonic EC cells at effective sugar doses to 500 mmol/L. This provides strong support for a receptor‐ or transporter‐mediated response underlying nutrient‐induced 5‐HT secretion.
Our data demonstrate that mouse EC cells do not respond to glucose at levels seen in circulation, and respond only to levels that occur within the GI tract following nutrient ingestion. While the concentration of sugars used to stimulate cells in this study appear high, luminal glucose concentrations within the GI tract have been proposed to reach 300 mmol/L at the brush‐border membrane (BBM) following a meal (Pappenheimer 1993), whereas the sucrose concentration of a standard sugar‐sweetened beverage can exceed 600 mmol/L. The fact that we find duodenal 5‐HT secretion occurs in response to 500 mmol/L, but not 300 mmol/L glucose, is likely due to the tuning of EC cell sensing machinery to luminal glucose cues.
We found that duodenal EC cells were more responsive to fructose than colonic EC cells. Fructose triggered Ca2+ entry and 5‐HT release in duodenal cells at 300 and 500 mmol/L. Despite equivalent 5‐HT secretion, intracellular Ca2+ influx in response to 300 mmol/L fructose stimulation was, however, significantly lower compared to 500 mmol/L fructose stimulation. This may be due to the level of Ca2+ needed for peak 5‐HT secretion occurring at this concentration, with increased Ca2+ above this level causing no further increase in 5‐HT secretion. However, while 300 mmol/L fructose triggered a small increase in 5‐HT release in colonic EC cells, it did so in the absence of an increase in cellular Ca2+ levels. It is possible that this difference is a result of the different duration of experiments used to measure intracellular calcium and 5‐HT secretion, and that significant amounts of Ca2+ may enter the cell in response to fructose over 20 min. Such a long duration was not possible to measure with our Ca2+ imaging approach. Exposure to fructose for 20 min in culture could also have permitted translocation of GLUT2/GLUT5 transporters to the plasma membrane (Mace et al. 2007) to increase 5‐HT release in colonic EC cells, a process unlikely to be evident during the Ca2+ measurement time frame. Alternatively, fructose may trigger 5‐HT release from colonic EC cells via Ca2+‐independent mechanisms.
High sucrose concentrations triggered similar release of 5‐HT release from duodenal, but not colonic EC cells. However, in this case, 300 mmol/L sucrose did not trigger Ca2+ entry or 5‐HT release in colonic EC cells. Hexose sugars and sweeteners are detected by the taste receptor family of proteins, which form as either heterodimers or homodimers. While the T1R2/T1R3 receptor heterodimer is expressed in the duodenum of humans (Young et al. 2009), T1R2 has been immunolocalized to only a small subset of human duodenal EC cells (Young et al. 2013), and T1R2 gene expression has not been detected in EC cells (Kidd et al. 2008; Martin et al. 2017). The lack of T1R2 suggests that the ability of duodenal EC cells to sense sucrose may occur via a T1R3 receptor homodimer, which has been identified as a low‐affinity glucose sensor in pancreatic β cells (Kojima et al. 2015).
The decrease in intracellular Ca2+ levels observed following stimulus exposure in some preparations, with predominantly lower stimulant concentrations, was unexpected and cannot be explained with the current methodology. Removal of Ca2+ from the intracellular space may be due to the resequestering of Ca2+ to endoplasmic stores, or extracellular release of Ca2+ due to changes in membrane permeability or ion transport channels. It is plausible that this is in efforts to maintain Ca2+ homeostasis through clearance of intracellular Ca2+, a mechanism shown to terminate a stimulus response in isolated mouse taste receptor cells through Na+–Ca2+ exchange (Szebenyi et al. 2010).
Intraduodenal infusion of sugars slows gastric emptying and nutrient intake in rodents and humans, which occurs via an extrinsic nerve reflex which is triggered, in part, by stimulation of 5‐HT3 receptors on vagal sensory neurons (Rayner et al. 2000; Raybould et al. 2003; Savastano et al. 2005a). Release of 5‐HT from EC cells in response to luminal sugars appears central to this pathway. Such glucose‐induced release of 5‐HT also stimulates duodenal bicarbonate secretion (Tuo et al. 2004) and suppresses the uptake of sodium from the lumen, thus affecting luminal water and electrolyte absorption (Imada‐Shirakata et al. 1997; Gill et al. 2005). The polarity of 5‐HT secretion from EC cells in gut, in response to luminal cues, has not been established. However, cell polarity has been shown to play an important role in luminal nutrient sensing in L cells (Kuhre et al. 2015), with nutrient sensing receptors and transporters exhibiting polar expression on either brush‐border or basolateral membranes (Mace et al. 2007). Possible differences in nutrient sensing between the apical and basolateral membrane of EC cells cannot be established using our single‐cell preparations, in which the polarity of EC cells becomes lost. In addition, intercellular interactions within the native environment of the gut, which could potentially modulate the response to luminal nutrients, are also lost. How changes to cell polarity and environment affect the basic cellular responses of EC cells to nutrients in culture is unknown. However, our findings of glucose sensing in isolated colonic EC cells is consistent with our previous work using intact colonic tissue preparations, in which cell‐to‐cell interactions and cell polarity are maintained (Zelkas et al. 2015).
The ability of glucose to trigger colonic 5‐HT release suggests a role of colonic 5‐HT in GI disease, as this region would have limited exposure to luminal glucose under situations of normal GI transit. However, in disease states with reduced intestinal transit time, the presence of higher luminal concentrations of ingested sugars may occur in the colon. It is possible that the increased sensitivity of colonic EC cells to glucose may play a role in side effects often observed in patients following Roux‐en‐Y gastric bypass surgery, which include diarrhea and nausea, and the often occurring complication of dumping syndrome (Tack and Deloose 2014). Nutrient‐induced 5‐HT release may also affect a number of systemic physiological processes, particularly those involved in energy metabolism. Peripheral 5‐HT release has been recently shown to augment hepatic gluconeogenesis to increase fasting blood glucose levels (Sumara et al. 2012), and to inhibit thermogenesis in brown adipose tissue (Crane et al. 2015). In addition, sweet taste triggered 5‐HT release from duodenal EC cells may also be important in the setting of metabolic disorders such as obesity and type 2 diabetes, where there is defective regulation of intestinal sweet taste receptors and exaggerated postprandial glucose absorption (Young et al. 2013).
Our finding that SCFAs do not acutely stimulate EC cell 5‐HT secretion is, perhaps, not surprising, given the sources of SCFAs available to these cells is likely low level constant exposure from gut microbiota. Gut microbiota are the primary source of these nutrients within the gut, especially in the colon which contains the largest source of gut bacteria (Donaldson et al. 2016). We chose a 2‐h incubation time for these experiments as this was adequate to observe a response to SCFAs in colonic L cells (Chambers et al. 2015). Our data demonstrate that SCFAs do not induce a direct secretory effect in mouse EC cells. This is in contrast to the established SCFA‐dependent increases in Tph1 expression and 5‐HT synthesis in EC cells observed with longer exposure of at least 4 h (Essien et al. 2013; Reigstad et al. 2015; Yano et al. 2015). What drives increases in Tph1 expression in response to these fatty acids is unknown, but constitutes an important potential link between gut microbiome and host physiology.
Our study provides the first comparative analysis of acute nutrient sensing capacity of EC cells from the mouse duodenum and colon. It is also the first to demonstrate the capacity for isolated primary EC cells from mice to respond to nutrients. This approach has revealed that duodenal EC cells are more responsive than colonic EC cells to fructose and sucrose, while the opposite is true for glucose responses. It has also revealed that SCFAs do not trigger acute Ca2+ entry or 5‐HT secretion at either intestinal site. Correspondingly, the responsiveness of intestinal EC cells to ingested nutrients is likely to be diverse and region dependent.
Conflict of Interest
The authors declare no conflicts of interest in relation to this research.
Acknowledgments
The authors thank Sheree Bailey and Jennifer Washington from the Flow Cytometry Unit at Flinders Medical Centre for their help with the flow cytometry experiments.
Martin A. M., Lumsden A. L., Young R. L., Jessup C. F., Spencer N. J., Keating D. J.. Regional differences in nutrient‐induced secretion of gut serotonin, Physiol Rep, 5 (6), 2017, e13199, doi: 10.14814/phy2.13199
Funding Information
This research was funded by the Australian Research Council and the Australian National Health and Medical Research Council.
References
- Akiba, Y. , Inoue T., Kaji I., Higashiyama M., Narimatsu K., Iwamoto K., et al. 2015. Short‐chain fatty acid sensing in rat duodenum. J. Physiol. 593:585–599. [DOI] [PMC free article] [PubMed] [Google Scholar]
- Alemi, F. , Poole D. P., Chiu J., Schoonjans K., Cattaruzza F., Grider J. R., et al. 2013. The receptor TGR5 mediates the prokinetic actions of intestinal bile acids and is required for normal defecation in mice. Gastroenterology 144:145–154. [DOI] [PMC free article] [PubMed] [Google Scholar]
- Alex, S. , Lange K., Amolo T., Grinstead J. S., Haakonsson A. K., Szalowska E., et al. 2013. Short‐chain fatty acids stimulate angiopoietin‐like 4 synthesis in human colon adenocarcinoma cells by activating peroxisome proliferator‐activated receptor gamma. Mol. Cell. Biol. 33:1303–1316. [DOI] [PMC free article] [PubMed] [Google Scholar]
- Chambers, E. S. , Viardot A., Psichas A., Morrison D. J., Murphy K. G., Zac‐Varghese S. E., et al. 2015. Effects of targeted delivery of propionate to the human colon on appetite regulation, body weight maintenance and adiposity in overweight adults. Gut 64:1744–1754. [DOI] [PMC free article] [PubMed] [Google Scholar]
- Crane, J. D. , Palanivel R., Mottillo E. P., Bujak A. L., Wang H., Ford R. J., et al. 2015. Inhibiting peripheral serotonin synthesis reduces obesity and metabolic dysfunction by promoting brown adipose tissue thermogenesis. Nat. Med. 21:166–172. [DOI] [PMC free article] [PubMed] [Google Scholar]
- Cummings, J. H. , Pomare E. W., Branch W. J., Naylor C. P., and Macfarlane G. T.. 1987. Short chain fatty acids in human large intestine, portal, hepatic and venous blood. Gut 28:1221–1227. [DOI] [PMC free article] [PubMed] [Google Scholar]
- Donaldson, G. P. , Lee S. M., and Mazmanian S. K.. 2016. Gut biogeography of the bacterial microbiota. Nat. Rev. Microbiol. 14:20–32. [DOI] [PMC free article] [PubMed] [Google Scholar]
- Dustin, L. B. 2000. Ratiometric analysis of calcium mobilization. Clin. App. Immunol. Rev. 1:5–15. [Google Scholar]
- Essien, B. E. , Grasberger H., Romain R. D., Law D. J., Veniaminova N. A., Saqui‐Salces M., et al. 2013. ZBP‐89 regulates expression of tryptophan hydroxylase I and mucosal defense against Salmonella typhimurium in mice. Gastroenterology 144:1466–1477, 1477 e1461‐1469. [DOI] [PMC free article] [PubMed] [Google Scholar]
- Freeman, S. L. , Bohan D., Darcel N., and Raybould H. E.. 2006. Luminal glucose sensing in the rat intestine has characteristics of a sodium‐glucose cotransporter. Am. J. Physiol. Gastrointest. Liver Physiol. 291:G439–G445. [DOI] [PubMed] [Google Scholar]
- Fukumoto, S. , Tatewaki M., Yamada T., Fujimiya M., Mantyh C., Voss M., et al. 2003. Short‐chain fatty acids stimulate colonic transit via intraluminal 5‐HT release in rats. Am. J. Physiol. Regul. Integr. Comp. Physiol. 284:R1269–R1276. [DOI] [PubMed] [Google Scholar]
- Gershon, M. D. , and Tack J.. 2007. The serotonin signaling system: from basic understanding to drug development for functional GI disorders. Gastroenterology 132:397–414. [DOI] [PubMed] [Google Scholar]
- Gill, R. K. , Saksena S., Tyagi S., Alrefai W. A., Malakooti J., Sarwar Z., et al. 2005. Serotonin inhibits Na+/H+ exchange activity via 5‐HT4 receptors and activation of PKC alpha in human intestinal epithelial cells. Gastroenterology 128:962–974. [DOI] [PubMed] [Google Scholar]
- Imada‐Shirakata, Y. , Kotera T., Ueda S., and Okuma M.. 1997. Serotonin activates electrolyte transport via 5‐HT2A receptor in rat colonic crypt cells. Biochem. Biophys. Res. Commun. 230:437–441. [DOI] [PubMed] [Google Scholar]
- Keating, D. J. , and Spencer N. J.. 2010. Release of 5‐hydroxytryptamine from the mucosa is not required for the generation or propagation of colonic migrating motor complexes. Gastroenterology 138:659–670, 670 e651‐652. [DOI] [PubMed] [Google Scholar]
- Kidd, M. , Modlin I. M., Gustafsson B. I., Drozdov I., Hauso O., and Pfragner R.. 2008. Luminal regulation of normal and neoplastic human EC cell serotonin release is mediated by bile salts, amines, tastants, and olfactants. Am. J. Physiol. Gastrointest. Liver Physiol. 295:G260–G272. [DOI] [PubMed] [Google Scholar]
- Kim, M. , Cooke H. J., Javed N. H., Carey H. V., Christofi F., and Raybould H. E.. 2001. D‐glucose releases 5‐hydroxytryptamine from human BON cells as a model of enterochromaffin cells. Gastroenterology 121:1400–1406. [DOI] [PubMed] [Google Scholar]
- Kojima, I. , Nakagawa Y., Hamano K., Medina J., Li L., and Nagasawa M.. 2015. Glucose‐sensing receptor T1R3: a new signaling receptor activated by glucose in pancreatic beta‐cells. Biol. Pharm. Bull. 38:674–679. [DOI] [PubMed] [Google Scholar]
- Kuhre, R. , Frost C., Svendsen B., and Holst J.. 2015. Molecular mechanisms of glucose‐stimulated GLP‐1 secretion from perfused rat small intestine. Diabetes 64:370–382. [DOI] [PubMed] [Google Scholar]
- Mace, O. J. , Affleck J., Patel N., and Kellett G. L.. 2007. Sweet taste receptors in rat small intestine stimulate glucose absorption through apical GLUT2. J. Physiol. 582:379–392. [DOI] [PMC free article] [PubMed] [Google Scholar]
- Martin, A. M. , Lumsden A. L., Young R. L., Jessup C. F., Spencer N. J., and Keating D. J.. 2017. The nutrient sensing repertoires of mouse enterochromaffin cells differs between duodenum and colon. Neurogastroenterol. Motil. e13046. [DOI] [PubMed] [Google Scholar]
- Modlin, I. M. , Kidd M., Pfragner R., Eick G. N., and Champaneria M. C.. 2006. The functional characterization of normal and neoplastic human enterochromaffin cells. J. Clin. Endocrinol. Metabol. 91:2340–2348. [DOI] [PubMed] [Google Scholar]
- Nzakizwanayo, J. , Dedi C., Standen G., Macfarlane W. M., Patel B. A., and Jones B. V.. 2015. Escherichia coli Nissle 1917 enhances bioavailability of serotonin in gut tissues through modulation of synthesis and clearance. Sci. Rep. 5:17324. [DOI] [PMC free article] [PubMed] [Google Scholar]
- Pappenheimer, J. R. 1993. On the coupling of membrane digestion with intestinal absorption of sugars and amino acids. Am. J. Physiol. 265:G409–G417. [DOI] [PubMed] [Google Scholar]
- Raghupathi, R. , Duffield M. D., Zelkas L., Meedeniya A., Brookes S. J., Sia T. C., et al. 2013. Identification of unique release kinetics of serotonin from guinea‐pig and human enterochromaffin cells. J. Physiol. 591:5959–5975. [DOI] [PMC free article] [PubMed] [Google Scholar]
- Raghupathi, R. , Jessup C. F., Lumsden A. L., and Keating D. J.. 2016. Fusion Pore Size Limits 5‐HT Release From Single Enterochromaffin Cell Vesicles. J. Cell. Physiol. 231:1593–1600. [DOI] [PubMed] [Google Scholar]
- Raybould, H. E. , Glatzle J., Robin C., Meyer J. H., Phan T., Wong H., et al. 2003. Expression of 5‐HT3 receptors by extrinsic duodenal afferents contribute to intestinal inhibition of gastric emptying. Am. J. Physiol. Gastrointest. Liver Physiol. 284:G367–G372. [DOI] [PubMed] [Google Scholar]
- Rayner, C. K. , Park H. S., Wishart J. M., Kong M., Doran S. M., and Horowitz M.. 2000. Effects of intraduodenal glucose and fructose on antropyloric motility and appetite in healthy humans. Am. J. Physiol. Regul. Integr. Comp. Physiol. 278:R360–R366. [DOI] [PubMed] [Google Scholar]
- Reigstad, C. S. , Salmonson C. E., Rainey J. F. 3rd, Szurszewski J. H., Linden D. R., Sonnenburg J. L., et al. 2015. Gut microbes promote colonic serotonin production through an effect of short‐chain fatty acids on enterochromaffin cells. FASEB J. 29:1395–1403. [DOI] [PMC free article] [PubMed] [Google Scholar]
- Savastano, D. , Carelle M., and Covasa M.. 2005a. Serotonin‐type 3 receptors mediate intestinal Polycose‐ and glucose‐induced suppression of intake. Am. J. Physiol. Regul. Integr. Comp. Physiol. 288:508. [DOI] [PubMed] [Google Scholar]
- Savastano, D. M. , Carelle M., and Covasa M.. 2005b. Serotonin‐type 3 receptors mediate intestinal Polycose‐ and glucose‐induced suppression of intake. Am. J. Physiol. Regul. Integr. Comp. Physiol. 288:R1499–R1508. [DOI] [PubMed] [Google Scholar]
- Spencer, N. J. , Nicholas S. J., Robinson L., Kyloh M., Flack N., Brookes S. J., et al. 2011. Mechanisms underlying distension‐evoked peristalsis in guinea pig distal colon: is there a role for enterochromaffin cells? Am. J. Physiol. Gastrointest. Liver Physiol. 301:G519–G527. [DOI] [PubMed] [Google Scholar]
- Sumara, G. , Sumara O., Kim J. K., and Karsenty G.. 2012. Gut‐derived serotonin is a multifunctional determinant to fasting adaptation. Cell Metab. 16:588–600. [DOI] [PMC free article] [PubMed] [Google Scholar]
- Symonds, E. L. , Peiris M., Page A. J., Chia B., Dogra H., Masding A., et al. 2015. Mechanisms of activation of mouse and human enteroendocrine cells by nutrients. Gut 64:618–626. [DOI] [PMC free article] [PubMed] [Google Scholar]
- Szebenyi, S. A. , Laskowski A. I., and Medler K. F.. 2010. Sodium/calcium exchangers selectively regulate calcium signaling in mouse taste receptor cells. J. Neurophysiol. 104:529–538. [DOI] [PMC free article] [PubMed] [Google Scholar]
- Tack, J. , and Deloose E.. 2014. Complications of bariatric surgery: dumping syndrome, reflux and vitamin deficiencies. Best Pract. Res. Clin. Gastroenterol. 28:741–749. [DOI] [PubMed] [Google Scholar]
- Topping, D. L. , and Clifton P. M.. 2001. Short‐chain fatty acids and human colonic function: roles of resistant starch and nonstarch polysaccharides. Physiol. Rev. 81:1031–1064. [DOI] [PubMed] [Google Scholar]
- Tuo, B. G. , Sellers Z., Paulus P., Barrett K. E., and Isenberg J. I.. 2004. 5‐HT induces duodenal mucosal bicarbonate secretion via cAMP‐ and Ca2+‐dependent signaling pathways and 5‐HT4 receptors in mice. Am. J. Physiol. Gastrointest. Liver Physiol. 286:G444–G451. [DOI] [PubMed] [Google Scholar]
- Walther, D. J. , Peter J. U., Bashammakh S., Hortnagl H., Voits M., Fink H., et al. 2003. Synthesis of serotonin by a second tryptophan hydroxylase isoform. Science 299:76. [DOI] [PubMed] [Google Scholar]
- Yajima, T. , and Sakata T.. 1992. Core and periphery concentrations of short‐chain fatty acids in luminal contents of the rat colon. Comp. Biochem. Physiol. Comp. Physiol. 103:353–355. [DOI] [PubMed] [Google Scholar]
- Yano, J. M. , Yu K., Donaldson G. P., Shastri G. G., Ann P., Ma L., et al. 2015. Indigenous bacteria from the gut microbiota regulate host serotonin biosynthesis. Cell 161:264–276. [DOI] [PMC free article] [PubMed] [Google Scholar]
- Young, R. L. , Sutherland K., Pezos N., Brierley S. M., Horowitz M., Rayner C. K., et al. 2009. Expression of taste molecules in the upper gastrointestinal tract in humans with and without type 2 diabetes. Gut 58:337–346. [DOI] [PubMed] [Google Scholar]
- Young, R. L. , Chia B., Isaacs N. J., Ma J., Khoo J., Wu T., et al. 2013. Disordered control of intestinal sweet taste receptor expression and glucose absorption in type 2 diabetes. Diabetes 62:3532–3541. [DOI] [PMC free article] [PubMed] [Google Scholar]
- Zelkas, L. , Raghupathi R., Lumsden A. L., Martin A. M., Sun E., Spencer N. J., et al. 2015. Serotonin‐secreting enteroendocrine cells respond via diverse mechanisms to acute and chronic changes in glucose availability. Nut. Metabol. 12:55. [DOI] [PMC free article] [PubMed] [Google Scholar]