Abstract
Purpose
A brain sized radio frequency (RF)‐penetrable PET insert has been designed for simultaneous operation with MRI systems. This system takes advantage of electro‐optical coupling and battery power to electrically float the PET insert relative to the MRI ground, permitting RF signals to be transmitted through small gaps between the modules that form the PET ring. This design facilitates the use of the built‐in body coil for RF transmission and thus could be inserted into any existing MR site wishing to achieve simultaneous PET/MR imaging. The PET detectors employ nonmagnetic silicon photomultipliers in conjunction with a compressed sensing signal multiplexing scheme, and optical fibers to transmit analog PET detector signals out of the MRI room for decoding, processing, and image reconstruction.
Methods
The PET insert was first constructed and tested in a laboratory benchtop setting, where tomographic images of a custom resolution phantom were successfully acquired. The PET insert was then placed within a 3T body MRI system, and tomographic resolution/contrast phantom images were acquired both with only the B0 field present, and under continuous pulsing from different MR imaging sequences.
Results
The resulting PET images have comparable contrast‐to‐noise ratios (CNR) under all MR pulsing conditions: The maximum percent CNR relative difference for each rod type among all four PET images acquired in the MRI system has a mean of 14.0 ± 7.7%. MR images were successfully acquired through the RF‐penetrable PET shielding using only the built‐in MR body coil, suggesting that simultaneous imaging is possible without significant mutual interference.
Conclusions
These results show promise for this technology as an alternative to costly integrated PET/MR scanners; a PET insert that is compatible with any existing clinical MRI system could greatly increase the availability, accessibility, and dissemination of PET/MR.
Keywords: image reconstruction, multimodality, PET detectors, PET/MRI , positron emission tomography, RF‐penetrable
1. Introduction
Combined PET (positron emission tomography) and MRI (magnetic resonance imaging) shows promise as a powerful tool for multiparameter disease characterization, beyond what is currently possible with either modality individually.1, 2 While PET offers excellent molecular sensitivity, it is fundamentally a functional imaging modality and cannot effectively visualize structure. MRI excels at soft tissue contrast and structural imaging, while also being capable of functional imaging techniques such as diffusion weighted imaging.3 In contrast to the CT (computed tomography) scanners that are currently paired with PET to give structural data, MRI does not contribute additional ionizing radiation dose. The capabilities of PET and MRI are complementary, with potentially revolutionary applications in a wide range of medical fields such as neurology, cardiology, and oncology.4, 5, 6 However, the current cost of PET/MR systems makes it challenging to explore potential useful clinical indications for the technology.
There have been many design approaches to combined PET/MRI, with varying ways to address the fundamental hardware conflicts. An early combined small animal system worked around the incompatibility of PET and MRI hardware by only placing the PET scintillation crystals in the MR bore and transmitting the resulting scintillation light to photodetectors outside of the MRI over optical fiber.7 This technique avoids mutual interference effects by taking advantage of the electrical and magnetic insensitivity of the crystal and fiber components, but dispersion of the visible light in the fiber ultimately degrades system spatial, temporal, and energy performance. More recent combined systems have instead coupled the crystals directly to photodetectors and shielded the detectors and readout electronics inside8 or near9 the MRI bore.
The PET insert, a separate and removable PET scanner placed within the MRI bore, should ideally be fully compatible with existing MRI scanners and requires no hardware modification. In addition, a small diameter PET insert for brain imaging has the additional advantages of higher photon sensitivity10 and the ability to be inserted into higher performance narrow bore MR systems. The feasibility of simultaneous clinical imaging with a removable PET insert has been demonstrated,10, 11 and some systems currently under development focus on high sensitivity and spatial resolution for detailed brain imaging studies.12, 13 Other existing combined PET/MR architectures are sequential PET/MR with physically separate PET and MR systems, and fully integrated PET/MR with inseparable PET and MR systems.14 While the sequential architecture, exemplified by the Philips Ingenuity TF,10 has lighter requirements for managing mutual interference, it is not capable of simultaneous imaging with both modalities, potentially leading to longer scan times and imperfect spatial and temporal image coregistration. The integrated approach, taken in the Siemens Biograph mMR15 and the GE SIGNA PET/MR,16 allows for true simultaneous acquisition and excellent image coregistration, but requires either extensive modification to existing MR hardware or the purchase and installation of the complete integrated PET + MR system. While these commercially available whole body combined PET/MR systems offer excellent performance, their cost is prohibitively high for many institutions. The PET insert concept provides a simpler and lower‐cost alternative for combined scanning in institutions with existing MRI systems. As a result of this wider availability, the opportunity to scan patients and perform studies highlighting the benefits of combined PET/MR would increase.
Mutual interference between the two systems takes several forms and can lead to image artifacts and performance degradation.14, 17 These effects include eddy currents which can cause heating, vibration, and ghosting artifacts, RF noise which can saturate PET detectors or degrade MR images, and magnetic field susceptibility and nonuniformity artifacts. Design and implementation of an MR compatible PET system that allows simultaneous operation is therefore a challenging task. To date, combining PET with MRI also requires that the RF transmit coil is installed within the PET ring.8, 10, 15 An RF coil within the PET ring can also degrade PET images by increasing photon attenuation and scatter. To simplify the insert concept, and potentially improve the resulting simultaneous PET/MR performance, it would be desirable to use the built‐in body coil of the MR system for the RF transmitter; this requires that the PET insert is RF‐penetrable.
A brain sized RF‐penetrable PET insert has been designed for compatibility with existing MRI scanners and enabled with “electro‐optical signal transmission” and battery power. This work presents the first simultaneous PET/MR images acquired with this full system. The PET insert was placed in the bore of a 3T MR scanner, and phantom images were acquired during continuous MR pulsing. In this work, MR images were acquired simultaneously by transmitting and receiving RF pulses through the PET ring using only built‐in body coil. If successful, the novel RF‐penetrable PET insert described here could enable any site owning an MR system to achieve simultaneous PET/MR imaging using the built‐in body coil for RF transmission.
2. Methods
2.1. PET insert
The MR compatible, RF‐penetrable PET insert consists of a ring of 16 detector modules each encased in copper Faraday cages (Fig. 1, left) with a 1 mm intermodule air gap. The inner and outer diameters of the insert are 32 cm and 40 cm, respectively. Each detector module comprises a 2 × 4 mosaic of 4 × 4 arrays of lutetium yttrium oxyorthosilicate (LYSO) scintillation crystal arrays coupled to nonmagnetic silicon photomultiplier (SiPM) arrays (manufactured in 2008 by SensL, Cork, Ireland), resulting in 128 scintillation detectors arranged in a 16 × 8 pattern. The dimensions of each LYSO crystal element are 3.2 × 3.2 × 20 mm3, and they are 1:1 coupled to each of the matching 3.2 × 3.2 mm2 SiPM pixels. The axial field of view of this prototype PET ring is 2.6 cm (two SiPM array widths). Using a technique known as compressed sensing, which was specifically designed for and tested with this scanner configuration,18, 19 the signal from each detector pixel is split among a unique combination of 16 optical output channels. The 128 pixels in each detector module are therefore multiplexed at an 8:1 ratio, greatly decreasing the number of output channels that must be brought out of the MRI. The Faraday cage shielding comprises six sides of continuous bare copper‐plated FR4 (fiberglass composite often used as the base of printed circuit boards) electrically connected with soldered seams and copper tape. The copper plating was 17.4 μm thick on the four sides and the inner face, and 34.8 μm thick plating on the outer face. Passive thermal regulation for detector module cooling is achieved with ceramic heat sinks mounted to the inside of the outer shielding face, in thermal contact with both the detector electronics board and the outer surface of the shielding. The PET insert is designed to have a small electronic footprint inside the MRI to avoid interference effects or magnetic susceptibility artifacts. The output signals are therefore all transmitted on optical fibers, which, unlike coaxial electrical cable, do not require electromagnetic shielding from the MRI and enable isolation of the electrical grounds between the MRI system and the PET insert. Furthermore, the PET insert is powered completely by nonmagnetic batteries to facilitate this isolated grounding.
Figure 1.
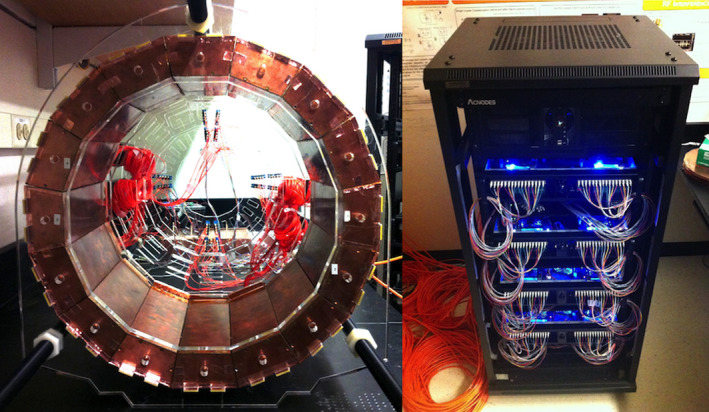
Left: PET insert, comprising a ring of 16 detector modules with 1 mm gaps in between. Right: 256 channel optical data acquisition system that receives scintillation detector signals (transmitted in the form of near infrared light) from the optical fibers. [Color figure can be viewed at wileyonlinelibrary.com]
The RF‐penetrability of the PET insert is achieved by having the PET ring electrically float relative to the MRI system and by leaving small 1 mm gaps between adjacent detector module shields.20 The RF field transmits from the MR body coil into the imaging volume through these gaps, and in this work, the resulting RF signal is also received back in the body coil through the gaps. Simultaneous PET/MR is therefore possible simply by placing the PET insert in the MR bore, using the built‐in MRI body coil for RF transmitting and receiving.
Custom nonmagnetic VCSELs (vertical‐cavity surface‐emitting lasers) and fiber launch fixtures transmit the SiPM analog pulses out of the detector module shields on multimode optical fiber at 850 nm,21 which then passes from the MRI room through a waveguide into the control room where the data acquisition system resides, preventing RF leakage to the data acquisition system. The 256 total output fibers are read out by photodiodes mounted at the front of the data acquisition system (Fig. 1, right). The data acquisition system, developed in‐house, is comprised of eight receiver/processor subunits linked together in a high‐speed daisy chain configuration.22 Each subunit contains 32 optical receiver channels (for two detector modules) that are filtered and then individually digitized by four eight‐channel free running ADCs (analog to digital converters, TI ADS5282) with a sampling rate of 65 Msps. The digitized output is processed by an FPGA (field‐programmable gate array, Xilinx Virtex‐5), which sends a data packet containing timing and channel amplitude information through the daisy chain to the other FPGA boards for coincidence sorting. Coincidence events are sent to a data acquisition PC, where pixel position is decoded using a calibrated compressed sensing matrix. Event data are then streamed to a hard disk where it is stored for later analysis and image reconstruction. The data acquisition system is housed in wheeled rack unit (Fig. 1, right), complete with a folding rack‐mount input console and monitor, allowing it to be easily transported to and from the MRI facility.
2.2. Tomographic imaging
2.2.1. Phantom scanning
A 3D‐printed resolution phantom was fabricated from UV‐cured plastic (3D Systems VisiJet M3).23 The phantom was designed with hot rods of three different sizes (3.2 mm, 4.2 mm, and 5.2 mm diameter) in a cold background, as well as 4.2‐mm cold rods in a hot background (Fig. 2). A normalization phantom was also fabricated, consisting of a uniform hot cylinder with the same outer dimensions as the resolution phantom. The similar linear attenuation coefficients of water and plastic at 511 keV enable normalization scans of this phantom to also be used for attenuation correction.24
Figure 2.
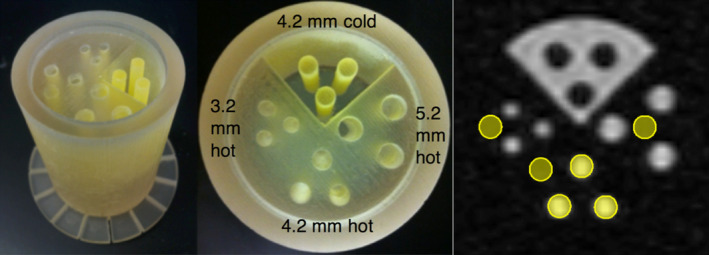
3D‐printed PET resolution phantom used for tomographic imaging. A total of 3.2‐, 4.2‐, and 5.2‐mm hot rods in cold background, and 4.2‐mm cold rods in hot background. Phantom inner diameter of 40 mm, length (of section containing activity) of 40 mm. Right: placement of 4.2 mm ROIs for analysis; similar placement for other rod sizes. [Color figure can be viewed at wileyonlinelibrary.com]
The phantoms were each filled with approximately 500 μCi of 18FDG solution and, during scanning, were placed in a holding fixture in the center of the PET field of view, with the length of the cylinder aligned axially with the scanner. Approximately four million coincidences were acquired in each scan. Although the plastic PET resolution phantom is not an ideal material for MR imaging, MR images of this phantom were acquired without and with the PET ring inserted as another means to study whether the RF fields indeed penetrate the PET ring.
2.2.2. Image reconstruction
PET images were iteratively reconstructed using 3D list‐mode MLEM (maximum likelihood estimation maximization) implemented on a GPU (graphics processing unit) installed in the data acquisition PC.25 Reconstruction ran for 30 iterations, using 64 × 64 × 16 voxels (transaxial2 × axial with respect to the scanner) of size 0.8 × 0.8 × 1.6 mm3, and a transaxial Gaussian postfilter (full width at half maximum of 1.6 mm) was applied. An energy window of 410–610 keV and a coincidence time window of 10 ns were used. No corrections for Compton scatter or random coincidences were implemented. Sensitivity maps that include normalization and attenuation correction were generated by back projecting all LORs (lines of response) acquired in the normalization scan with an equal weight. This sensitivity map is incorporated into each iteration of the MLEM algorithm.26
2.3. Simultaneous PET/MR imaging
The PET insert was placed within a GE Healthcare Discovery MR750w 3T whole body clinical MRI scanner (Fig. 3). The PET scanner was powered with batteries and connected to the data acquisition system with optical fibers passing from the scan room to the control room. Three standard MR imaging pulse sequences were evaluated for simultaneous PET/MR imaging: FSE (fast spin echo), GRE (gradient echo), and EPI (echo planar imaging). Table 1 lists the scan parameters of each sequence. Each of these pulse sequences uses different levels and patterns of RF power and gradient slew rate and may interfere with the PET detectors in different ways. For example, high RF power may leak into the PET module Faraday shields and saturate the detector electronics, while gradients may heat up the modules or cause vibration. PET image data were acquired while the sequence under evaluation was running continuously, for approximately 12 min per acquisition. In this work, all MR images were acquired using the built‐in body coil, so RF signals were both transmitted and received through the RF‐penetrable PET insert.
Figure 3.
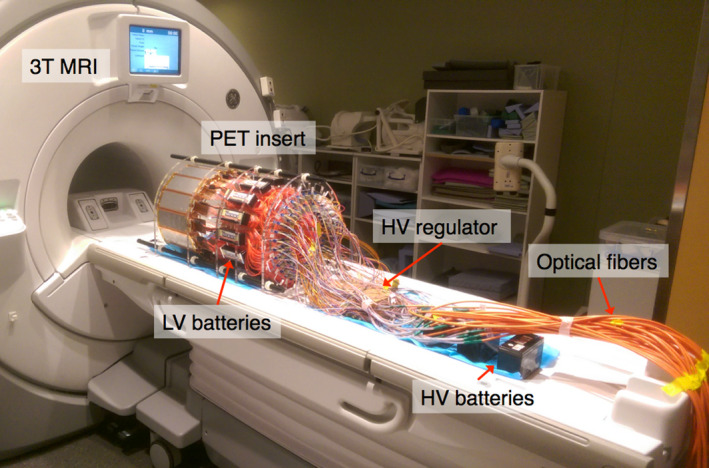
PET insert on 3T MRI bed, powered with batteries and connected to the data acquisition system with 20 m length optical fibers. The data acquisition system resided in the adjacent control room. [Color figure can be viewed at wileyonlinelibrary.com]
Table 1.
Parameters of the three MR pulse sequences that were evaluated for simultaneous imaging
| Sequence | TR (ms) | TE (ms) | Voxel size (mm3) | Matrix size | Flip angle (°) |
|---|---|---|---|---|---|
| FSE | 3000 | 69.552 | 0.8594 × 0.8594 × 5 | 256 × 256 × 5 | 90 |
| GRE | 1000 | 4.9 | 0.8594 × 0.8594 × 6 | 256 × 256 × 5 | 90 |
| EPI | 2000 | 30 | 3.4375 × 3.4375 × 4 | 64 × 64 × 5 | 90 |
Cylindrical ROIs (regions of interest) with diameters equal to the corresponding rods and spanning all slices were placed on each of the hot and cold rods as well as in hot and cold background regions in the reconstructed PET images (Fig. 2, right). The images acquired during each of the pulse sequences were compared in terms of contrast‐to‐noise ratio (CNR), defined as
where and are the mean voxel values in the rod and background ROIs, respectively, and is the standard deviation of the voxel values in the background ROIs.27 All image slices were used in the calculation.
The phantom used has no warm background, so the noise present in the reconstructed cold background regions provided the background signal. The background noise of the image ideally should not fluctuate, but noise introduced by the MR imaging sequences in the PET electronics, for example, could lead to an increase in image noise. Likewise for the MR images, effects like ghosting from the presence of the PET insert can lead to spurious signal in the otherwise cold background. Given that the cold rod CNR values are negative by the above definition, the absolute value of the cold rod CNR was calculated for ease of plotting and comparison with the hot rod values.
3. Results
3.1. Tomographic imaging
Figure 4 shows the reconstructed image of the PET resolution phantom acquired in the laboratory. The image is a sum of all slices, with 3.6 million LORs. Mean CNR for each rod size in this “PET‐only” acquisition is given in Table 2.
Figure 4.
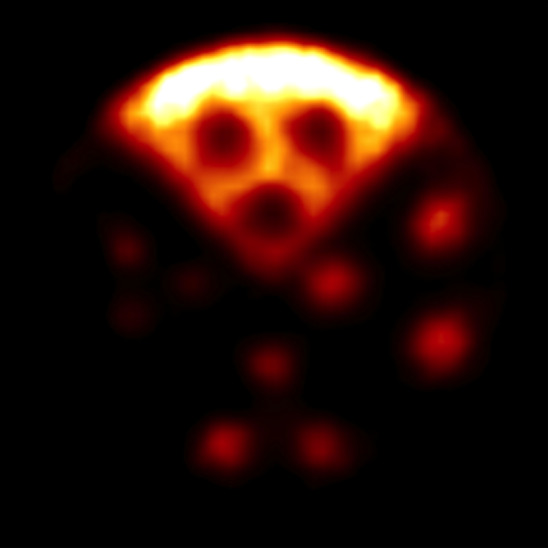
Reconstructed tomographic PET image of the resolution phantom acquired in a laboratory benchtop setting (outside MR suite). [Color figure can be viewed at wileyonlinelibrary.com]
Table 2.
Mean (standard deviation) CNR of the three rods of each type for PET and MR images of PET resolution phantom, for each type of rod. PET data correspond to images in Figs. 4 and 5; MRI data correspond to images in Fig. 7. Percentage difference (Δ) from reference measurements (“PET only” and “no PET” for PET and MR images, respectively) is given to the right of each CNR value
| PET images | 3.2 mm hot | Δ (%) | 4.2 mm hot | Δ (%) | 5.2 mm hot | Δ (%) | 4.2 mm cold | Δ (%) |
|---|---|---|---|---|---|---|---|---|
| PET only | 8.82 (2.39) | Ref | 13.97 (2.93) | Ref | 14.36 (1.92) | Ref | 1.64 (0.45) | Ref |
| B0 only | 5.34 (1.21) | −39.4 | 9.41 (1.80) | −32.7 | 9.83 (1.88) | −31.5 | 1.36 (0.51) | −17.4 |
| GRE | 6.46 (1.41) | −26.8 | 10.40 (1.87) | −25.6 | 10.91 (1.05) | −24.0 | 1.35 (0.44) | −18.0 |
| FSE | 6.30 (1.23) | −28.6 | 10.26 (2.22) | −26.5 | 11.63 (1.74) | −19.0 | 1.30 (0.45) | −20.7 |
| EPI | 6.11 (1.36) | −30.7 | 10.51 (2.02) | −24.7 | 11.74 (1.16) | −18.2 | 1.35 (0.37) | −18.1 |
| MR images | ||||||||
| GRE (no PET) | 19.34 (3.75) | Ref | 23.88 (2.12) | Ref | 22.55 (2.34) | Ref | 2.87 (0.00) | Ref |
| GRE (with PET) | 14.89 (3.25) | −23.0 | 17.99 (2.12) | −24.7 | 18.15 (1.43) | −19.5 | 2.56 (0.05) | −10.7 |
| FSE (no PET) | 38.73 (3.15) | Ref | 41.79 (2.30) | Ref | 21.85 (0.51) | Ref | 5.42 (0.16) | Ref |
| FSE (with PET) | 19.81 (1.98) | −48.8 | 18.82 (1.25) | −55.0 | 17.83 (0.58) | −18.4 | 5.57 (0.20) | 2.9 |
3.2. Simultaneous PET/MR imaging
Reconstructed PET images of the resolution phantom under different MRI pulse sequences are shown in Fig. 5. The images are sums of all slices, each with 3.6 million LORs. Mean CNR for the different rod types in the phantom for each pulse sequence is given in Table 2. Figure 6 (left) plots the CNR of the “PET‐only” PET image and the PET images acquired during MR pulse sequences. MR images of the PET resolution phantom acquired simultaneously while the PET insert was present and collecting data, and also without the PET system inserted, are shown in Fig. 7 for the GRE and FSE pulse sequences, and mean CNR for the images is given in Table 2. Figure 6 (right) plots the CNR of the “no PET” MR images and the MR images acquired with the PET insert in the MRI bore, for both GRE and FSE. EPI resulted in poor‐quality MR images of the resolution phantom due to its small size, both with and without the PET insert present (not shown). A PET/MR fusion image from simultaneous acquisition during the GRE sequence is shown in Fig. 8.
Figure 5.
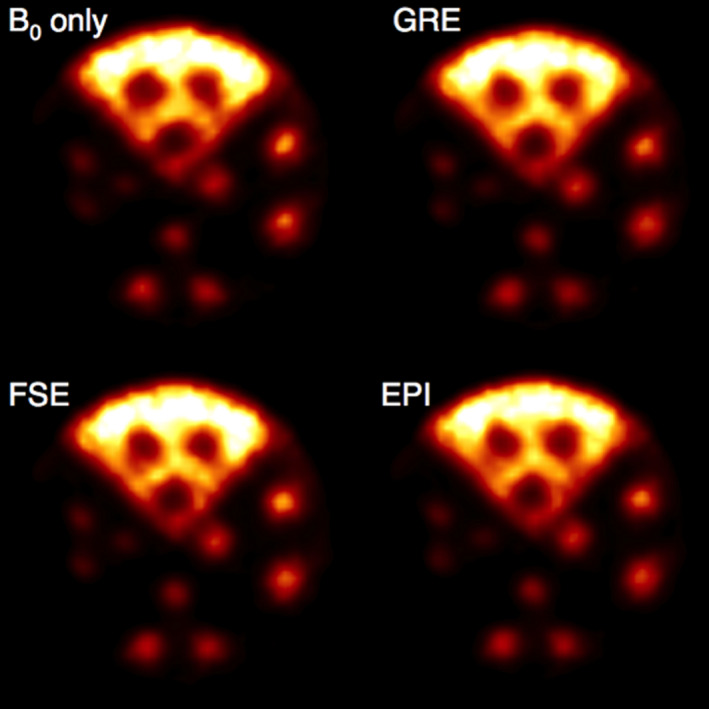
Reconstructed PET images of the resolution phantom under different MRI pulse sequences. [Color figure can be viewed at wileyonlinelibrary.com]
Figure 6.
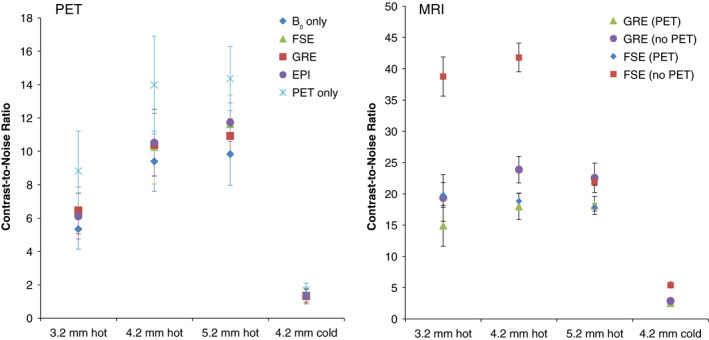
Left: PET image CNR for each rod type in Figs. 4 and 5. Right: MRI image CNR for images acquired without PET insert present in the MRI bore (Fig. 7, bottom), and with the PET insert present (Fig. 7, top), for each rod type. Error bars indicate standard deviation of CNR of the three rods of each type. [Color figure can be viewed at wileyonlinelibrary.com]
Figure 7.
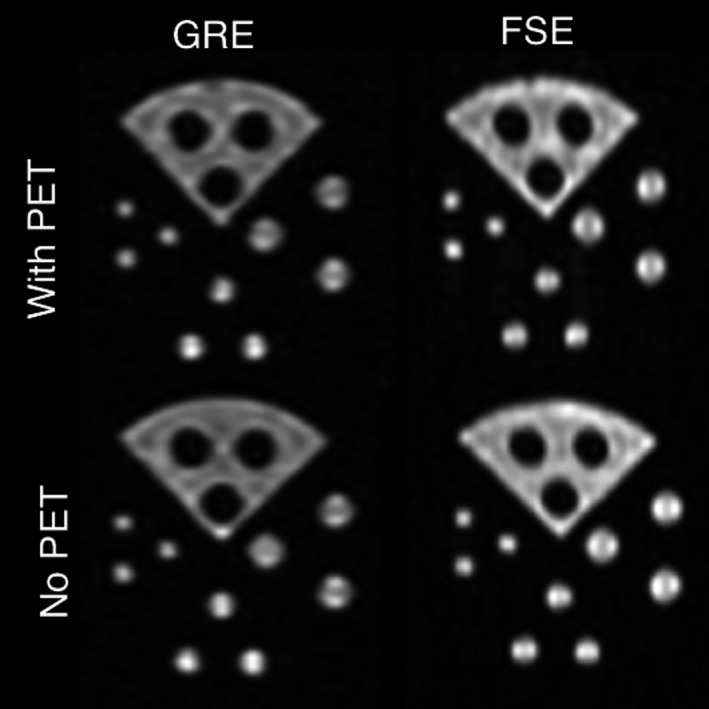
MR images of PET resolution phantom taken during simultaneous PET acquisition with and without the PET ring inserted into the MR system.
Figure 8.

PET/MR image fusion, data acquired simultaneously during GRE sequence. Left: PET image; right: MR image; center: PET/MR fusion. [Color figure can be viewed at wileyonlinelibrary.com]
4. Discussion
4.1. Tomographic imaging
The successful acquisition of phantom images with no significant artifacts in the laboratory benchtop setting (Fig. 4) indicated that the PET insert and data acquisition system are fully operational and were ready for simultaneous PET/MR imaging tests. All features of the resolution phantom are visible in Fig. 4, and the rods of each size are well resolved. The small 3.2‐mm hot rods appear less bright than the larger rods, likely due to the partial volume effect as the rods are approximately the same size as the detector pixels.28 A relatively small transaxial pixel size (0.8 mm) was used in reconstruction so that the small rod features were clearly visible. Using a larger pixel size, the rods would be less clearly delineated, but there would be less image noise.29 Reconstructing with a greater number of iterations can help to make the smaller features more distinct when larger pixels are used, but this approach also increases the image noise,28, 30 unless regularization is employed.31, 32
Normalization using a uniform cylinder with the same dimensions as the resolution phantom has the advantage of inherently including attenuation correction,24 but has the disadvantage of exposing the LORs to unequal amounts of activity. LORs will have a greater exposure the closer they intersect to the center of the phantom, leading to a reconstruction artifact in which the activity is overestimated at the edges of the image. This effect has been mitigated with a radially dependent sensitivity correction factor calculated based on our normalization phantom geometry,33 but alternative normalization phantom geometries are under investigation. Ideally the normalization phantom would be scanned for a very long time, on the order of 10 h, providing greater counts in all LORs to reduce statistical error in the reconstruction.34 In the present case, the relatively short scans were necessary due to the limited availability of MRI scan time, and the current necessity to perform normalization scans in the same environment as the imaging scans due to thermal concerns. Future work on this insert prototype will include stability improvements that will render frequent normalization scans unnecessary. Moving from the current direct normalization approach to a component‐based or self‐normalization approach34, 35 may also alleviate these issues.
4.2. Simultaneous PET/MR imaging
Previous experiments testing mutual interference of the PET and the MR with two to four active detectors in the PET ring indicated that the two systems are compatible with no significant sources of interference.20
Reconstructed PET images acquired with the full ring in the MR system (Fig. 5) all appear qualitatively similar, and the maximum percent CNR relative difference for each rod type among all four PET images acquired in the MRI system has a mean of 14.0 ± 7.7%, demonstrating comparable image quality. Overall, there is no statistically significant difference in the reconstructed PET phantom CNR values among images acquired inside the MRI (Table 2). That the B0 only PET image does not show greater CNR than those of the images acquired during MR pulsing suggests the presence of simultaneous MR pulsing does not have a major effect on PET imaging capability. The cause of the lower values for the B0 hot rod CNR compared to the MR pulsing images is under investigation, and further study is necessary to confirm whether this effect is repeatedly observed.
Figure 6 (left) shows that compared to the PET‐only image (Fig. 4), the PET images acquired in the MRI system (Fig. 5) have a mean CNR that is lower by 25.1 ± 6.4% for all rod types regardless of the type or presence of MR pulsing. This effect is still under investigation, but may be attributable to thermal differences in the laboratory and MRI environments. Due to the nature of the compressed sensing multiplexing, thermal differences that affect the gain of system components such as SiPMs and VCSELs can lead to variation in the calibrated sensing matrix that maps detected events to detector pixels. These results suggest that active system thermal regulation may be essential for obtaining the highest quality images. Future studies will include thermal monitoring to help in determining optimal system temperature, and active regulation is under investigation.
The partial volume effect is again apparent in Table 2 and Fig. 6, in which the 3.2‐mm rods show significantly lower mean CNR values than the other hot rod sizes. For each image, the mean CNR increases as the hot rod size increases. The cold rods show low mean CNR variation among each acquisition. The relatively low cold rod CNR value is partly due to the very high mean value of the hot background region. Inaccuracy in normalization and attenuation correction also contributes to artificially high background values at the outer edge of the phantom, particularly in the end slices of the image, reducing the calculated cold rod contrast. Time‐of‐flight capability would also likely aid in reducing the erroneous signal localized in the cold rods.36
Simultaneous MR images of the resolution phantom acquired through the PET insert (Fig. 7, top for the GRE and FSE sequences) clearly show all features of the PET resolution phantom without significant artifacts. Although a plastic PET resolution phantom material is not ideal for MR imaging, this provides evidence that the PET ring is RF‐penetrable. MR images of the phantom acquired with the PET ring present (Fig. 7, top) generally show lower CNR (Fig. 6, right) than those acquired with no PET insert (Fig. 7, bottom), with mean decreases of 19.5 ± 6.2% and 29.8 ± 27.1% for GRE and FSE, respectively. This is the result of signal power loss from transmitting and receiving RF through the PET ring. The larger CNR decrease with FSE when the PET insert is present is due to signal loss from the reduced flip angle in the train of 12 refocusing pulses. Imaging the resolution phantom with EPI resulted in substantial distortion in the phase encode direction, regardless of whether the PET insert was present in the MRI bore. This distortion is the result of low effective bandwidth of EPI imaging, together with the large susceptibility‐induced off‐resonance in the small plastic phantom.37, 38 As the B0 homogeneity was not affected by the PET insert, single‐shot EPI imaging of humans should not be a concern.39 Additionally, due to the high gradient slew rate used with EPI, ghosting artifacts originating from eddy currents are commonly observed. The continuous metal surfaces of the PET module Faraday shields (Fig. 1, left) exacerbate this effect. Approaches to reducing eddy currents in the PET shielding include segmenting the shield surfaces and constructing the shields from carbon fiber17, 40 and are currently under investigation. Reducing eddy currents could also have the added benefit of reducing the temperature regulation burden in gradient‐heavy pulse sequences that would otherwise induce heating in the detector module shielding.
MR image quality will also be improved using a dedicated RF coil within the PET insert.41 Other PET insert designs to date8, 40 are not RF‐transmissive so they require a dedicated RF transmit/receive coil residing inside the PET ring. However, a dedicated RF receive‐only coil placed within the RF‐penetrable PET ring allows the MR body coil to be used for RF transmit only. This is advantageous because the built‐in body coil has very high transmit uniformity in the center of the FOV. Avoiding a transmit coil inside the PET ring also reduces photon attenuation effects, may allow for a smaller PET ring diameter for higher photon sensitivity, and enables the dedicated receive coil to be a more sensitive receive‐only design, such as a phased array.42 Thus, the combination of the RF‐penetrable PET insert, which allows the use of the built‐in body coil as RF transmitter, and a dedicated RF receive coil located inside the PET insert could therefore lead to MR images of greater quality and accuracy than is possible with other non‐RF‐penetrable PET inserts.
The prototype PET insert demonstrated here is only suitable for brain imaging due to its small inner diameter. The small 40 cm outer diameter enables this system to be inserted in a higher performance narrow bore MR system. A whole body insert using the current approach would require the use of a wide bore MRI. This insert design would decrease the effective MRI bore diameter from 70 cm to about 60 cm, equivalent to that used in a standard body MRI system. A thinner PET ring insert that only occupies 4–5 cm of the MRI bore diameter is under development, which would enable imaging of larger patients.
5. Conclusion
This study has demonstrated that the RF‐penetrable PET insert is capable of acquiring PET and MR images without significant interference or degradation during various types of continuous MR pulsing. It has been shown that this RF‐penetrability allows simultaneous acquisition of MR images by transmitting (and receiving) through the PET ring using only the built‐in body coil. We currently are building a dedicated RF receive coil to reside inside the PET ring for better MR image quality. The RF‐penetrable PET technology that enables using the built‐in body coil as an RF transmitter shows promise for expanding the availability of simultaneous PET/MR imaging capability to any hospital owning an MR system as only the PET insert is needed, and it is not necessary to purchase an integrated PET + MR system.
Conflict of interests
The authors have no relevant conflict of interests to disclose.
Acknowledgments
The authors would like to thank Gary Glover and Ron Watkins from the Stanford Radiological Sciences Laboratory for assistance with hardware and experiments, as well as Bin Shen and George Montoya from the Stanford Radiochemistry Laboratory for providing 18FDG. This work was supported in part by NIH Grant 1R01EB01946501A1.
References
- 1. Sauter AW, Wehrl HF, Kolb A, Judenhofer MS, Pichler BJ. Combined PET/MRI: one step further in multimodality imaging. Trends Mol Med. 2010;16:508–515. [DOI] [PubMed] [Google Scholar]
- 2. Kjær A, Loft A, Law I, et al. PET/MRI in cancer patients: first experiences and vision from Copenhagen. Magn Reson Mater Phy. 2013;26:37–47. [DOI] [PubMed] [Google Scholar]
- 3. Le Bihan D. Looking into the functional architecture of the brain with diffusion MRI. Nat Rev Neurosci. 2003;4:469–480. [DOI] [PubMed] [Google Scholar]
- 4. Catana C, Drzezga A, Heiss WD, Rosen BR. PET/MRI for neurologic applications. J Nucl Med. 2012;53:1916–1925. [DOI] [PMC free article] [PubMed] [Google Scholar]
- 5. Boss A, Bisdas S, Kolb A, et al. Hybrid PET/MRI of intracranial masses: initial experiences and comparison to PET/CT. J Nucl Med. 2010;51:1198–1205. [DOI] [PubMed] [Google Scholar]
- 6. Ratib O, Nkoulou R. Potential applications of PET/MR imaging in cardiology. J Nucl Med. 2014;55:40S–46S. [DOI] [PubMed] [Google Scholar]
- 7. Shao Y, Cherry SR, Farahani K, et al. Development of a PET detector system compatible with MRI/NMR systems. IEEE Trans Nucl Sci. 1997;44:1167–1171. [Google Scholar]
- 8. Hong KJ, Choi Y, Jung JH, et al. A prototype MR insertable brain PET using tileable GAPD arrays. Med Phys. 2013;40:042503. [DOI] [PubMed] [Google Scholar]
- 9. Zaidi H, Ojha N, Morich M, et al. Design and performance evaluation of a whole‐body ingenuity TF PET–MRI system. Phys Med Biol. 2011;56:3091–3106. [DOI] [PMC free article] [PubMed] [Google Scholar]
- 10. Schlemmer HP, Pichler BJ, Schmand M, et al. Simultaneous MR/PET imaging of the human brain: feasibility study. Radiol. 2008;248:1028–1035. [DOI] [PubMed] [Google Scholar]
- 11. Schmand M, Burbar Z, Corbeil J, et al. BrainPET: first human tomograph for simultaneous (functional) PET and MR imaging. J Nucl Med. 2007;48:45P. [Google Scholar]
- 12. González AJ, Majewski S, Sánchez F, et al. The MINDView brain PET detector, feasibility study based on SiPM arrays. Nuc Instr Meth Phys A. 2016;818:82–90. [Google Scholar]
- 13. Nishikido F, Obata T, Shimizu K, et al. Feasibility of a brain‐dedicated PET‐MRI system using four‐layer DOI detectors integrated with an RF head coil. Nuc Instr Meth Phys A. 2014;756:6–13. [Google Scholar]
- 14. Delso G, Ziegler S. PET/MRI system design. Eur J Nucl Med Mol Imaging. 2009;36:S86–92. [DOI] [PubMed] [Google Scholar]
- 15. Delso G, Fürst S, Jakoby B, et al. Performance measurements of the Siemens mMR integrated whole‐body PET/MR scanner. J Nucl Med. 2011;52:1914–1922. [DOI] [PubMed] [Google Scholar]
- 16. Grant AM, Deller TW, Khalighi MM, Maramraju SH, Delso G, Levin CS. NEMA NU 2‐2012 performance studies for the SiPM‐based ToF‐PET component of the GE SIGNA PET/MR system. Med Phys. 2016;43:2334. [DOI] [PubMed] [Google Scholar]
- 17. Peng BJ, Walton JH, Cherry SR, Willig‐Onwuachi J. Studies of the interactions of an MRI system with the shielding in a combined PET/MRI scanner. Phys Med Biol. 2010;55:265–280. [DOI] [PMC free article] [PubMed] [Google Scholar]
- 18. Olcott PD, Chinn G, Levin CS. Compressed sensing for the multiplexing of PET detectors. IEEE NSS/MIC Conf Rec. 2011;3224–3226. [Google Scholar]
- 19. Chang CM, Grant AM, Lee BJ, Kim E, Hong K, Levin CS. Performance characterization of compressed sensing positron emission tomography detectors and data acquisition system. Phys Med Biol. 2015;60:6407–6421. [DOI] [PubMed] [Google Scholar]
- 20. Lee BJ, Grant AM, Chang CM, Glover GH, Levin CS. RF‐transmissive PET detector insert for simultaneous PET/MRI. IEEE NSS/MIC Conf Rec. 2014;1–3. [Google Scholar]
- 21. Olcott PD, Peng H, Levin CS. Novel electro‐optical coupling technique for magnetic resonance–compatible positron emission tomography detectors. Mol Imaging. 2009;8:74–86. [PubMed] [Google Scholar]
- 22. Kim E, Hong KJ, Olcott PD, Levin CS. PET DAQ system for compressed sensing detector modules. IEEE NSS/MIC Conf Rec. 2012;2798–2801. [Google Scholar]
- 23. Bieniosek MF, Lee BJ, Levin CS. 3D printing for cost‐effective, customized, reusable multimodality imaging phantoms. Med Phys. 2015;42:5913–5918. [DOI] [PMC free article] [PubMed] [Google Scholar]
- 24. Sank VJ, Brooks RA, Friauf WS, Leighton SB, Cascio HE, Di Chiro G. Performance evaluation and calibration of the neuro‐PET Scanner. IEEE Trans Nucl Sci. 1983;30:636–639. [Google Scholar]
- 25. Cui JY, Pratx G, Prevrhal S, Levin CS. Fully 3D list‐mode time‐of‐flight PET image reconstruction on GPUs using CUDA. Med Phys. 2011;38:6775–6786. [DOI] [PubMed] [Google Scholar]
- 26. Carson RE, Barker WC, Liow JS, Johnson CA. Design of a motion‐compensation OSEM list‐mode algorithm for resolution‐recovery reconstruction for the HRRT. IEEE NSS Conf Rec. 2003;3281–3285. [Google Scholar]
- 27. Miyaoka RS, Kohlmyer SG, Lewellen TK. Hot sphere detection limits for a dual head coincidence imaging system. IEEE Trans Nucl Sci. 1999;46:2185–2191. [Google Scholar]
- 28. Soret M, Bacharach SL, Buvat I. Partial‐volume effect in PET tumor imaging. J Nucl Med. 2007;48:932–945. [DOI] [PubMed] [Google Scholar]
- 29. Boellaard R, Krak NC, Hoekstra OS, Lammertsma AA. Effects of noise, image resolution, and ROI definition on the accuracy of standard uptake values: a simulation study. J Nucl Med. 2004;45:1519–1527. [PubMed] [Google Scholar]
- 30. Jaskowiak CJ, Bianco JA, Perlman SB, Fine JP. Influence of reconstruction iterations on 18F‐FDG PET/CT standardized uptake values. J Nucl Med. 2005;46:424–438. [PubMed] [Google Scholar]
- 31. Lantos J, Iagaru A, Levin CS. Standard OSEM vs. Q. Clear® PET image reconstruction: an analysis of phantom data. J Nucl Med. 2015;56:264. [PMC free article] [PubMed] [Google Scholar]
- 32. Lantos J, Mittra E, Levin CS, Iagaru A. Standard OSEM vs. regularized PET image reconstruction: qualitative and semi‐quantitative comparison. J Nucl Med. 2015;56:1805. [PMC free article] [PubMed] [Google Scholar]
- 33. Cui JY. Fast and accurate PET image reconstruction on parallel architectures, PhD thesis. Stanford University; 2013. [Google Scholar]
- 34. Defrise M, Townsend DE, Bailey D, Geissbuhler A, Michel C, Jones T. A normalization technique for 3D PET data. Phys Med Biol. 1991;36:939–952. [DOI] [PubMed] [Google Scholar]
- 35. Salomon A, Goldschmidt B, Botnar R, Kiessling F, Schulz V. A self‐normalization reconstruction technique for PET scans using the positron emission data. IEEE Trans. Med Imag. 2012;31:2234–2240. [DOI] [PubMed] [Google Scholar]
- 36. Jakoby BW, Bercier Y, Conti M, Casey ME, Bendriem B, Townsend DW. Physical and clinical performance of the mCT time‐of‐flight PET/CT scanner. Phys Med Biol. 2011;56:2375–2389. [DOI] [PubMed] [Google Scholar]
- 37. Thomas IM, Ma YP, Tan S, Wikswo JP. Spatial resolution and sensitivity of magnetic susceptibility imaging. IEEE Trans Appl Supercond. 1993;3:1937–1940. [Google Scholar]
- 38. Jezzard P, Balaban RS. Correction for eometric distortion in echo planar images from B0 field variations. Magnet Reson Med. 1995;34:65–73. [DOI] [PubMed] [Google Scholar]
- 39. Olcott PD, Kim E, Hong KJ, et al. Prototype positron emission tomography insert with electro‐optical signal transmission for simultaneous operation with MRI. Phys Med Biol. 2015;60:3459–3478. [DOI] [PubMed] [Google Scholar]
- 40. Wehner J, Weissler B, Dueppenbecker P, et al. PET/MRI insert using digital SiPMs: investigation of MR‐compatibility. Nuc Instr Meth Phys A. 2014;734:116–121. [DOI] [PMC free article] [PubMed] [Google Scholar]
- 41. Lee BJ, Grant AM, Chang CM, Watkins R, Levin CS. MR performance evaluation of an RF‐penetrable PET insert with integrated RF receive coil for simultaneous PET/MRI. J Nucl Med. 2015;6:1854. [Google Scholar]
- 42. Roemer PB, Edelstein WA, Hayes CE, Souza SP, Mueller OM. The NMR phased array. Magn Reson Med. 1990;16:192–225. [DOI] [PubMed] [Google Scholar]


