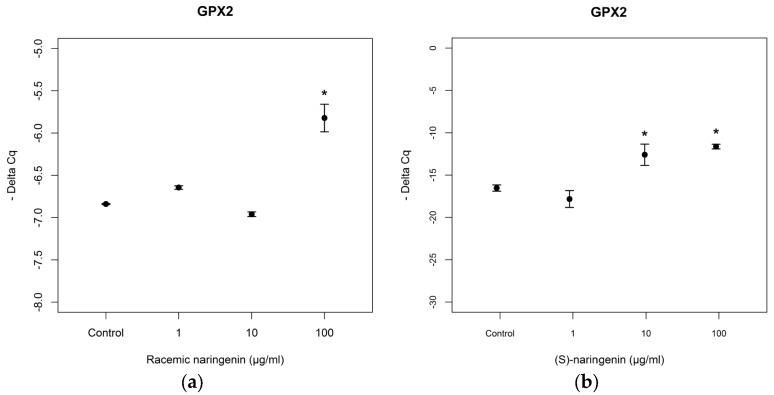
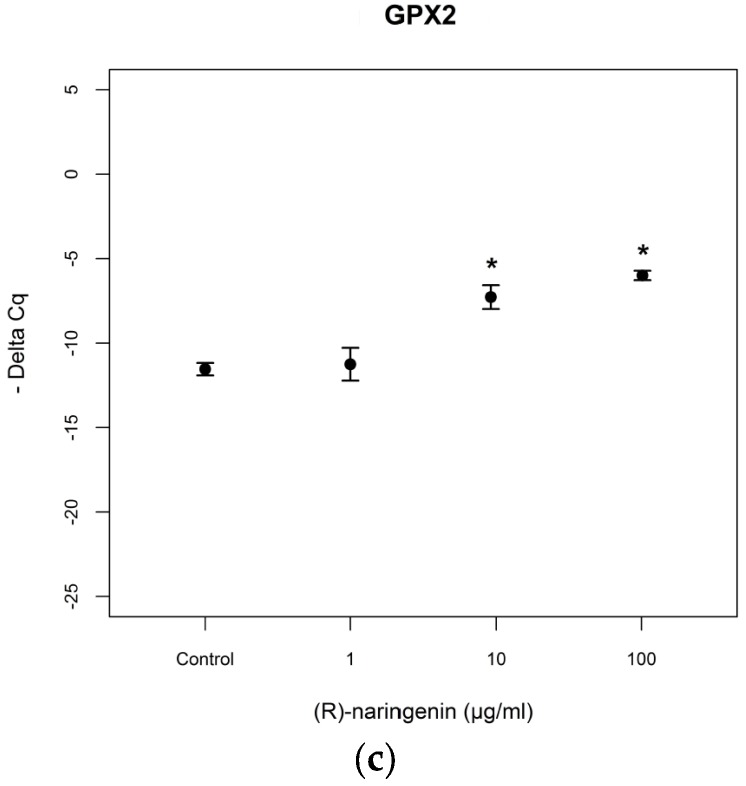
Figure 4.
Expression levels, reported as Delta Cq, of mRNA coding for GPx2 in Caco-2 cells treated with increasing concentrations of (a) racemic naringin, (b) (S), and (c) (R) naringenin enantiomers (1–100 µg/mL). * Indicates statistically significant differences between treated and untreated cell cultures, as reported in the text.


