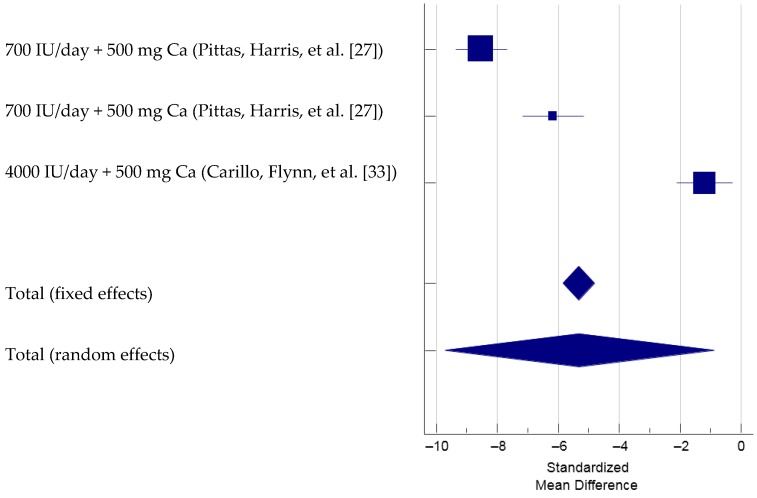
Figure 6.
Forest plot showing Standardized Mean Difference of PTH with vitamin D and calcium supplementation. Note: Pittas et al., 2007 study included two separate study groups, once with impaired fasting glucose and another with normal fasting glucose [27].

