Abstract
How does cortical tissue change as brain function and behavior improve from childhood to adulthood? By combining quantitative and functional magnetic resonance imaging in children and adults, we find differential development of high-level visual areas that are involved in face and place recognition. Development of face-selective regions, but not place-selective regions, is dominated by microstructural proliferation. This tissue development is correlated with specific increases in functional selectivity to faces, as well as improvements in face recognition, and ultimately leads to differentiated tissue properties between face-and place-selective regions in adulthood, which we validate with postmortem cytoarchitectonic measurements. These data suggest a new model by which emergent brain function and behavior result from cortical tissue proliferation rather than from pruning exclusively.
The ability to recognize faces, which is critical for everyday social interactions, improves from childhood to adulthood. This improvement depends on functional development of face-selective regions in the fusiform gyrus (1–3). Understanding how anatomical changes co-occur with cortical functional development has implications for understanding normative and atypical development. However, if and how the cortical tissue of high-level visual cortex changes across development and the functional significance of these changes remain unknown. Because the fusiform gyrus is a hominoid-specific structure, this question can only be answered by obtaining measurements of structure, function, and behavior in awake, behaving humans.
Recent advances in quantitative magnetic resonance imaging (qMRI) (4, 5) enabled us to quantify and compare between individuals the amount of brain tissue within a voxel (the region of a tissue slice that corresponds to a pixel in the MRI image), referred to as the macromolecular and lipid tissue volume (MTV), as well as the composition of the tissue, such as the lipid and cholesterol content of cell walls and myelin, as measured by proton relaxation time (T1). These measurements can disambiguate developmental hypotheses (fig. S1) to test if, during childhood, macromolecular tissue (i) is pruned (6), predicting lower MTV and longer T1 in adults than children; (ii) proliferates (7), predicting higher MTV and shorter T1 in adults than children; or (iii) remains stable.
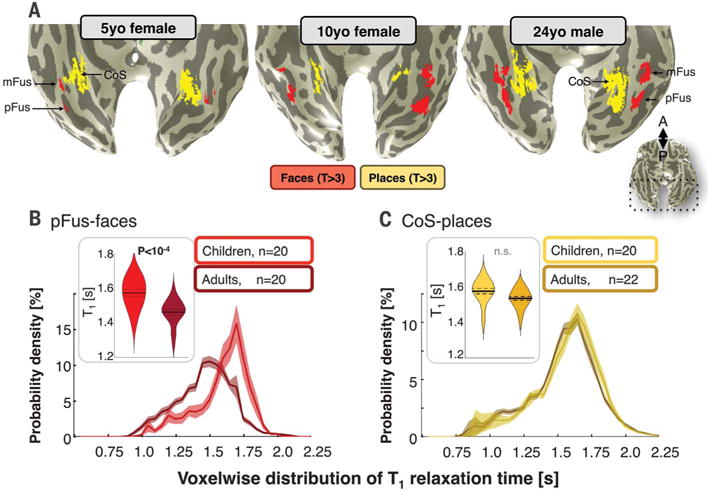
In 22 children (between 5 and 12 years of age) and 25 adults (between 22 and 28 years of age), we combined measurements of functional MRI (fMRI; 2.4 mm isotropic voxels, repetition time (TR) = 1 s, multiplex factor = 3), qMRI (1 mm isotropic voxels; four spoiled gradient echo scans using flip angles of 4°, 10°, 20°, and 30°), and visual recognition memory (supplementary materials and methods). Using fMRI, we identified functional regions of interest (fROIs) in each subject’s ventral temporal cortex (VTC) selective for faces in the posterior and mid fusiform gyrus (pFus-and mFus-faces, respectively) and for places in the collateral sulcus (CoS-places) (Fig. 1A). Using qMRI, we obtained maps of T1 and MTV in each individual. Subsequent analyses focused on T1 because it is sensitive to both MTV (higher MTV quickens proton lattice exchange, lowering T1; fig. S2) and tissue composition (for example, membranes that contain cholesterol impact T1 more than membranes that do not).
Fig. 1. Differential tissue development of face-and place-selective regions.

(A) Face-and place-selective regions indicated in red and yellow, respectively, in representative child and adult participants on inflated cortical surfaces zoomed on ventral temporal cortex. (B) Right pFus-faces T1 relaxation times in children and adults. Violin plot shows average T1 across participants, where width indicates subject density, solid line indicates group mean, and dotted lines indicate standard error. Graph shows average distribution of T1 relaxation time across voxels, where solid line indicates mean and shaded region indicates standard error across participants. (C) Same as (B) for CoS-places.
The T1 of face-and place-selective regions in the right hemisphere demonstrated differential development of cortical tissue. Mean T1 in pFus-faces, but not CoS-places [t40 = 2.2, not significant (n.s.), Bonferroni corrected], was significantly lower in adults than in children (t38 = 4.34, P < 10−4, Bonferroni corrected; Fig. 1, B and C). Results were replicated in a control analysis in which fROI size was matched across children and adults (t38 = 4.24, P < 0.001). A three-way analysis of variance (ANOVA) of mean T1 with factors of age group, fROI, and hemisphere revealed a significant age group-by-fROI interaction (F1,163 = 9.71, P < 0.005), as well as significant main effects of age group and hemisphere (Fs > 9.86, Ps < 0.005, where Fs and Ps indicate F and P values from multiple statistical tests). Likewise, the voxelwise distribution of T1 across right pFus-faces was lower in adults compared to children (Fig. 1B), but there was no development of the voxelwise T1 distribution in CoS-places bilaterally (Fig. 1C and fig. S4A). Mean and voxelwise distributions of T1 in left pFus-faces (fig. S4A) and mFus-faces (fig. S5A) were also lower in adults, but developmental effects were smaller. MTV also showed differential developmental trends, numerically increasing in pFus-faces and remaining stable in CoS-places (fig. S3, A and D). Critically, T1 development was not correlated with cortical curvature (fig. S6) or cortical thickness across age group or fROIs (fig. S7).
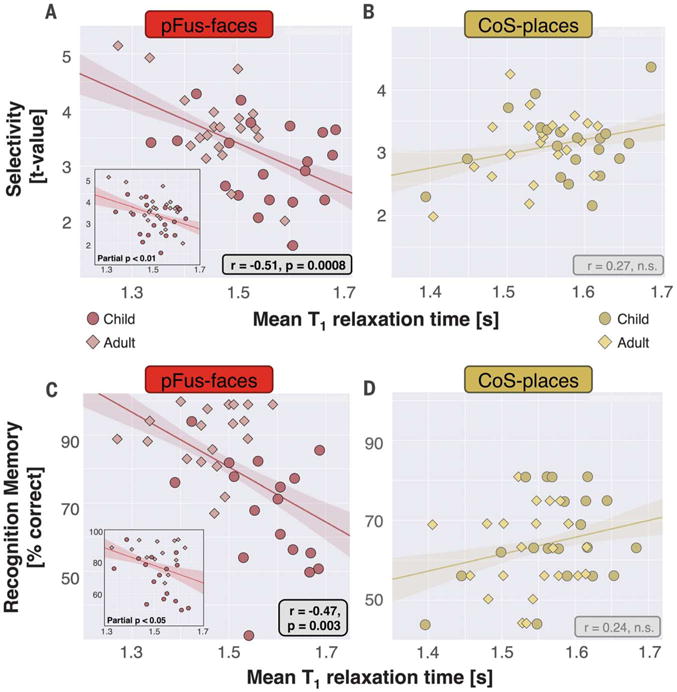
We next tested if functional selectivity in pFus-faces and CoS-places was related to T1 (supplementary materials and methods). In right pFus-faces, mean face selectivity was significantly and negatively correlated with mean T1 (r40 = −0.51, where r is the correlation coefficient; P < 0.001; Bonferroni corrected; Fig. 2A). This relationship was replicated in a control analysis in which fROI size was matched across children and adults (r40 = −0.5, P < 0.001). After regressing out participants’ ages, the relationship between functional selectivity and T1 remained significant at P = 0.01 (Fig. 2A, inset). The correlation between functional selectivity and T1 in pFus-faces was category specific, as mean selectivity for the nonpreferred category of places in right pFus-faces was not correlated with mean T1 (r40 = −0.0), n.s.). In right CoS-places, where we observed no developmental change in T1, there was no significant correlation between place selectivity and T1 (r42 = −0.27, n.s.; Fig. 2B). Additionally, there were no significant correlations between selectivity for the preferred category and T1 in left CoS-places, left pFus-faces, and mFus-faces bilaterally (figs. S4B and S5B). Correlations between selectivity and MTV were also not significant (fig. S3, B and E).
Fig. 2. T1 relaxation times in face-selective, but not place-selective, cortex negatively correlate with both functional selectivity and recognition memory.

(A) Correlation (line and 68% confidence interval from bootstrapping) between mean functional selectivity to faces versus mean T1 in right pFus-faces. (A, inset) Correlation with age partialled out (residual-adjusted T1 versus selectivity). (B) Mean selectivity for places versus T1 in right CoS-places. (C) Recognition memory of faces versus mean T1 in right pFus-faces. (C, inset) Correlation with age partialled out. (D) Recognition memory for places versus mean T1 in right CoS-places. In all plots, each point is a subject.
We also tested if face and place recognition memory were correlated with T1 or functional selectivity in particular fROIs (supplementary materials and methods). Face recognition memory was significantly and negatively correlated with T1 in right pFus-faces (r36 = −0.47, P = 0.003, Bonferroni corrected; Fig. 2C). This relationship remained significant when controlling for floor and ceiling performance (r29 = −0.61, P < 0.0005) and when additionally regressing out subject age (P < 0.05; Fig. 2C, inset). This correlation was category-specific; place recognition memory was not significantly correlated with T1 of pFus-faces (r37 = 0.18, n.s.). Further, the correlation between face recognition and T1 of pFus-faces was significantly different from the correlation between place recognition and T1 of CoS-places (Fisher difference, P = 0.003). Other face-selective fROIs on the mid fusiform and in the left hemisphere showed similar relationships to behavior, but were not significant after Bonferroni correction (figs. S3C, S4C, and S5C).
This correlation between recognition memory and tissue properties was unique to face-selective cortex, as T1 in CoS-places was not significantly correlated with either place (r42 = 0.24, n.s.; Fig. 2D) or face recognition (r41 = −0.32, n.s.). Additionally, T1 in character-selective regions that abut face-selective regions decreased from childhood to adulthood (ts > 2.38, where ts indicates t values from multiple t-tests; Ps < 0.02; fig. S8), with stronger development in the left hemisphere (supplementary materials and methods). However, this development was not significantly correlated with face recognition (r35 = −0.33, n.s.; fig. S8A).
We tested if face selectivity in pFus-faces could also account for face recognition memory. Face recognition was significantly positively correlated with face selectivity in right pFus-faces (r36 = 0.45, P = 0.006), but it was not significant when age was partialled out (P = 0.11). A multivariate regression relating recognition to both selectivity and T1 in pFus-faces revealed only a 1.1% increase in explained variance when selectivity was added with T1.
The developmental decrease of T1 in face-selective cortex suggests a mechanism of microstructural proliferation. The question remains as to what tissue changes underlie the observed T1 changes. We hypothesized that T1 development is associated with changes to multiple tissue compartments, including increases in cell bodies, dendritic structures, and myelin sheath. Although we could not measure them directly in vivo, we assessed the contribution of different tissue compartments to empirical observations by comparing qMRI measurements to cytoarchitecture in cell body-stained sections of postmortem brains and to simulations of increases in myelination.
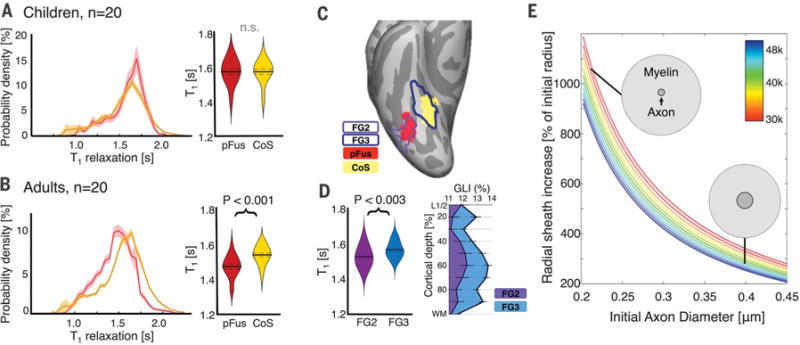
Our in vivo data indicated that in children, pFus-faces and CoS-places had nondifferentiated T1 properties (Fig. 3A), but in adults, pFus-faces had lower T1 than CoS-places (Fig. 3B). Thus, we reasoned that if development leads to anatomical differences between pFus-faces and CoS-places, then these differences should be observable in ex vivo histological measurements of adult VTC (8,9). Notably, pFus-faces and CoS-places are cyto-architectonically dissociable, where the former is largely confined to fusiform gyrus cytoarchitectonic area FG2 and the latter to FG3 (10). Using cortex-based alignment (11), we generated maximum probability maps (MPMs) of fROIs from 20 living adults and cytoarchitectonic regions of interest (cROIs) from 10 postmortem adults and compared them on the FreeSurfer average brain (supplementary materials and methods). Mirroring previous work (10), pFus-faces was largely within FG2, and CoS-places was largely within FG3 (Fig. 3C). Extracting T1 measurements of living adults from the regions corresponding to the MPM of FG2 and FG3 showed significantly lower T1 in FG2 compared to FG3 (Fig. 3D).
Fig. 3. Assessment of development of different tissue compartments.

(A) Graph shows voxelwise distributions of T1 in pFus-faces (red) and CoS-places (yellow) in 20 children, where solid line indicates mean and shaded region indicates standard error across participants. Violin plot shows mean T1 of right pFus-faces and CoS-places in these children, where width indicates subject density, solid line indicates group mean, and dotted lines indicate standard error. (B) Same as (A) for 20 adults. (C) Maximum probability maps (MPMs) of pFus-faces and CoS-places (20 adults) and MPMs of cytoarchitectonic areas FG2 and FG3 (10 postmortem adults) on the Freesurfer average brain. (D) Left, mean T1 from the MPMs of FG2 and FG3 in 20 adults. Notation is the same as in (A). Right, mean GLI profiles of FG2 (purple) and FG3 (blue) in 10 postmortem adults. (E) Simulations of myelin sheath volume increase in a cubic millimeter of cortex to account for development of MTV in pFus-faces if myelin was the sole factor. The x axis shows axon diameter, colored lines indicate number of axons in a cubic millimeter (see colorbar), example axons, dark gray circles show initial fiber diameter, and light gray shading shows simulated fiber diameter after development.
We compared these T1 measurements from MPMs of FG2 and FG3 to the volume fraction of cell bodies across cortical layers of areas FG2 and FG3 measured by the mean gray level index (GLI) (8, 9) from 20-μm histological sections (supplementary materials and methods). The mean GLI of FG3 was 12.73 ± 1.29, which was significantly larger (pairwise t test, P < 0.05) than the mean GLI of FG2 (11.65 ± 1.83, Fig. 3D). A smaller GLI in FG2 corresponded to a larger amount of neuropil, which is the space surrounding the cell bodies that contains synapses, dendrites, axons with or without myelin, and glial and astrocytic processes. Assuming all other conditions were the same, more abundant neuropil in FG2 would manifest as lower T1 in qMRI.
One neuropil compartment that may develop is myelin. Increased myelination of axons in deep cortical layers could push the white-gray matter boundary into cortex, predicting thinner FG2-pFus-faces than FG3-CoS-places in adulthood. Contrary to this prediction, both postmortem and in vivo FG2 and pFus-faces tended to be thicker than FG3 and CoS-places (fig. S7, G and H). Cortical thickness estimates were the same for cell body and myelin staining of FG2, suggesting that deep cortical layers were likely not misclassified as white matter in MRI (fig. S7, A and B). Although FG2 and FG3 were similarly myelinated in postmortem adults (fig. S7, C to F), myelin could increase within the cortex across development. Since myelin volume linearly contributes to MTV and mean MTV in pFus-faces voxels increased by 12.6% from childhood to adulthood, we simulated the amount by which the volume of the myelin sheath would need to increase in order to account for these observations (supplementary materials and methods). Simulations using various ranges of axonal radii and percentages of axons myelinated showed that the radius of the myelin sheath would need to increase 2-to 10-fold to account for the development of MTV in pFus-faces (Fig. 3E). We believe that such an increase is anatomically infeasible because it would result in fibers that are composed largely of myelin sheath.
Together, the histological measurements and the simulations suggest that development of T1 in pFus-faces may be driven by microstructural proliferation in a combination of cortical compartments. One such compartment may be dendrites. Our data are consistent with research in monkey inferotemporal cortex, which is the proposed homolog of human VTC, where anatomical development is characterized by a prolific generation of dendritic spines and a doubling in size of dendritic arbors (7). The growth of dendritic arbors may impact the spatial extent from which pyramidal neurons pool information (13, 14) and the spatial extent of lateral inhibition (12), both of which could enhance functional selectivity. Another source of tissue development may be developmental increases in oligodendrocytes and myelination (15–17), which are thought to depend on neural function (18). Although myelination is a likely source of T1 change, simulation results suggest that it is likely not the only source. Other contributions to T1 development may arise from changes in perineuronal iron-protein matrices (19) or glial and astrocytic structural changes observed during learning in adults (20).
Overall, these data suggest a rethinking of the anatomical development of cortex throughout childhood. First, we found a differential development of VTC; some regions showed profound changes, while others remained stable. Second, we found evidence for microstructural proliferation in the fusiform gyrus during childhood, which implicates a different mechanism than the pruning that occurs during infant development (6). These findings suggest that improvements in behavior are a product of an interplay between structural and functional changes in cortex.
Supplementary Material
Acknowledgments
This research was funded by the NSF Graduate Research Development Program, (grant DGE-114747), the NIH (grants 1R01EY02231801A1, 1R01EY02391501A1, and 5T32EY020485), the European Union Seventh Framework Programme (FP7, 2007-2013; grant 604102), and the National Alliance for Research on Schizophrenia and Depression (NARSAD) Young Investigator Grant from the Brain and Behavior Research Foundation. We thank S. Bludau for performing the GLI analysis. Data are archived on the Neurobiological Image Management System (NIMS) at Stanford University. Analysis code available upon request at https://github.com/VPNL. A.M. and Stanford University hold a patent for the qMRI technology described in this work.
Footnotes
SUPPLEMENTARY MATERIALS
www.sciencemag.org/content/355/6320/68/suppl/DC1
Materials and Methods
References (21–40)
REFERENCES AND NOTES
- 1.Golarai G, et al. Nat Neurosci. 2007;10:512–522. doi: 10.1038/nn1865. [DOI] [PMC free article] [PubMed] [Google Scholar]
- 2.Scherf KS, Behrmann M, Humphreys K, Luna B. Dev Sci. 2007;10:F15–F30. doi: 10.1111/j.1467-7687.2007.00595.x. [DOI] [PubMed] [Google Scholar]
- 3.Cantlon JF, Pinel P, Dehaene S, Pelphrey KA. Cereb Cortex. 2011;21:191–199. doi: 10.1093/cercor/bhq078. [DOI] [PMC free article] [PubMed] [Google Scholar]
- 4.Mezer A, et al. Nat Med. 2013;19:1667–1672. doi: 10.1038/nm.3390. [DOI] [PMC free article] [PubMed] [Google Scholar]
- 5.Lutti A, Dick F, Sereno MI, Weiskopf N. Neuroimage. 2014;93:176–188. doi: 10.1016/j.neuroimage.2013.06.005. [DOI] [PubMed] [Google Scholar]
- 6.Rakic P, Bourgeois JP, Eckenhoff MF, Zecevic N, Goldman-Rakic PS. Science. 1986;232:232–235. doi: 10.1126/science.3952506. [DOI] [PubMed] [Google Scholar]
- 7.Elston GN, Fujita I. Front Neuroanat. 2014;8:78. doi: 10.3389/fnana.2014.00078. [DOI] [PMC free article] [PubMed] [Google Scholar]
- 8.Caspers J, et al. Brain Struct Funct. 2013;218:511–526. doi: 10.1007/s00429-012-0411-8. [DOI] [PMC free article] [PubMed] [Google Scholar]
- 9.Lorenz S, et al. Cereb Cortex. 2015:1–13. [Google Scholar]
- 10.Weiner KS, et al. Cereb Cortex. 2016 doi: 10.1093/cercor/bhw361. [DOI] [Google Scholar]
- 11.Fischl B, Sereno MI, Dale AM. Neuroimage. 1999;9:195–207. doi: 10.1006/nimg.1998.0396. [DOI] [PubMed] [Google Scholar]
- 12.Olsen SR, Wilson RI. Nature. 2008;452:956–960. doi: 10.1038/nature06864. [DOI] [PMC free article] [PubMed] [Google Scholar]
- 13.Ryglewski S, et al. Proc Natl Acad Sci USA. 2014;111:18049–18054. doi: 10.1073/pnas.1416247111. [DOI] [PMC free article] [PubMed] [Google Scholar]
- 14.Wilson DE, Whitney DE, Scholl B, Fitzpatrick D. Nat Neurosci. 2016;19:1003–1009. doi: 10.1038/nn.4323. [DOI] [PMC free article] [PubMed] [Google Scholar]
- 15.Yeatman JD, Wandell BA, Mezer AA. Nat Commun. 2014;5:4932. doi: 10.1038/ncomms5932. [DOI] [PMC free article] [PubMed] [Google Scholar]
- 16.Lebel C, Beaulieu C. J Neurosci. 2011;31:10937–10947. doi: 10.1523/JNEUROSCI.5302-10.2011. [DOI] [PMC free article] [PubMed] [Google Scholar]
- 17.Baumann N, Pham-Dinh D. Physiol Rev. 2001;81:871–927. doi: 10.1152/physrev.2001.81.2.871. [DOI] [PubMed] [Google Scholar]
- 18.Barres BA, Raff MC. Nature. 1993;361:258–260. doi: 10.1038/361258a0. [DOI] [PubMed] [Google Scholar]
- 19.Stuber C, et al. Neuroimage. 2014;93:95–106. doi: 10.1016/j.neuroimage.2014.02.026. [DOI] [PubMed] [Google Scholar]
- 20.Sagi Y, et al. Neuron. 2012;73:1195–1203. doi: 10.1016/j.neuron.2012.01.025. [DOI] [PubMed] [Google Scholar]
Associated Data
This section collects any data citations, data availability statements, or supplementary materials included in this article.


