

Abstract
MicroRNAs (miRNA) play important roles in tumorigenesis. Genetic variations in miRNA processing genes and miRNA binding sites may affect the biogenesis of miRNA and the regulatory effect of miRNAs to their target genes, hence promoting tumorigenesis. This study analyzed 226 single nucleotide polymorphisms (SNP) in miRNA processing genes and miRNA binding sites in 339 ovarian cancer cases and 349 healthy controls to assess association with cancer risk, overall survival, and treatment response. Thirteen polymorphisms were found to have significant association with risk. The most significant were 2 linked SNPs (r2 = 0.99), rs2740351 and rs7813 in GEMIN4 [odds ratio (OR) = 0.71; 95% confidence interval (CI), 0.57–0.87 and OR = 0.71; 95% CI, 0.57–0.88, respectively]. Unfavorable genotype analysis showed the cumulative effect of these 13 SNPs on risk (P for trend < 0.0001). Potential higher order gene–gene interactions were identified, which categorized patients into different risk groups according to their genotypic signatures. In the clinical outcome study, 24 SNPs exhibited significant association with overall survival and 17 SNPs with treatment response. Notably, patients carrying a rare homozygous genotype of rs1425486 in PDGFC had poorer overall survival [hazard ratio (HR) = 2.69; 95% CI, 1.67–4.33] and worse treatment response (OR = 3.38; 95% CI, 1.39–8.19), compared to carriers of common homozygous and heterozygous genotypes. Unfavorable genotype analyses also showed a strong gene-dosage effect with decreased survival and increased risk of treatment nonresponse in patients with greater number of unfavorable genotypes (P for trend < 0.0001). Taken together, miRNA-related genetic polymorphisms may impact ovarian cancer predisposition and clinical outcome both individually and jointly.
Introduction
Ovarian cancer is the fifth leading cause of cancer deaths in women in the United States. Approximately, 21,000 new cases and 15,000 new deaths are expected each year (1). Greater than 80% of patients at the time of diagnosis were of advanced stage with the majority surviving less than 5 years. The relatively high mortality and little progress in improving survival rates within the past few decades call for better methods of treatment, diagnosis, and prevention. Known risk factors for ovarian cancer include family or personal history of cancer (breast or ovarian), age over 55, never pregnant, and history of hormone replacement therapy. Linkage to family history suggests that there is a genetic component to ovarian cancer predisposition. Indeed, known hereditary risk factors include BRCA1/BRCA2 mutations (2) and also mutations in mismatch repair genes such as hMLH1, hMSH2, hMSH6, PMS1 and PMS2 (3). However, the influence of common genetic polymorphisms on ovarian cancer risk has not been well studied.
MicroRNAs (miRNA) are a class of small, noncoding RNA molecules ~22 nucleotide in length. They regulate gene expression by targeting mRNA transcripts for degradation or translational repression. It is estimated that one third of the human mRNA transcripts might be miRNA targets (4). The involvement of miRNAs in cancer has been firmly established. The expression of many miRNA genes is deregulated in various types of human cancer. Dysregulation of miRNA transcription, copy numbers, biogenesis, or processing pathways has been shown to contribute to tumorigenesis in humans and animal models (5-7). Genetic variants of the miRNA have been suggested to modify the risk of several cancers such as bladder, esophageal, and renal cancer (8-10).
MiRNAs are synthesized as large pre-miRNA transcripts by RNA polymerase II in the nucleus and then processed by the RNase III enzyme Drosha and its cofactor DCRG8 (Pasha) to release the 70-nt pre-miRNAs, which are exported out of the nucleus by a protein complex containing Exportin 5 (11). Once in the cytoplasm, pre-miRNA precursors are further processed by the RNase III Dicer to form the 22-nt miRNA duplex. Because each miRNA might regulate as many as 200 genes, identifying the risk factors associated with miRNA genes might uncover novel pathways and mechanisms of pathogenesis. We hypothesized that polymorphisms of miRNA-related genes might modulate ovarian cancer risk. In this report, we investigated 238 SNPs from 8 miRNA processing genes and 134 genes containing potential miRNA binding sites for ovarian cancer predisposition and association with clinical outcome and treatment response. To our knowledge, this is the first large-scale investigation of the association between miRNA pathway polymorphisms and ovarian cancer risk and clinical outcome.
MATERIALS AND METHODS
Study population
The subjects recruited for this study were enrolled from August 1991 to January 2009. For cases, newly diagnosed and histologically confirmed ovarian cancer patients were recruited at The University of Texas MD Anderson Cancer Center in Houston. Controls were healthy individuals without prior history of cancer (except nonmelanoma skin cancer) and recruited in parallel with the cases from a large pool of individuals seeing a physician for routine health checkups or addressing health concerns at the Kelsey–Seybold Clinic, a large private multispecialty physician group in the Houston metropolitan area, which consists of 20 clinics and more than 300 physicians. There was no restriction on recruitment criteria for age, ethnicity, or clinical stage. Both cases and controls were prospectively recruited and matched by age (±5 years), gender, and ethnicity. To minimize population admixture, only non-Hispanic Caucasian individuals were included in the analysis. Demographic and epidemiology information, including age, gender, ethnicity, smoking status and history, height, weight, and body mass index were collected for all subjects.
SNP selection and genotyping
Details of the SNP selection and genotyping have been described previously (12). In brief, we have generated a customized panel of cancer-related genes involved in major cellular signaling pathways, including those in the miRNA biogenesis pathway, using Illumina’s iSelect platform. Priority score was assigned to each gene on the basis of query of Gene Ontology (http://www.geneontology.org/), a comprehensive database of gene annotation and literature review. For genes with high priority scores, database mining of dbSNP (http://www.ncbi.nlm.nih.gov/projects/SNP/), International HapMap Project (http://www.hapmap.org/), and miRBase registry (http://microrna.sanger.ac.uk/sequences/) identified potential functional and tagging SNPs in the miRNA biogenesis pathway. Functional SNPs were defined as those located in the coding regions and regulatory regions (promoter, splicing site, 5’-UTR, and 3’-UTR). SNPs containing potential miRNA binding site were interrogated using PolymiRTS database (http://compbio.uthsc.edu/miRSNP/). LDSelect program (http://droog.gs.washington.edu/ldSelect.html) was used to separate SNPs into bins on the basis of linkage disequilibrium. Selected tagging SNPs have an r2 threshold of 0.8, minor allele frequency (MAF) greater than 0.01 in Caucasian population and are located within 10 kb upstream of transcriptional start site and 10 kb downstream of transcriptional end site. A complete set of SNPs was sent to Illumina technical support for custom iSelect, Infinium II BeadChip design using a proprietary program developed by Illumina. Genomic DNA was extracted from peripheral blood lymphocytes using QIAmp DNA extraction kit (Qiagen) and genotyped according to the standard protocol provided by Illumina. Genotypes were autocalled using the BeadStudio software.
Luciferase reporter assay to determine effect of miRNA binding on PDGFC expression
A reporter construct derived from pGL3 (Ambion) containing the entire 3’UTR region of PDGFC was generated as follows. A 1.7-kb fragment of PDGFC 3’ UTR was amplified from genomic DNA using the following primer sequences: forward Pr1 5’-TCACTCACCGACGTGGCCCT; reverse Pr1 5’-AGGCAGAGAAGGCTCACAGGT. Subsequently, nested PCR was performed using the cloning primers: forward Pr2 5’- GAATCTAGACCGCATCACCACCAGCAG; reverse Pr2 5’-GAAGGCCGGCCAAAATAGCCACATTCT. The amplified product was digested with XbaI and FseI restriction enzymes (New England Biolabs) and subcloned into similarly digested pGL3 vector 3’ to the luciferase gene. Reporter construct containing the variant PDGFC allele was constructed through site-directed mutagenesis using the QuikChange protocol (Stratagene). OVCAR3 ovarian cancer cell line (kindly provided by Dr. Mien-Chie Hung of MD Anderson Cancer Center in June 2010) was cultured in DMEM F12 with 10% fetal bovine serum (Invitrogen). Cells were devoid of Mycoplasma contamination and characterized by short tandem repeat DNA fingerprinting by the Characterized Cell Line Core facility at MD Anderson in August 2010. The cell line was a match with known STR profile for OVCAR3 at all loci tested. OVCAR3 cells were cultured in 48-well tissue culture plates and transfected with 0.5 μg of wild-type or variant PDGFC reporter construct along with 5 pmol of negative control (scrambled sequence) or miR-425 RNA (Sigma-Aldrich) and 8 ng of pGL4 (Ambion) Renilla luciferase reporter using Lipofectamine 2000 (Invitrogen) for 36 hours. Reporter expression was analyzed using the Dual-Luciferase Reporter Assay System (Promega) and measured in a FLUOstar Optima microplate reader (BMG Labtech). Each assay was carried out in 4 replicates.
Statistical analysis
Differences in patient characteristics and SNP genotypes were assessed by Pearson χ2 or Fisher’s exact tests. Student’s t test was used for continuous variables to examine the differences between cases and controls. Among the control subjects, the χ2 test for Hardy–Weinberg equilibrium was applied to each SNP. Odds ratio (OR) and 95% confidence interval (CI) were estimated by unconditional multivariate logistic regression while adjusting for age. The most significant test among the 3 genetic models (dominant, recessive, and additive) was used to determine the statistical significance of each SNP. Haplotypes for each individual were inferred using the HelixTree software (v6.4.3, Golden Helix) and were included in the analysis when the probabilities of certainty were at least 95%. Classification and regression tree (CART) analysis by HelixTree software (v6.4.3, Golden Helix) was used to explore higher order gene–gene interactions and classify subjects into distinct risk groups. Kaplan–Meier plots and log-rank test were applied to assess differences in overall survival by genotypes from each SNP, which was calculated from the start date of treatment to the date of death or the end of patient follow-up. Hazard ratios (HR) for overall survival were estimated by applying the Cox proportional hazards model while adjusting for age, clinical stage, histology, and treatment regimen. For response to chemotherapy, unconditional multivariate logistic regression analysis was performed while adjusting for age, clinical stage, histology, and treatment regimen. Treatment response was defined by whether there was evidence of residual disease as indicated by various clinical measures, such as positron emission tomography (PET) and computed tomography (CT) scans, second-look surgery, and postchemo CA-125 level. In addition, patients who died during the follow-up period were considered poor responders. For those SNPs in linkage disequilibrium, we chose the SNP with the smallest P value to be included in the model. Cumulative effects of multiple variants were analyzed by counting the number of unfavorable genotypes identified from the main effects analysis of single SNPs (P < 0.05). The unfavorable genotypes were collapsed into 3 groups (low-, medium-, and high-risk) according to the tertile distribution of the number of unfavorable genotypes. The reference group was that with the lowest risk. STATA software (version 10, STATA Corporation) was used for the above analyses. To control for multiple testing, q value [a false discovery rate (FDR)-adjusted P value] was calculated for each SNP implemented in the R-package. All P values reported were 2-sided.
RESULTS
Subject characteristics
A total of 417 case subjects and 417 controls were recruited, of which 339 cases (81.3%) and 349 controls (83.7%) were Caucasians (Supplementary Table S1). The mean age for cases and controls was 60.7 and 60.3 years, respectively. No significant differences were observed between cases and controls for age (P = 0.554) and ethnicity (P = 0.269). For clinical outcome analyses, we only considered cases who had received surgery and platinum-based chemotherapy to minimize treatment effects on survival. Among this group, 87% of the subjects were diagnosed with advanced stage (III, IV) ovarian cancer. The majority of tumors biopsied were of the serous subtype (62%), similar to previously reported prevalence (13). The median survival time (MST) was 48.3 months with the median age of 61 years (range, 26–88). Slightly less than half of the patients had died at the end of the follow-up period with 48% showing cancer recurrence and 33% being nonresponders to treatment.
Risk association of individual SNPs
We analyzed 238 SNPs from 8 miRNA processing genes and 134 potential miRNA binding sites in cancer-related genes in Caucasian cases and controls. We discarded 12 SNPs that showed significant departure from Hardy–Weinberg equilibrium (P < 0.01) or MAF less than 1%. From the remaining SNPs, 13 were significantly associated with ovarian cancer risk (Table 1). The strongest associations were seen in 2 linked SNPs in the GEMIN4 gene, rs2740351 (OR = 0.71; 95% CI, 0.57–0.87) and rs7813 (Cys1033Arg; OR = 0.71; 95% CI, 0.57–0.88), using the best fitting additive model. Another nonsynonymous SNP (nsSNP) in GEMIN4 (rs2740349, Asp929Asn) was also significantly associated with decreased ovarian cancer risk (OR = 0.70; 95% CI, 0.51–0.96). Four other SNPs exhibited considerably reduced risk in a dominant model. The remaining 6 SNPs, all located within potential miRNA binding sites, demonstrated significant association with elevated ovarian cancer risk, such as rs17147016 (UGT2A3, OR = 1.47; 95% CI, 1.08–2.01), rs7499 (COL18A1, OR = 1.47; 95% CI, 1.08–2.01), rs3917328 (IL1R1, OR = 1.65; 95% CI, 1.03–2.64), and rs10771184 (KRAS, OR = 1.26; 95% CI, 1.01–1.57). The smallest q values for these SNPs were 0.112 for the 2 most significant GEMIN4 SNPs.
Table 1.
Significant associations of genetic polymorphisms with ovarian cancer risk
| Gene
|
MAF
|
Best fitting model
|
||||||||||
|---|---|---|---|---|---|---|---|---|---|---|---|---|
| SNP | miR processing | miR binding site | Putative miR | SNP position | Chrb | Allelic change | Case | Control | Model | ORc (95% Cl) | P | qd |
| rs2740351a | GEMIN4 | Far 5’ | 17 | A>G | 0.398 | 0.486 | Additive | 0.71 (0.57–0.87) | 0.0014 | 0.112 | ||
| rs7813a | GEMIN4 | Exon 1, ns | 17 | A>G | 0.398 | 0.484 | Additive | 0.71 (0,57–0.88) | 0.0015 | 0.112 | ||
| rs5973822 | ATG4A | miR-26b | 3’UTR | X | A>G | 0.028 | 0.067 | Dominant | 0.42 (0,24–0.75) | 0.0029 | 0 139 | |
| rs17147016 | UGT2A3 | miR-224 | 3’UTR | 4 | T>A | 0220 | 0.173 | Dominant | 1.47 (1.08–2.01) | 0.014 | 0.395 | |
| rs7499 | COL18A1 | miR-594 | 3’UTR | 21 | G>A | 0.428 | 0372 | Dominant | 1.47 (1.07–2.02} | 0.016 | 0.395 | |
| rs2740349 | GEMIN4 | Exon 1, ns | 17 | A>G | 0.156 | 0.204 | Dominant | 0.70 (0.51–0.96) | 0.027 | 0.395 | ||
| rs9920 | CAV1 | miR-630 | 3’ UTR | 7 | A>G | 0.128 | 0.096 | Dominant | 1.50 (1,04–2.17) | 0.032 | 0.395 | |
| rs3917328 | IL1R1 | miR-335 | 3’UTR | 2 | G>A | 0.077 | 0.047 | Dominant | 1.65 (1.03–2.64) | 0.036 | 0.395 | |
| rs10771184 | KRAS | miR-544 | 3’UTR | 12 | T>A | 0.480 | 0.424 | Additive | 1.26 (1.01–1.57) | 0.037 | 0.395 | |
| rs2257082 | XPO5 | Exon 1, ss | 6 | G>A | 0.248 | 0.279 | Dominant | 0.73 (0,54–0.99) | 0.042 | 0.395 | ||
| rs197383 | DDX20 | Far 5’ | 1 | A>G | 0.108 | 0.140 | Dominant | 0.69 (0,48–0.99) | 0.042 | 0.395 | ||
| rs4867329 | RNASEN | Intron 10 | 5 | C>A | 0.447 | 0.476 | Dominant | 0.71 (0.51–0.99) | 0.046 | 0.395 | ||
| rs2075993 | E2F2 | miR-663 | 3’UTR | 1 | A>G | 0.509 | 0.456 | Additive | 1.24 (1,00–1.54) | 0.047 | 0.395 | |
r2 = 0.99.
Chromosome location.
Odds ratio adjusted for age.
FDH-adjusted P value
Abbreviations: ns, nonsynonymous; ss, synonymous.
Haplotype analysis of GEMIN4 SNPs
Because 3 of the GEMIN4 SNPs exhibited strong association with ovarian cancer risk, we performed a haplotype analysis of all 6 genotyped GEMIN4 SNPs (Supplementary Table S2). Using the wild-type alleles of all 6 SNPs as reference, the haplotype containing the variant alleles of the 3 significant SNPs (rs274035, rs7813, and rs2740349; M_M_M_W_W_W) showed the strongest protective effect on ovarian cancer (OR = 0.63; 95% CI, 0.46–0.86, P = 0.004). A second haplotype containing the variant alleles of rs274035, rs7813, and 2 other SNPs (M_M_W_W_M_M) was also associated with a significantly reduced ovarian cancer risk (OR = 0.69; 95% CI, 0.51–0.94; P = 0.018).
CART analysis of miRNA pathway polymorphisms
We then used CART analysis to explore the gene–gene interactions in modulating ovarian cancer risk (Fig. 1). There were 6 terminal nodes constructed from interactions among rs5973822 (ATG4A), rs2740351 (GEMIN4), rs10771184 (KRAS), rs7499 (COL18A1), and rs9920 (CAV1). Using individuals of terminal node 1 as the reference, the ORs for other terminal nodes ranged from 1.22 (node 2) to 4.76 (node 6). We further categorized these nodes into 3 groups of low- (nodes 1 and 2), medium- (nodes 3 and 4), and high-risk (nodes 5 and 6). Compared with the low-risk group, the ORs for the medium- and high-risk groups were 1.85 (95% CI, 1.28–2.68) and 3.97 (95% CI, 2.61–6.04), respectively. In general, subjects carrying heterozygous or homozygous variant alleles of ATG4A (rs5973822) were associated with the lowest risk for ovarian cancer, whereas those heterozygous or homozygous for the variant alleles of KRAS (rs10771184) or CAV1 (rs9920) had the highest risk.
Figure 1.
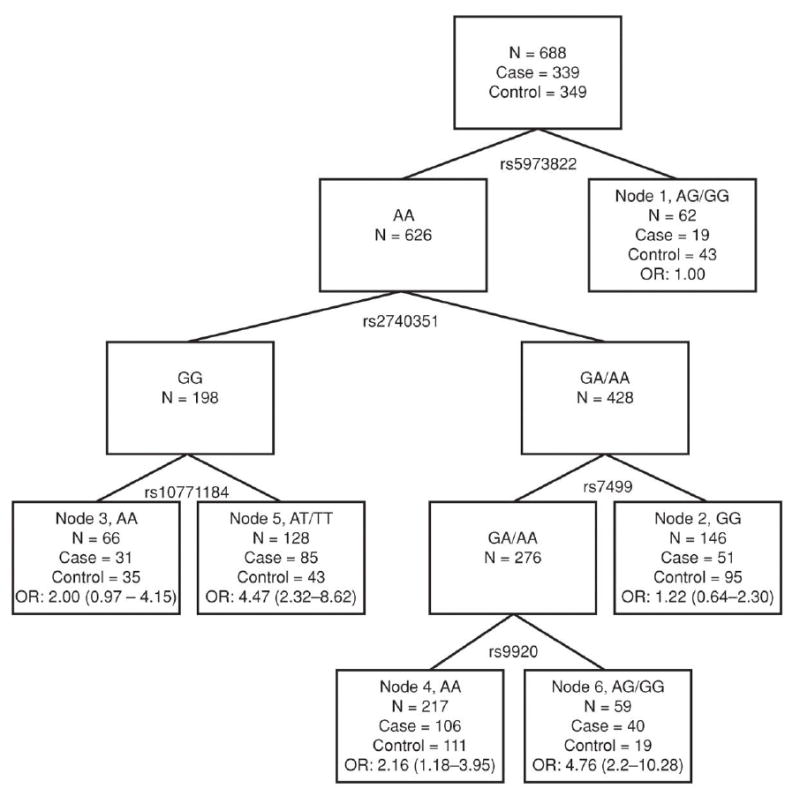
Tree structure depicts higher order gene–gene interactions of 5 miRNA pathway polymorphisms significantly associated with ovarian cancer risk. Because rs2740351 and rs7813 were linked, only the former was considered in the analysis. For each node, the number of subjects (N), including the number of cases and controls and the ORs with 95% CI are listed. Number of subjects in the nodes may not sum up to total due to missing genotype information.
SNPs associated with overall survival and treatment response
Out of 226 miRNA pathway SNPs examined, 24 were significantly associated with ovarian cancer survival (Table 2) with the most significant SNP being in the PDGFC gene (rs1425486, HR = 2.69; 95% CI, 1.67–4.33; recessive model), which remained significant after adjusting for multiple testing (q = 0.004). Other SNPs among the top 5 included those in SNAI1 (rs1047920, HR = 1.96; 95% CI, 1.30–2.97; dominant model), TLR (rs7869402, HR = 2.16; 95% CI, 1.31–3.57; dominant model), and DGCR8 (rs3757, HR = 2.76; 95% CI, 1.30–5.84; recessive model). Interestingly, the variant allele of the KRAS SNP (rs10771184) was associated with increased survival (OR = 0.56; 95% CI, 0.38–0.84; dominant model).
Table 2.
Significant associations of genetic polymorphisms with ovarian cancer survival
| SNP | Gene | Putative miR | SNP position | Chre | Allelic change | Model | HRf (95% Cl) | P | qg |
|---|---|---|---|---|---|---|---|---|---|
| rs1425486 | PDGFC | miR-425 | 3’ UTR | 4 | G>A | Rec | 2.69 (1.67–4.33) | 4.90 × 10⁻⁵ | 0.004 |
| rs1047920 | SNAI1 | miR-24 | 3’ UTR | 20 | G>A | Dom | 1.96 (1.30–2.97) | 0.001 | 0.056 |
| rs7869402 | TLR4 | miR-539 | 3’ UTR | 9 | G>A | Dom | 2 .16 (1.31–3.57) | 0.002 | 0.063 |
| rs10771184 | KRAS | miR-544 | 3’ UTR | 12 | T>A | Dom | 0.56 (0.38–0.84) | 0.005 | 0.095 |
| rs3757 | DGCR8 | miR-518c | 3’ UTR | 22 | G>A | Rec | 2.76 (1.30–5.84) | 0.008 | 0.101 |
| rs3792830 | RNASEN | Intron 6 | 5 | A>G | Dom | 0.39 (0.19–0.79) | 0.009 | 0.101 | |
| rs1633445a | DGCR8 | 3’ far end | 22 | A>G | Rec | 2.67 (1.27–5.64) | 0.010 | 0.101 | |
| rs720014b | DGCR8 | 3’ UTR | 22 | A>G | Rec | 2.65 (126–5.59) | 0.011 | 0.101 | |
| rs3087833 | GEMIN4 | 3’ far end | 17 | G>A | Add | 1.48 (1.08–2.03) | 0.014 | 0.113 | |
| rs2287584 | RNASEN | Exon 1, ss | 5 | A>G | Rec | 0.39 (0.19–0.84) | 0.016 | 0.113 | |
| rs9333555 | POLH | Exon 11, ns | 6 | A>G | Dom | 2.49 (1.18–5.24) | 0.016 | 0.113 | |
| rs17749202 | WNT11 | miR-661 | 3’ UTR | 11 | A>G | Rec | 1.66 (1.07–2.58) | 0.024 | 0.139 |
| rs12889916 | SSTR1 | miR-491 | 3’ UTR | 14 | A>G | Rec | 0.42 (0.19–0.91) | 0.028 | 0.139 |
| rs9606248 | DGCR8 | Intron 8 | 22 | A>G | Rec | 0.20 (0.05–0.84) | 0.028 | 0.139 | |
| rs8139591c | DGCR8 | Intron 9 | 22 | A>G | Rec | 0.20 (0.05–0.84) | 0.028 | 0.139 | |
| rs7719666 | RNASEN | Iniron 31 | 5 | G>A | Rec | 1.49 (1.03–2.15) | 0.032 | 0.139 | |
| rs563002 | DDX20 | 3’ far end | 1 | A>G | Rec | 0.39 (0.17–0.92) | 0.032 | 0.139 | |
| rs17147016 | UGT2A3 | miR-224 | 3’ UTR | 4 | T>A | Dom | 0.68 (0.48–0.97) | 0.033 | 0.139 |
| rs10035440 | RNASEN | 3’ far end | 5 | A>G | Add | 0.69 (0.49–0.97) | 0.035 | 0.139 | |
| rs10719d | RNASEN | 3’ UTR | 5 | G>A | Rec | 0.44 (021–0.95) | 0.036 | 0.139 | |
| rs197412 | DDX20 | Exon 11, ns | 1 | A>G | Rec | 0.60 (0.37–0.97) | 0.038 | 0.139 | |
| rs3136642 | NFKBIB | miR-371 | 3’ UTR | 19 | A>G | Dom | 0.70 (0.50–0.99) | 0.042 | 0.142 |
| rs12010722 | RPS6KA3 | miR-218, miR-455 | 3’ UTR | X | G>A | Dom | 1.45 (1.01–2.09) | 0.043 | 0.142 |
| rs2741 | GHRHR | miR-520f | 3’ UTR | 7 | A>C | Dom | 1.46 (1.00–2.14) | 0.047 | 0.150 |
r2 = 0.99 with rs3757.
r2 = 1.0 with rs3757.
r2 = 0.99 with rs9606248.
r2 = 0.83 with rs2287584,
Chromosome location.
Adjusted for age, clinical stage, histology , and treatment regimen.
FDR-adjusted P value.
Abbreviations: ns, nonsynonymous; ss, synonymous; Rec, recessive; Dom, dominant; Add, additive.
Analysis of the miRNA-related SNPs for treatment outcome revealed 17 SNPs that had significant association, including rs12190214 in ALDH5A1 (OR = 2.60; 95% CI, 1.31–5.14), rs2248718 in ATP6V1C1 (OR = 2.12; 95% CI, 1.19–3.78), and rs12226697 in SIRT3 (OR = 3.30; 95% CI, 1.29–8.45; Table 3). Except for the intronic SNP of RNASEN (rs17408716), all the significant SNPs were located in potential miRNA binding sites. Notably, 3 of the significant SNPs were also significantly associated with survival. Consistent with their higher death risk, variant alleles of PDGFC (OR = 3.38; 95% CI, 1.39–8.19) and TLR4 (OR = 3.49; 95% CI, 1.41–8.67) were associated with poor treatment response. Similarly, the variant KRAS allele, which showed reduced death risk, was associated with favorable treatment outcome (OR = 0.50; 95% CI, 0.27–0.91).
Table 3.
Significant associations of genetic polymorphisms with ovarian cancer treatment response
| SNP | Gene | Putative miR | SNP position | Chra | Allelic change | Model | ORb (95% Cl) | P | qc |
|---|---|---|---|---|---|---|---|---|---|
| rs12190214 | ALDH5A1 | miR–210, miR–450 | 3’ UTR | 6 | C>A | Dom | 2.60 (1.31–5.14) | 0.0062 | 0.167 |
| rs1425486 | PDGFC | mR–425 | 3’ UTR | 4 | G>A | Rec | 3.38 (1.39–8.19) | 0.0070 | 0.167 |
| rs7869402 | TLR4 | miR–539 | 3’ UTR | 9 | G>A | Dom | 3.49 (1.41–8.67) | 0.0071 | 0.167 |
| rs2248718 | ATP6V1C1 | miR–147, miR–644 | 3’ UTR | 8 | G>A | Dom | 2.12 (1.19–3.78) | 0.0109 | 0.167 |
| rs12226697 | SIRT3 | miR–105, miR–532 | 3’ UTR | 11 | G>A | Dom | 3.30 (1.29–8.45) | 0.0128 | 0.167 |
| rs17408716 | RNASEN | Intron 17 | 5 | A>G | Dom | 0.38 (0.17–0.84) | 0.0166 | 0.167 | |
| rs713065 | FZD4 | miR–302, miR–494 | 3’ UTR | 11 | G>A | Rec | 2.28 (1.15–4.53) | 0.0189 | 0.167 |
| rs16869269 | RRM2B | miR–600 | 3’ UTR | 8 | A>G | Rec | 7.67 (1.36–43.16) | 0.0209 | 0.167 |
| rs7695605 | RNF175 | miR–27, miR–128 | 3’ UTR | 4 | G>C | Dom | 1.85 (1.09–3.13) | 0.0217 | 0.167 |
| rs10900596 | MDM4 | miR–409–3p | 3’ UTR | 1 | G>A | Rec | 0.31 (0.11–0.85) | 0.0233 | 0.167 |
| rs10771184 | KRAS | miR-544 | 3’ UTR | 12 | T>A | Dom | 0.50 (0.27–0.91) | 0.0239 | 0.167 |
| rs12900401 | SMAD3 | miR–409–5p | 3’ UTR | 15 | G>A | Dom | 2.68 (1.13–6.34) | 0.0250 | 0.167 |
| rs8065843 | FLJ35220 | miR–27, miR–513 | 3’ UTR | 17 | A>C | Rec | 4.47 (1.17–17.02) | 0.0284 | 0.175 |
| rs7957 | TNFRSF10D | miR–615 | 3’ UTR | 8 | A>G | Dom | 1.75 (1.03–2.97) | 0.0374 | 0.203 |
| rs1048691 | MARCH9 | miR–520, miR–525 | 3’ UTR | 12 | G>A | Rec | 0.11 (0.01–0.90) | 0.0392 | 0.203 |
| rs3733336 | FGF5 | miR–23, miR–323 | 3’ UTR | 4 | A>G | Rec | 0.44 (0.19–0.98) | 0.0454 | 0.203 |
| rs1126772 | SPP1 | miR–323 | 3’ UTR | 4 | A>G | Rec | 3.81 (1.02–14.17) | 0.0460 | 0.203 |
NOTE: Defined by evidervce of residual disease indicated by PET and CT scans, second-look surgery, and CA-125 level or dead/alive status.
Chromosome location.
Adjusted for age, clinical stage, histology, and treatment regimen.
FDR-adjusted P-value.
Abbreviations: Rec, recessive; Dom, dominant.
Cumulative effects of unfavorable genotypes on ovarian cancer risk and treatment response
To examine the cumulative effects of the miRNA-related genetic variants on ovarian cancer risk, we performed unfavorable genotype analysis using the 12 SNPs that showed significant association as previously (Table 4). Because rs2740351 and rs7813 exhibited linkage, only the former was included in the analysis. Compared with subjects in the low-risk group as reference (5 unfavorable genotypes or fewer), those in the medium-risk group (6–7 unfavorable genotypes) and the high-risk group (≥8 unfavorable genotypes) had about 2- (OR = 1.99; 95% CI, 1.38–2.87) and 4.5-fold (OR = 4.46; 95% CI, 2.83–7.02) increased risk of ovarian cancer, respectively (P for trend = 1.51 × 10⁻¹¹).
Table 4.
Cumulative effect of unfavorable genotypes from miRNA-related SNPs on ovarian cancer risk
| Number of unfavorable genotypes | Case n (%) | Control n (%) | ORa | 95% CI | P value |
|---|---|---|---|---|---|
| ≤5 | 68 (21.2) | 138 (40.7) | 1 (reference) | ||
| 6~7 | 152 (47.4) | 155 (45.7) | 1.99 | 1.38–2.87 | 2.34 × 10⁻⁴ |
| ≥8 | 101 (31.5) | 46 (13.6) | 4.46 | 2.83–7.02 | 1.13 × 10⁻¹⁰ |
| Ptrend | 1.51 × 10⁻¹¹ |
NOTE: Unfavorable genotypes: rs2740351(AA), rs5973822(AA), rs17147016(TA+AA), rs2740349(AA), rs9920(AG+GG), rs3917328(GA+AA), rs10771184(TA+AA), rs2257082(GG), rs 197383(AA), rs4867329(CC), rs2075993(AG+GG).
Adjusted for age.
We also performed unfavorable genotype analysis of the 17 SNPs that are significantly associated with treatment response (Table 5). Using 5 or fewer unfavorable genotypes as reference, subjects with 6 and 7 or greater unfavorable genotypes had 3.8-fold (OR = 3.82; 95% CI, 1.73–8.43) and more than 20-fold (OR = 20.1; 95% CI, 9.17–44.2) increased risk of not responding to treatment respectively (P for trend = 8.92 × 10 13).
Table 5.
Cumulative effect of unfavorable genotypes from miRNA-related SNPs on ovarian cancer treatment response
| Number of unfavorable genotypes | Nonresponders, n (%) | Responders, n (%) | ORa | 95% CI | P value |
|---|---|---|---|---|---|
| ≤5 | 20 (23.0) | 124 (64.2) | 1 (reference) | ||
| 6 | 19(21.8) | 42 (21.8) | 3.82 | 1.73–8.43 | 8.9 × 10⁻⁴ |
| ≥7 | 48 (55.2) | 27 (14.0) | 20.14 | 9.17–44.2 | 7.44 × 10⁻¹⁴ |
| Ptrend | 8.92 × 10⁻¹³ |
NOTE: Unfavorable genotypes: rs12190214(CA+AA), rs1425486(AA), rs7869402(GA+AA), rs2248718(GA+AA), rs12226697(GA+AA), rs17408716(AA), rs713065(AA), rs16869269(GG), rs7695605(GC+CC), rs10900596(GG+AA), rs10771184(TT), rs12900401(GA+AA), rs8065843(CC), rs7957(AG+GG), rs1048691(GG+GA), rs3733336(AA+AG), rs1126772(GG).
Adjusted age, clinical stage, histology, and treatment regimen.
Survival analysis of significant SNPs
We plotted Kaplan–Meier curves for the top 3 SNPs associated with survival (Figs. 2A–C). The homozygous variant alleles of rs1425486 (A/A; PDGFC) and the heterozygous/homozygous variant alleles of rs1047920 (GA/AA; SNAI1) and rs7869402 (GA/AA; TLR4) were associated with shorter MST. Their MSTs were 23.8, 28.0, and 34.9 months compared with the MSTs of 53.1, 53.1, and 52.7 months for their reference groups, respectively.
Figure 2.
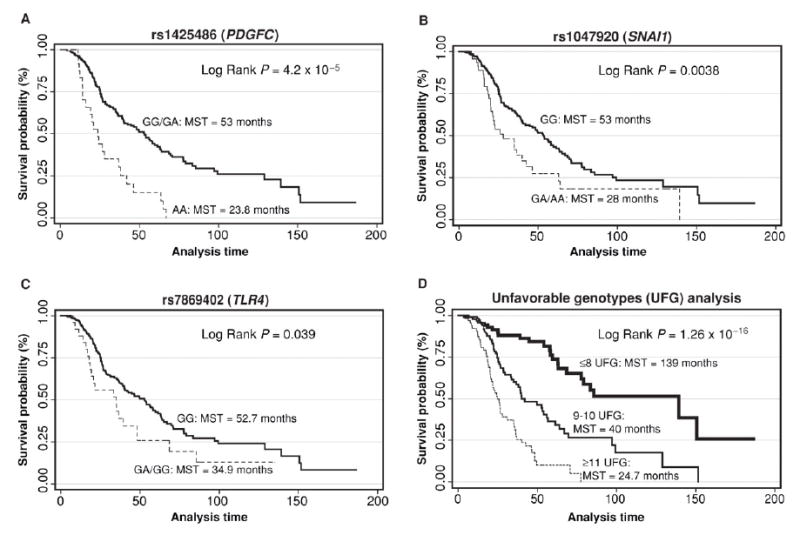
Kaplan–Meier survival curves of ovarian cancer patients according to top 3 polymorphisms whose variant alleles were associated with increased death risk: A, rs1425486 (PDGFC), recessive model. B, rs1047920 (SNAI1), dominant model. C, rs7869402 (TLR4), dominant model. D, survival plot of ovarian cancer patients grouped by the number of unfavorable genotypes in the miRNA pathway. Unfavorable genotypes used for the analysis were rs1425486(AA), rs1047920(GA+AA), rs7869402(GA+AA), rs10771184(TT), rs3757(AA), rs3792830(AA), rs3087833(AA), rs2287584(AA+AG), rs9333555(AG+GG), rs17749202(GG), rs12889916(AA+AG), rs9606248(AA+AG), rs7719666(AA), rs563002(AA+AG), rs10035440(AA), rs17147016(TT), rs197412(AA+AG), rs3136642(AG+GG), rs12010722(GA+AA), and rs2741(AC+CC). HR with 95% CI.
Unfavorable genotypes and cancer survival
The cumulative effect of unfavorable genotypes on ovarian cancer survival is shown in Figure 2D. Four SNPs (rs1633445, rs720014, rs8139591, rs10719) were in high linkage disequilibrium with other SNPs in the panel (Table 3) and were discarded from the analysis. Using the low death risk group of 8 or fewer unfavorable genotypes as reference, there was a significant gene–dosage effect for medium-risk (9–10 unfavorable genotypes; HR = 3.26; 95% CI, 1.92–5.52) and high-risk (11 unfavorable genotypes) groups (HR = 8.52; 95% CI, 4.90–14.84; P trend = 2.2 × 10⁻¹⁶). The MST for the reference group was 139 months versus 24.7 months for the high-risk group.
MiRNA binding site variant of PDGFC affects targeting by miR-425
Because rs1425486 of the PDGFC gene showed the most significant association with ovarian cancer survival, we wanted to test whether the SNP in the putative miRNA binding site influences targeting by miR-425 in vitro. We cloned the entire 3’ UTR of PDGFC gene containing the wild-type or variant allele of rs1425486 into the pGL3 luciferase reporter construct and then transfected the reporter along with control or miR-425 RNA into OVCAR3 cells. We found that cotransfection of miR-425 significantly inhibited expression of the reporter carrying the wild-type PGDFC (G) allele but not the variant (A) allele (Supplementary Figure S1). This suggests that the variant rs1425486 genotype could differentially affect targeting by miR-425 in ovarian cancer cells leading to higher PDGFC expression.
DISCUSSION
Previous studies have shown the deregulation of miRNA or miRNA-related genes in ovarian cancer (5, 14, 15). However, the influence of low penetrance, common genetic variations in the miRNA pathway genes on ovarian cancer predisposition has not been extensively explored. Here, we show that SNPs in miRNA processing genes and miRNA binding sites were associated with ovarian cancer predisposition.
Interestingly, 2 nsSNP (rs7813, Cys1033Arg and rs2740349, Asn923 Asp) in GEMIN4 were among the top SNPs associated with ovarian cancer predisposition. Several SNPs in GEMIN4 had been identified previously as having significant association with bladder, esophageal, and renal cell carcinoma risks (7-9), indicating a more general role for GEMIN4 in modifying cancer risk. GEMIN4 encodes a product that is a component of a multiprotein complex localized to the nucleus and cytoplasm (16). It is a component of both miRNA–protein complex (miRNP) and spliceosomal snRNA–protein complex (snRNP) and may play multiple roles in vivo. Further, in vitro and in vivo functional assays are necessary to dissect the mechanistic basis for GEMIN4’s risk association in ovarian cancer. Other polymorphisms involving miRNA processing genes that were found to be significantly associated with ovarian cancer risk include those of XPO5 (Exportin 5, rs2257082), DDX20 (DEAD box protein, rs197383) and RNASEN (Drosha, rs4867329). Interestingly, the variant alleles of all these SNPs were associated with reduced cancer risk (Table 2), indicating a common influence of these miRNA processing genes in affecting tumorigenesis.
We also identified 6 miRNA binding site variant SNPs in the 3’UTR of target genes that were associated with ovarian cancer risk. With the exception of the ATG4A SNP, minor variant of these SNPs were associated with elevated risk. ATG4A encodes a cysteine protease involved in autophagy (17). Reduced levels of autophagy have been described in some malignant tumors and its role in controlling unregulated cell growth has been proposed (18, 19). Because the variant allele was associated with reduced ovarian cancer risk (Table 1), this suggests that altered targeting by miRNA might elevate ATG4A protein expression to confer protection from tumorigenesis. UGT2A3 is a member of the UDP-glucuronosyltransferases, which are critical for the detoxification of numerous drugs or environmental pollutants (20). A recent report indicated that genetic variants of UGT1A1 and UGT1A9, 2 other members of this large enzyme family, were associated with increased risk of colon cancer for patients with elevated dietary intake of heterocyclic amines and polycyclic aromatic hydrocarbons (21). COL18A1 is a type XVIII collagen. The proteolytically cleaved C-terminal fragment of this protein, endostatin, is a potent antiangiogenic peptide investigated as a potential cancer therapeutic. CAV1 encodes a multifunctional scaffolding protein that is found in cell-surface caveolae. Cav1 might regulate cellular processes, such as transformation, tumor growth, migration, and metastasis, and has been investigated as a potential marker in several types of cancers (22). IL1R1 is a type 1 interleukin 1 receptor, which mediates cytokine-induced inflammatory or immune response. The role of inflammation in certain types of cancer predisposition has been well established. Mutated KRAS has been implicated in various malignancies including carcinomas of the lung, ovary, pancreas, and colon (23-26). E2F2 encodes a member of E2F transcription factor family, which plays a pivotal role in cell cycle regulated by the retinoblastoma pathway. High expression of E2F2 was found in ovarian cancer cell lines as well as in ovarian cancer patients with advanced histopathologic stage (27). Taken together, there is strong biological plausibility for the individual and joint association of these miRNA-targeted genes and ovarian cancer risk.
We found 3 SNPs (located in PDGFC, TLR4, and KRAS) that were significantly associated with survival and treatment response. The strongest association was found in a variant allele of PDGFC gene (rs1425486), which remained significant after adjusting for multiple testing. PDGFC is a member of the platelet-derived growth factor family, which encodes a mitogenic factor for cells of mesenchymal origin. Recent studies have linked PDGFC expression with chemoresistance to cisplatin in head and neck cancer and shown that PDGFC expression by tumor-associated fibroblasts might mediate tumor refractory effect to anti-VEGF treatment, supporting the role of this gene in influencing ovarian cancer and treatment response (28,29). In animal models, PDGFC had been shown to promote tumor growth by activating and recruiting cancer associated fibroblasts in the stroma and might play a role in tumor progression (30). Rs1425486 is a predicted binding site for miR-425, which is expressed at low levels in the ovary (PolymiRTS database; microRNA expression database: http://www.microrna.org). The variant allele of this SNP is predicted to cause changes in the pairing of the miRNA and its target transcript at the conserved binding site. It has been reported that the expression of miR-425 and other miRNAs is upregulated in the glioblastoma non–stem cell (CD133−) population and that transfection of these miRNAs resulted in inhibition of neurosphere formation (31). In our in vitro reporter assay, we demonstrated that rs1425486 genotype could differentially affect miR-425 targeting in ovarian cancer cells, suggesting that PDGFC is a putative target for miR-425. Measurement of PDGFC expression in ovarian tissue in correlation with its genotype, as well as more detailed fine mapping of the PDGFC gene may further strengthen the association of this gene with ovarian cancer clinical outcome.
TLR4 encodes a member of the Toll-like receptor (TLR) family, which mediates pathogen recognition and activation of innate immunity. Toll-like receptors, such as TLR4, are expressed on immune cells and have vital function in host immunity against foreign pathogens and in generating host inflammatory response. It has been shown that several TLRs, including TLR4, are also expressed on the surface epithelium of normal ovaries, as well as malignant tumors (32). Ligation of the TLRs led to the release of various cytokines, which could trigger inflammatory response in the microenvironment. Moreover, several lines of evidence suggest that TLR activation could also promote tumor growth and metastasis. For example, Szczepanski and colleagues. recently showed that in tumor tissues obtained from head and neck cancer patients, activation of TLR4 receptor enhanced tumor growth, protected cells from drug-induced apoptosis, and decreased sensitivity of the tumor cells to immune lysis (33). At least in these in vitro settings, TLR4 could facilitate tumor growth and protect tumor cells from immune response. Intriguingly, the variant allele of KRAS that was associated with increased ovarian cancer risk also showed correlation with increased survival (Tables 1, 4, and 5). This paradoxical observation is not unprecedented. Previous compelling evidence has shown that DNA repair plays a similar role in cancer risk and outcome, with suboptimal DNA repair capacity associated with increased cancer risk but better treatment response and survival in lung cancer patients (34-36).
For the association of the KRAS SNP with ovarian cancer risk, survival, and treatment response, one possibility might be that there is differential activity of the protooncogenic product by the 2 alleles, so that higher activity might be associated with increased cancer risk but also predisposes the tumor cells to better killing by platinum-based therapy, hence better clinical outcome. Indeed, many DNA-damaging chemotherapeutic agents take advantage of the tumor cells’ proclivity to proliferate to target them preferentially. Currently, there are limited clinical data regarding the status of various cancer-related genes, including KRAS, and their association with survival or response to chemotherapy. More detailed functional studies may probe the underlying mechanism for the association of common genetic variants of these genes and the prognosis for ovarian cancer. Genetic changes involving KRAS in ovarian malignancy have been substantiated by previous studies (13, 37-41).
For SNPs that are associated with overall survival only, rs1047920 of SNAI1 is the most significant. SNAI1 is the human homologue of the Drosophila transcription repressor gene, Snai1 , which is involved in mesoderm formation during embryo development. In humans, Snail1 plays an important role during epithelial–mesenchymal transition by downregulating E-cadherin expression, which may lead to cancer progression (42). Confirming the validity of our data, a recent study indicated that increased Snail expression was as sociated with decreased overall survival of ovarian cancer patients (43).
Among the top 5 miRNA pathway SNPs that are associated with treatment response only include those that are located in ALDH5A1 (rs12190214), ATP6V1C1 (rs2248718), and SIRT3 (rs12226697). ALDH5A1 is a member of the aldehyde dehydrogenase (ALDH) superfamily, which is involved in non-P450 enzyme metabolism of aldehydes generated by various endogenous and exogenous precursors including xenobiotic drugs (44). Mutations of ALDH5A1 can result in γ-hydroxybutyric aciduria, a rare autosomal recessive disorder characterized by neurologic and cognitive defects due to the accumulation of γ-hydroxybutyric acid. The influence of ALDH genes in the risk and clinical outcome of some cancers has been reported recently (45-47); although the role of each individual gene in ovarian cancer predisposition and treatment response is currently unknown. ATP6V1C1 encodes a component of the vacuolar ATPase, which is important for vesicular proton gradient generation. ATP6V1C1 has been found to be overly expressed in oral squamous cell carcinoma and is hypothesized to influence tumor development through changes in intracellular pH regulation (48). SIRT3 is a member of sirtuin gene family that is involved in NAD-dependent deacetylation. SIRT3 is localized in the mitochondria, where it deacetylates and activates acetyl-CoA synthetase. Recently, it has been found that SIRT3 might be proapoptotic and participate in basal apoptotic pathways (49). Overall, it is biologically plausible that polymorphisms in miRNA binding sites might affect the expression of these metabolic genes, which in turn, may influence response to chemotherapy.
The combined effects of the miRNA pathway polymorphisms on ovarian cancer risk, survival, and treatment response were readily seen in the unfavorable genotype analyses, which showed a trend toward increasing risk with increasing number of unfavorable genotypes. This is consistent with the notion that ovarian cancer is a polygenic disease involving multiple risk factors, which can modify disease initiation, progression, and outcome.
It is possible that some of the associations identified in this study were due to chance finding. However, we tried to minimize false discovery by matching our cases and controls in terms of age, gender, and ethnicity and by calculating the q value, which is an FDR-adjusted P value. On the basis of the minimum FDR of 10%, several of the top SNPs were significant or at least borderline significant (Supplementary Table S3). In addition, we have tested for disease heterogeneity in the cases by checking the proportional hazards assumption on the basis of Schoenfeld residuals for the histology subtype and did not observe significant departure from the assumption of proportionality (P = 0.11) in our data. Stratified analysis of top SNPs among serous carcinoma patients did not show significant changes in risk estimates for overall survival and treatment response (Supplementary Table S4) suggesting they were not significantly affected by disease heterogeneity.
There are other limitations to our study, such as the relatively small sample size and the lack of complete family history in some of the cases. Moreover, this is a hospital-based case–control study and selection bias may exist, as the controls from a clinic may not be ideal representatives of the geographically matched population with similar environmental exposure. However, MD Anderson serves as a referral center for many cancer patients from the Kelsey–Seybold system; therefore our controls are likely to represent a similar population base to the cases. Furthermore, because our research is entirely driven by a genetic hypothesis, the use of population-based control is not as critical as it may have been in classical studies of disease and exposure. In addition, we recruited newly diagnosed patients, which will limit potential survival bias. Finally, the query for miRNA binding sites was done in silico , so that caution should be taken regarding their interpretation until confirmed by more detailed functional assays, which might uncover the mechanistic basis for the association of some of these polymorphisms and ovarian tumorigenesis. Nevertheless, the strengths of this study include the well-characterized patient population with detailed clinical, treatment, and follow-up information, comprehensive query of tagging and functional SNPs in the miRNA biosynthesis genes plus potential miRNA binding sites in cancer-related pathways, the in-depth analyses of single and joint association of these genetic variants with ovarian cancer risk and treatment response, as well as the original, functional characterization of one of the significant SNPs. These results support the general hypothesis that genetic variants of the miRNA-related pathway could modify ovarian cancer risk and clinical outcomes. Future replicated studies in independent populations are necessary to confirm our findings.
In summary, this is the first large-scale evaluation of germline genetic variants in miRNA-related genes in ovarian cancer. Individual and joint association of these polymorphisms with ovarian cancer risk and clinical outcomes revealed novel pathways for oncogenesis and might serve as potential biomarkers in a risk prediction model to guide cancer screening, diagnosis, treatment, and prevention.
Supplementary Material
Acknowledgments
Research support: Department of Defense Ovarian Cancer Research Program under award number W81XWH-07-1-0449.
References
- 1.American Cancer Society. Cancer Facts and Figures. Atlanta, GA: American Cancer Society; 2008. pp. 1–68. [Google Scholar]
- 2.Risch HA, McLaughlin JR, Cole DE, Rosen B, Bradley L, Kwan E, et al. Prevalence and penetrance of germline BRCA1 and BRCA2 mutations in a population series of 649 women with ovarian cancer. Am J Hum Gent. 2001;68:700–10. doi: 10.1086/318787. [DOI] [PMC free article] [PubMed] [Google Scholar]
- 3.Drake AC, Campbell H, Porteous MEM, Dunlop MG. The contribution of DNA mismatch repair gene defects to the burden of gynecological cancer. Int J Gynecol Cancer. 2003;13:262–77. doi: 10.1046/j.1525-1438.2003.13194.x. [DOI] [PubMed] [Google Scholar]
- 4.Lewis BP, Burge CB, Bartel DP. Conserved seed pairing, often flanked by adenosines, indicates that thousands of human genes are mir-oRNA targets. Cell. 2005;12:15–20. doi: 10.1016/j.cell.2004.12.035. [DOI] [PubMed] [Google Scholar]
- 5.Lu J, Getz G, Miska EA, Alvarez-Saavedra E, Lamb J, Peck D, et al. MicroRNA expression profiles classify human cancers. Nature. 2005;435:834–8. doi: 10.1038/nature03702. [DOI] [PubMed] [Google Scholar]
- 6.Zhang L, Huang J, Yang N, Greshock J, Megraw MS, Giannakakis A, et al. MicroRNA exhibit high frequency genomic alterations in human cancer. Proc Natl Acad Sci U S A. 2006;103:9136–41. doi: 10.1073/pnas.0508889103. [DOI] [PMC free article] [PubMed] [Google Scholar]
- 7.Huang Q, Gumireddy K, Schrier M, le Sage C, Nagel R, Nair S, et al. The microRNAs miR-373 and miR-520c promote tumour invasion and metastasis. Nature Cell Biol. 2008;10:202–10. doi: 10.1038/ncb1681. [DOI] [PubMed] [Google Scholar]
- 8.Yang H, Dinney CP, Ye Y, Zhu Y, Grossman HB, Wu X. Evaluation of genetic variants in microRNA-related genes and risk of bladder cancer. Cancer Res. 2008;68:2530–7. doi: 10.1158/0008-5472.CAN-07-5991. [DOI] [PubMed] [Google Scholar]
- 9.Horikawa Y, Wood CG, Yang H, Zhao H, Ye Y, Gu J, et al. Single nucleotide polymorphisms of microRNA machinery genes modify the risk of renal cell carcinoma. Clin Cancer Res. 2008;14:7956–62. doi: 10.1158/1078-0432.CCR-08-1199. [DOI] [PMC free article] [PubMed] [Google Scholar]
- 10.Ye Y, Wang KK, Gu J, Yang H, Lin J, Ajani JA, et al. Genetic variations in microRNA-related genes are novel susceptibility loci for esophageal cancer risk. Cancer Prev Res. 2008;1:460–9. doi: 10.1158/1940-6207.CAPR-08-0135. [DOI] [PMC free article] [PubMed] [Google Scholar]
- 11.Bartel DP. MicroRNA: genomics, biogenesis, mechanism, and function. Cell. 2004;116:281–97. doi: 10.1016/s0092-8674(04)00045-5. [DOI] [PubMed] [Google Scholar]
- 12.Wu X, Spitz MR, Lee J, Lippman SM, Ye Y, Yang H, et al. Novel susceptibility loci for second primary tumors/recurrence in early-stage head and neck cancer patients: large scale evaluation of genetic variants. Cancer Prev Res. 2009;2:617–24. doi: 10.1158/1940-6207.CAPR-09-0025. [DOI] [PMC free article] [PubMed] [Google Scholar]
- 13.Quaye L, Gayther SA, Ramus SJ, Di Cioccio RA, McGuire V, Hogdall E, et al. The effects of common genetic variants in oncogenes on ovarian cancer survival. Clin Cancer Res. 2008;14:5833–9. doi: 10.1158/1078-0432.CCR-08-0819. [DOI] [PubMed] [Google Scholar]
- 14.Iorio MV, Visone R, Di Leva G, Donati V, Petrocca F, Casalini P, et al. MicroRNA signatures in human ovarian cancer. Cancer Res. 2007;67:8699–707. doi: 10.1158/0008-5472.CAN-07-1936. [DOI] [PubMed] [Google Scholar]
- 15.Yang H, Kong W, He L, Zhao JJ, O’Donnell JD, Wang J, et al. MicroRNA expression profiling in human ovarian cancer: miR-214 induces cell survival and cisplatin resistance by targeting PTEN. Cancer Res. 2008;68:425–33. doi: 10.1158/0008-5472.CAN-07-2488. [DOI] [PubMed] [Google Scholar]
- 16.Charroux B, Pellizzoni L, Perkinson RA, Yong J, Shevchenko A, Mann M, et al. Gemin4, a novel component of the SMN complex that is found in both gems and nucleoli. J Cell Biol. 2000;148:1177–86. doi: 10.1083/jcb.148.6.1177. [DOI] [PMC free article] [PubMed] [Google Scholar]
- 17.Scherz-Shouval R, Shvets E, Fass W, Shorer H, Gil L, Elazar Z. Reactive oxygen species are essential for autophagy and specifically regulate the activity of Atg4. The EMBO J. 2007;26:1749–60. doi: 10.1038/sj.emboj.7601623. [DOI] [PMC free article] [PubMed] [Google Scholar]
- 18.Bialik S, Kimchi A. Autophagy and tumor suppression: recent advances in understanding the link between autophagic cell death pathways and tumor development. Adv Exp Med Biol. 2008;615:177–200. doi: 10.1007/978-1-4020-6554-5_9. [DOI] [PubMed] [Google Scholar]
- 19.Mizushima N, Levine B, Cuervo AM, Klionsky DJ. Autophagy fights disease through cellular self-digestion. Nature. 2008;451:1069–75. doi: 10.1038/nature06639. [DOI] [PMC free article] [PubMed] [Google Scholar]
- 20.Court MH, Hazarika S, Krishnaswamy S, Finel M, Williams JA. Novel polymorphic human UDP-glucuronosyltransferase 2A3: cloning, functional characterization of enzyme variants, comparative tissue expression, and gene induction. Mol Pharmacol. 2008;74:744–54. doi: 10.1124/mol.108.045500. [DOI] [PMC free article] [PubMed] [Google Scholar]
- 21.Girard H, Butler LM, Villeneuve L, Millikan RC, Sinha R, Sandler RS, et al. UGT1A1 and UGT1A9 functional variants, meat intake, and colon cancer, among Caucasians and African-Americans. Mut Res. 2008;644:56–63. doi: 10.1016/j.mrfmmm.2008.07.002. [DOI] [PMC free article] [PubMed] [Google Scholar]
- 22.Tanase P. Caveolin-1: a marker for pancreatic cancer diagnosis. Expert Rev Mol Diagn. 2008;8:395–404. doi: 10.1586/14737159.8.4.395. [DOI] [PubMed] [Google Scholar]
- 23.Riely GJ, Marks J, Pao W. KRAS mutations in non-small cell lung cancer. Proc Am Thorac Soc. 2009;6:201–5. doi: 10.1513/pats.200809-107LC. [DOI] [PubMed] [Google Scholar]
- 24.Bell DA. Origins and molecular pathology of ovarian cancer. Mod Pathol. 2005;(Suppl2):S19–32. doi: 10.1038/modpathol.3800306. [DOI] [PubMed] [Google Scholar]
- 25.Furukawa T, Sunamura M, Horil A. Molecular mechanisms of pancreatic carcinogenesis. Cancer Sci. 2006;97:1–7. doi: 10.1111/j.1349-7006.2005.00134.x. [DOI] [PMC free article] [PubMed] [Google Scholar]
- 26.Saif MW, Shah M. K-ras mutations in colorectal cancer: a practice changing discovery. Clin Adv Hematol Oncol. 2009;7:45–53. [PubMed] [Google Scholar]
- 27.Reimer D, Sadr S, Wiedemair A, Goebel G, Concin N, Hofstetter G, et al. Expression of the E2F family of transcription factors and its clinical relevance in ovarian cancer. Ann N Y Acad Sci. 2006;109:270–81. doi: 10.1196/annals.1378.073. [DOI] [PubMed] [Google Scholar]
- 28.Yamano Y, Uzawa K, Saito K, Nakashima D, Kasamatsu A, Koike H, et al. Identification of cisplatin-resistance related genes in head and neck squamous cell carcinoma. Int J Cancer. 2010;126:437–49. doi: 10.1002/ijc.24704. [DOI] [PubMed] [Google Scholar]
- 29.Crawford Y, Kasman I, Yu L, Zhong C, Wu X, Modrusan Z, et al. PDGF-C mediates the angiogenic and tumorigenic properties of fibroblasts associated with tumors refractory to anti-VEGF treatment. Cancer Cell. 2009;15:21–34. doi: 10.1016/j.ccr.2008.12.004. [DOI] [PubMed] [Google Scholar]
- 30.Anderberg C, Li H, Fredriksson L, Andrae J, Betsholtz C, Li X, et al. Paracrine signaling by platelet-derived growth factor-CC promotes tumor growth by recruitment of cancer-associated fibroblasts. Cancer Res. 2009;69:369–78. doi: 10.1158/0008-5472.CAN-08-2724. [DOI] [PMC free article] [PubMed] [Google Scholar]
- 31.Gal H, Pandi G, Kanner AA, Ram Z, Lithwick-Yanai G, Amariglio N, et al. MIR-451 and Imatinib mesylate inhibit tumor growth of Glioblastoma stem cells. Biochem Biophys Res Commun. 2008;376:86–90. doi: 10.1016/j.bbrc.2008.08.107. [DOI] [PubMed] [Google Scholar]
- 32.Zhou M, McFarland-Mancini MM, Funk HM, Husseinzadeh N, Mounajjed T, Drew AF. Toll-like receptor expression in normal ovary and ovarian tumors. Cancer Immunol Immunother. 2009;58:1375–85. doi: 10.1007/s00262-008-0650-y. [DOI] [PMC free article] [PubMed] [Google Scholar]
- 33.Szczepanski MJ, Czystowka M, Szajnik M, Harasymczuk M, Boyiadzis M, Kruk-Zagajewska A, et al. Triggering of Toll-like receptor 4 expressed on human head and neck squamous cell carcinoma promotes tumor development and protects the tumor from immune attack. Cancer Res. 2009;69:3105–13. doi: 10.1158/0008-5472.CAN-08-3838. [DOI] [PMC free article] [PubMed] [Google Scholar]
- 34.Zeng-Rong N, Paterson J, Alpert L, Tsao MS, Viallet J, Alaoui-Jamali MA. Elevated DNA repair capacity is associated with intrinsic resistance of lung cancer to chemotherapy. Cancer Res. 1995;55:4760–4. [PubMed] [Google Scholar]
- 35.Bosken CH, Wei Q, Amos CI, Spitz MR. An analysis of DNA repair as a determinant of survival in patients with non-small-cell lung cancer. J Natl Cancer Inst. 2002;94:1091–9. doi: 10.1093/jnci/94.14.1091. [DOI] [PubMed] [Google Scholar]
- 36.Hildebrandt MA, Gu J, Wu X. Pharmacogenomics of platinum-based chemotherapy in NSCLC. Expert Opin Drug Metab Toxicol. 2009;5:745–55. doi: 10.1517/17425250902973711. [DOI] [PMC free article] [PubMed] [Google Scholar]
- 37.Enomoto T, Weghorst CM, Inoue M, Tanizawa O, Rice JM. K-ras activation occurs frequently in mucinous adenocarcinomas and rarely in other common epithelial tumors of the human ovary. Am J Pathol. 1991;139:777–85. [PMC free article] [PubMed] [Google Scholar]
- 38.Cuatrecasas M, Erill N, Musulen E, Costa I, Matias-Guiu X, Prat J. K-ras mutations in nonmucinous ovarian epithelial tumors: a molecular analysis and clinicopathologic study of 144 patients. Cancer. 1998;82:1088–95. [PubMed] [Google Scholar]
- 39.Fujita M, Enomoto T, Murata Y. Genetic alterations in ovarian carcinoma: with specific reference to histological subtypes. Mol Cell Endocrinol. 2003;202:97–9. doi: 10.1016/s0303-7207(03)00069-8. [DOI] [PubMed] [Google Scholar]
- 40.Mayr D, Hirschmann A, Lohrs U, Diebold J. KRAS and BRAF mutations in ovarian tumors: a comprehensive study of invasive carcinomas, borderline tumors and extraovarian implants. Gynecol Oncol. 2006;103:883–7. doi: 10.1016/j.ygyno.2006.05.029. [DOI] [PubMed] [Google Scholar]
- 41.Kuo KT, Guan B, Feng Y, Mao TL, Chen X, Jinawath N, et al. Analysis of DNA copy number alterations in ovarian serous tumors identifies new molecular genetic changes in low-grade and high-grade carcinomas. Cancer Res. 2009;69:4036–42. doi: 10.1158/0008-5472.CAN-08-3913. [DOI] [PMC free article] [PubMed] [Google Scholar]
- 42.Davidson NE, Sukumar S. Of snail, mice, and women. Cancer Cell. 2005;8:173–74. doi: 10.1016/j.ccr.2005.08.006. [DOI] [PubMed] [Google Scholar]
- 43.Blechschmidt K, Sasser S, Schmalfeldt B, Schuster T, Hofler H, Becker KF. The E-cadherin repressor Snail is associated with lower overall survival of ovarian cancer patients. Br J Cancer. 2008;98:489–95. doi: 10.1038/sj.bjc.6604115. [DOI] [PMC free article] [PubMed] [Google Scholar]
- 44.Marchitti SA, Brocker C, Dimitrios S, Vasiliou V. Non-P450 aldehyde oxidizing enzymes: the aldehyde dehydrogenase superfamily. Expert Opin Drug Metab Toxicol. 2008;4:697–720. doi: 10.1517/17425250802102627. [DOI] [PMC free article] [PubMed] [Google Scholar]
- 45.Ran D, Schubert M, Pietsch L, Taubert I, Wuchter P, Eckstein V, et al. Aldehyde dehydrogenase activity among primary leukemia cells is associated with stem cell features and correlates with adverse clinical outcomes. Exp Hematol. 2009;37:1423–34. doi: 10.1016/j.exphem.2009.10.001. [DOI] [PubMed] [Google Scholar]
- 46.Cui R, Kamatani Y, Takahashi A, Usami M, Hosono N, Kawaguchi T, et al. Functional variants in ADH1B and ALDH2 coupled with alcohol and smoking synergistically enhance esophageal cancer risk. Gastroenterology. 2009;137:1768–75. doi: 10.1053/j.gastro.2009.07.070. [DOI] [PubMed] [Google Scholar]
- 47.Ginestier C, Hur MH, Charafe-Jauffret E, Monville F, Dutcher J, Brown M, et al. ALDH1 is a marker of normal and malignant human mammary stem cells and a predictor of poor clinical outcome. Cell Stem Cell. 2007;1:555–67. doi: 10.1016/j.stem.2007.08.014. [DOI] [PMC free article] [PubMed] [Google Scholar]
- 48.Otero-Rey EM, Somoza-Martín M, Barros-Angueira F, García-García A. Intracellular pH regulation in oral squamous cell carcinoma is mediated by increased V-ATPase activity via over-expression of the ATP6V1C1 gene. Oral Oncol. 2008;44:193–9. doi: 10.1016/j.oraloncology.2007.02.011. [DOI] [PubMed] [Google Scholar]
- 49.Allison SJ, Milner J. SI-RT3 is pro-apoptotic and participates in distinct basal apoptotic pathways. Cell Cycle. 2007;6:2669–77. doi: 10.4161/cc.6.21.4866. [DOI] [PubMed] [Google Scholar]
Associated Data
This section collects any data citations, data availability statements, or supplementary materials included in this article.