

Abstract
Glutamine, glutamate, asparagine, and aspartate are involved in an enzyme-network that controls nitrogen metabolism. Branched-chain-amino-acid aminotransferase-1 (BCAT1) promotes proliferation of gliomas with wild-type IDH1 and is closely connected to the network. We hypothesized that metabolism of asparagine, glutamine, and branched-chain-amino-acids is associated with progression of malignant gliomas. Gene expression for asparagine synthetase (ASNS), glutaminase (GLS), and BCAT1 were analyzed in 164 gliomas from 156 patients [33-anaplastic gliomas (AG) and 131-glioblastomas (GBM), 64 of which were recurrent GBMs]. ASNS and GLS were twofold higher in GBMs versus AGs. BCAT1 was also higher in GBMs. ASNS expression was twofold higher in recurrent versus new GBMs. Five patients had serial samples: 4-showed higher ASNS and 3-higher GLS at recurrence. We analyzed grade and treatment in 4 groups: (1) low ASNS, GLS, and BCAT1 (n = 96); (2) low ASNS and GLS, but high BCAT1 (n = 26); (3) high ASNS or GLS, but low BCAT1 (n = 25); and (4) high ASNS or GLS and high BCAT1 (n = 17). Ninety-one % of patients (29/32) with grade-III lesions were in group 1. In contrast, 95 % of patients (62/65) in groups 2–4 had GBMs. Treatment was similar in 4 groups (radiotherapy-80 %; temozolomide-30 %; other chemotherapy-50 %). High expression of ASNS, GLS, and BCAT1 were each associated with poor survival in the entire group. The combination of lower ASNS, GLS, and BCAT1 levels correlated with better survival for newly diagnosed GBMs (66 patients; P = 0.0039). Only tumors with lower enzymes showed improved outcome with temozolomide. IDH1WT gliomas had higher expression of these genes. Manipulation of amino acid metabolism in malignant gliomas may be further studied for therapeutics development.
Keywords: Asparagine, Glutamine, Branched chain amino acids, Metabolism, Glioma
Introduction
Strong metabolic support is required for proliferating cancer cells, which reprogram and upregulate their metabolism—a well established phenomenon for all malignancies, including high grade gliomas [1]. Augmented metabolic differences between gliomas and normal brain tissues can be detected with radiologic studies [2]. For example, increased uptake of radio-labeled amino acids may be useful for glioma diagnostics [3], planning neuro-surgery and radiotherapy, and for assessing treatment response [4].
Currently, there is no clinical pharmacotherapy that targets amino acid metabolism in brain tumors. Nevertheless, some pre-clinical [5–7] and early phase clinical studies [8, 9] have demonstrated conceptual proof of this principle. Expanded understanding of the details of amino acid metabolism in gliomas may provide a basis for therapeutics development.
Branched chain aminotransferase (BCAT1) promotes proliferation of gliomas that express wild-type isocitrate dehydrogenase (IDH1WT)—via amino acid catabolism [10]. BCAT1 catalyzes formation of glutamate from α-ketoglutarate (which is made from isocitrate in the Krebs cycle) (Fig. 1). In turn, glutamate, glutamine, aspartate, and asparagine take part in a network that controls nitrogen metabolism, assimilation, and transport [11, 12]. Therefore, we hypothesized that “hyper-metabolism” of asparagine, glutamine, and branched chain amino acids (BCAAs) may correlate with clinical aggressiveness of gliomas, as measured by disease progression. Because isocitrate dehydrogenase (IDH) status varies in molecular subclasses of gliomas and glioblastomas [13], it may also be reasonable to expect IDH status to be associated with different patterns of amino acid metabolism [7, 14].
Fig. 1.
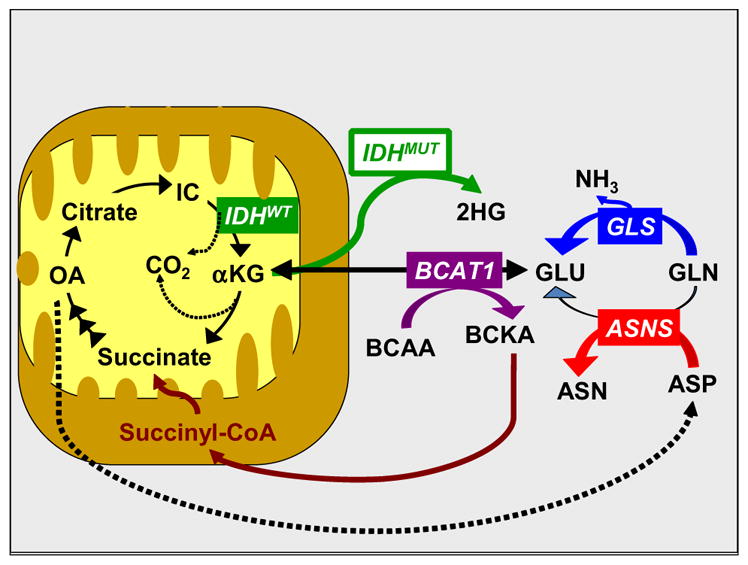
Interplay of asparagine (ASN), glutamine (GLN), and branched-chain amino acids (BCAAs) in a metabolic network that affects mitochondrial energy production and nitrogen utilization. Other abbreviations: ASNS asparagine synthetase, ASP aspartate, BCAT1 branched chain amino-acid aminotransferase 1, BCKA branched chain ketoacids, GLU glutamate, GLS glutaminase, IC isocitrate, IDHWT isocitrate dehydrogenase, wild type, IDHMUT isocitrate dehydrogenase, mutated, 2HG 2-hydroxyglutarate, OA oxaloacetate
Genes encoding key enzymes for amino acid metabolism may be up-regulated in gliomas, either genetically or by epigenetic changes [15]. The current study focuses on analysis of selected genes from an existing microarray database of malignant gliomas. In particular, we focused on ASNS, GLS, and two isoenzymes of BCAT1, each of which has an established role in malignant growth. ASNS is a glutamine-dependent amidotransferase, in which one active site hydrolyzes glutamine to ammonium ion and glutamate, and a second active site incorporates ammonium into asparagine [16]. In this way, ASNS expression leads to de-novo asparagine biosynthesis and appears to be a component of solid tumor adaptation to nutrient deprivation and/or hypoxia [11, 17]. GLS catalyzes the release of the amide group of glutamine as free ammonium, thereby converting glutamine to glutamate, which contributes to nucleotide [12] and α-ketoglutarate [7] biosynthesis. For this reason, GLS inhibition has been proposed as a potential therapeutic strategy for some gliomas [7]. Similarly, BCAT1 has been shown to have a central role in glioma pathogenesis, making BCAA metabolism another potential target for glioblastoma therapeutics development [10]. Here, we show that these enzymes appear to be associated with clinical aggressiveness and recurrence of malignant gliomas, as well as with progression of newly diagnosed GBMs. In addition, IDH1WT gliomas have higher expression of all of these genes.
Materials and methods
Probesetanalyzer database, microarray data, and clinical data collection
A database of 164 malignant gliomas from 156 adult patients diagnosed between 1980 and 2004 was used for this study. Gene expression information for selected amino acid-metabolizing enzymes was extracted and analyzed in relation to tumor grade, treatment, and outcome. Data on histopathology, age, sex, survival, and progression time from diagnosis were collected for all 156 patients. A subset of these patients has been reported previously [18], and additional information and publications are available in multi-institutional probesetanalyzer.com website [19].
Microarray data [CEL files (Affymetrix, Santa Clara, CA)] were available from the probesetanalyzer.com database [19]. Acquisition of tumors was previously conducted according to protocols approved by institutional review boards. Neuropathology grading of samples obtained from surgeries was performed according to WHO criteria. Glioblastomas were all grade IV, and anaplastic tumors were grade III.
This study focuses on three enzymes that we believe could be central in an amino-acid metabolic network, as depicted in Fig. 1. In addition, mitochondrial BCAT2 and glutamine synthetase expression levels were screened, but these showed no significant correlation with disease aggressiveness (Supplementary material, Fig. S1). BCAT1 had two isoenzymes (or probes), which showed similar trends and are represented here as BCAT1-U and BCAT1-C (unique and common, respectively). GLS had 5 probes, which also showed similar trends on initial screening. The GLS probe with high signal was used as the representative probe for the final analysis.
Statistical methods
Two-tailed student t-tests were used for comparing effects of gene expression levels between different subgroups. Kaplan–Meier survival curves were generated for survival analysis. Overall survival (time to survival) and progression-free survival (time to progression) durations were calculated from the date of diagnostic sampling surgery to the date when the patient expired or had a documented recurrence, respectively. Patients who were alive or progression free at the time of this analysis (June 2014) were counted as censored. Log-rank P values less than 0.05 were considered statistically significant.
First, we determined conditional cut-off values for high versus low gene expression for dichotomization, based on their most substantial effect on clinical outcome as a single variable (Supplementary material, Table S1). Further, we analyzed grade and treatment in 4 groups for all samples and patients:
Low ASNS, GLS, and BCAT1: 96 samples from 91 patients
Low ASNS and GLS, but high BCAT1 (one or two isoenzymes): 26 samples from 24 patients
High ASNS and/or GLS, but low BCAT1: 25 samples from 24 patients
High ASNS or GLS, and high BCAT1: 17 samples from 17 patients.
Thorough survival analyses in relation to ASNS, GLS, and BCAT1 expression levels within a more homogeneous sub-group—66 newly diagnosed GBMs—were also carried out. Specifically, we compared two subgroups of newly diagnosed GBM cases that showed low gene expression for all three enzymes (n = 36, as in group 1 described above) versus high gene expression for one or more enzymes (n = 30, from groups 2, 3 and 4).
To evaluate effects of TMZ treatment, we further classified the 66 newly diagnosed GBMS patients into four groups: High Enzymes + no TMZ, High Enzymes + TMZ, Low Enzymes + no TMZ and Low Enzymes + TMZ. Progression-free survival and overall survival were compared by use of the log-rank test for equality across strata. The test statistic was compared with a χ2 distribution with 3 degrees of freedom.
Multivariate survival analysis was then carried out to evaluate the potential effect of treatment, age, and sex on the difference of survival probability between the low and high gene expression groups.
IDH data
IDH data was obtained for a subset of the samples based on availability. IDH mutations were determined as part of a separate project, as described elsewhere [20, 21]. Briefly, for IDH1 and IDH2 sequencing, genomic DNA was isolated from formalin-fixed paraffin-embedded or frozen tissue using the Recoverall Total Nucleic Acid Isolation Kit (Invitrogen, Grand Island, NY). Sequences of IDH1 at residue 132 (R132 for wild type, CGT) and IDH2 at residue 172 (R172 for wild type, AGG) were determined by Sanger sequencing with the following primers: IDH1 (forward, 5′-gcgtcaaatgtgccactatc-3′ and reverse, 5′-gcaaaatcacattattgc-caac-3′) and IDH2 (forward, 5′-CTCACAGAGTTCAAGC TGAAG-3′ and reverse, 5′-CTGTGGCCTTGTACTGCA GAG-3′). Purified PCR products were sequenced using BigDye Terminator v1.1 and analyzed on a 3730 sequencer (both Applied Biosystems). For some samples sequences around codon 140 of IDH2 were also obtained (R140 for wild type, CGG).
Results
Patient characteristics and samples
There were 131 glioblastoma (GBM; 64 recurrent), 11 anaplastic astrocytoma (AA), 11 anaplastic mixed glioma (AMG), and 11 anaplastic oligodendroglioma (AO) samples obtained for gene expression assays (Table 1). For the analyses below, the last three groups (AA, AMG, and AO) are combined into one category, called anaplastic gliomas (AGs, all grade III; n = 33), due to the small sample sizes. Samples were collected from 156 patients (70 female, 86 male). The average age at diagnosis was 48 ± 16 (SDEV). Eight patients had 2 samples each, and the remaining 148 patients had a single sample. Table 1 summarizes patient characteristics, samples, and overall treatment.
Table 1.
Patient characteristics
| Patients | Tumor specimens | |
|---|---|---|
| Sample size | 156 | 164 |
| Age at diagnosis (±SD), years | 48 ± 16 | |
| Age at death or last follow-up (±SD), years | 52.4 ± 14 | |
| Female/male (%) | 70/86 (44.9/55.1) | |
| Pathology | ||
| Newly diagnosed GBM | 66 | 67a |
| Newly diagnosed anaplastic | 23 | 23 |
| Recurrent GBM | 58 | 64b |
| Recurrent anaplastic | 9 | 10c |
| Treatment | ||
| Radiation only | 50 | |
| Radiation + adjuvant chemotherapy | 33 | |
| TMZd + radiation + adjuvant chemotherapy | 41 | |
| TMZd + adjuvant chemotherapy | 4 | |
| Adjuvant chemotherapy | 3 | |
| Surgery only | 25 | |
One patient with newly diagnosed GBM had 2 samples from the same surgery
Three newly diagnosed patients had 2nd specimens as recurrent GBM. Another 3 patients with recurrent GBM had dual samples
One patient with recurrent AMG had 2 samples from the same surgery
Temozolomide administered upfront
Mean ± SDEV, maximum, minimum, and cut-off values for low versus high ASNS, GLS, BCAT1U, and BCAT1C expression levels are shown in Supplementary material, Table S1. Significant Pearson correlation coefficients (shown in Supplementary material, Table S2 and adjunct scattered plot matrix) demonstrated strong correlations among all 4 genes (P < 0.0001 for all pairs except ASNS versus BCAT1C, for which P = 0.0091).
Higher expression of ASNS, GLS, and BCAT1 in GBMs
Values for asparagine synthetase (ASNS) and glutaminase (GLS) expression were approximately twofold higher in GBMs versus AGs samples (mean ± SEM, 693 ± 61 versus 333 ± 35, P = 0.0001 for ASNS; 123 ± 9 versus 64 ± 4.4, P < 0.0001 for GLS; Fig. 2a). ASNS expression was also twice as high in recurrent versus newly diagnosed GBMs (927 ± 112 versus 468 ± 37, P = 0.0002; Fig. 2a). In addition, GBM samples obtained in the first recurrence (n = 25) showed a trend for lower ASNS expression, compared to tumors sampled from second (or later) GBM recurrences (656 versus 1103, P = 0.05). Expression levels of two isoenzymes of cytosolic BCAT1 (unique and common, but not mitochondrial BCAT2) were also higher in GBMs versus AGs (for BCAT1-U, 107 ± 19 versus 20 ± 2; for BCAT1-C, 131 ± 8.8 versus 88 ± 5.3; P = 0.0001 for both comparisons; Fig. 2a).
Fig. 2.

a Expression of asparagine synthetase (ASNS), glutaminase (GLS), and branched chain aminotransferases (BCAT1) in anaplastic gliomas (AG) versus glioblastomas (GBM), and expression of ASNS in newly diagnosed versus recurrent GBMs. GBMs have higher expression of all of these genes, compared to AGs. Recurrent GBMs have higher ASNS expression, compared to newly diagnosed GBMs. *P values (t test) are significant. b Asparagine synthetase (ASNS), glutaminase (GLS), and BCAT1, branched chain amino-acid aminotransferase expression in paired samples obtained from individual patients. ASNS expression was increased in 4 recurrences. GLS expression was increased in 3 recurrences. The horizontal axis indicates the diagnoses at dual surgeries, for each patient. AO, anaplastic oligodendroglioma; AMG, anaplastic mixed glioma, GBM, glioblastoma
Patients with duplicate samples
Among 8 patients with 2 samples, 3 had samples from the same surgery (1 AMG and 2 GBMs). The other 5 patients had samples obtained from different surgeries. Four pairs demonstrated a several fold increase of ASNS and BCAT1-U, and 3 pairs showed increased GLS expression with disease progression (Fig. 2b; Supplementary material, Table S3). Four out of the 5 patients with repeat sampling had GBMs found at both surgeries. The other patient originally had an anaplastic oligodendroglioma that was upgraded to a GBM on repeat surgery, after a recurrence. The recurrent tumor demonstrated up-regulation of all 3 genes.
Average gene expression levels were calculated for all paired samples. The averages for these 8 patients were used for sub-grouping the tumors according to low versus high gene expression.
Subgroups according to ASNS, GLS, and BCAT1 gene expression
The majority of patients in groups 2, 3, and 4 (62/65 = 95 %) had tumors that were grade IV (GBM). On the other hand, most of the patients with grade III lesions (AGs) had tumors in group 1 (29/32 = 91 %). Overall, 80 % of patients received radiotherapy, 30 % were treated with temozolomide, and 50 % had other chemotherapy. Distributions of the different combinations were comparable among the 4 groups (Tables 2 and 3).
Table 2.
Treatment of tumors in the four enzyme expression groups (based on expression levels of ASNS, GLS, and BCAT1): all tumors
| Group | Grade | Treatment | ||||
|---|---|---|---|---|---|---|
|
|
|
|||||
| IV | III | XRT or chemotherapy only | XRT + adjuvant | XRT + adjuvant + TMZ | Surgery only | |
| 1 (91)a | 62 | 29 | 32 | 18 | 23 | 18 |
| 2 (24) | 22 | 2 | 9 | 4 | 7 | 4 |
| 3 (24) | 23 | 1 | 11 | 6 | 7 | 0 |
| 4 (17) | 17 | 0 | 5 | 5 | 4 | 3 |
| All (156) | 124 | 32 | 57 | 33 | 41 | 25 |
See “Materials and methods” section for definitions of the 4 groups. Group 1 consists of tumors with low expression of ASNS, GLA, and BCAT1. Groups 2, 3, and 4 consist of tumors with high expression of at least one of these genes
Numbers in parentheses are the numbers of patients in the indicated group
Table 3.
Treatment of tumors in the four enzyme expression groups (based on expression levels of ASNS, GLS, and BCAT1): newly diagnosed GBMs only
| Group | Age | F/M | Treatment | ||
|---|---|---|---|---|---|
|
| |||||
| Surgery only | Surgery + othera | Combinationb | |||
| 1 (36) | 54 ± 14.8 | 21/15 | 5 | 12 | 19 [11] |
| 2 (15) | 1 | 9 | 5 [5] | ||
| 3 (9) | 58.3c ± 11 | 7/23 | 0 | 1 | 8 [6] |
| 4 (6) | 2 | 1 | 3 [3] | ||
| All (66) | P = 0.2d | 28/38 | 8 | 23 | 35 [25] |
See “Materials and methods” section for definitions of the 4 groups. Group 1 consists of tumors with low expression of ASNS, GLA, and BCAT1. Groups 2, 3, and 4 consist of tumors with high expression of at least one of these genes
Treatment in this column consisted of surgery with XRT or adjuvant chemotherapy (with or without TMZ)
Treatment in this column consisted of surgery with XRT and adjuvant chemotherapy (with or without TMZ). Numbers in square brackets indicate the numbers of patients who received all 4 modalities of treatment
Mean age for groups 2, 3, and 4 combined
P value for the comparison of age between group 1 and groups 2, 3, and 4 combined (not statistically significant)
All 20 patients who were alive during this analysis (June 2014), were in group 1. Six had grade IV, and 14 had grade III tumors (3 AOs, 6 AMGs, and 5 AAs). In these 20 survivors, there were 9 tumors with an IDH1 mutation. (Among the other 11 tumors, 6 had wild type IDH1, and 5 had unknown IDH status.) IDH2 status was checked in 3 of these 20 tumors. One had an IDH2 mutation (and wild type IDH1), and another had mutated IDH1 (and wild type IDH2). A third tumor was wild type for both IHD1 and IDH2.
Survival
The median time to survival among newly diagnosed GBM patients was 1.05 years (25th percentile, 0.72 years; 75th percentile, 2.09 years). Five patients were censored. The median progression time was 0.52 years (25th percentile, 0.26 years; 75th percentile, 0.86 years). All of the patients with 2 samples received radiation and were deceased by 3.2 years after diagnosis.
Poorer survival with higher ASNS, GLS, and BCAT1 gene expression
Higher ASNS, GLS, and BCAT1 expression levels were each associated with poorer survival in all 156 patients (Supplementary material, Table S1). Thorough survival analyses based on ASNS, GLS, and BCAT1 levels within a more homogeneous sub-group of newly diagnosed GBMs were also carried out (n = 66). Tumors that had the combination of low ASNS, GLS, and BCAT1 levels were associated with better overall survival (log-rank P = 0.0039) and progression-free survival (log-rank P = 0.043), compared to tumors with high expression of one (or more) of the enzymes (Fig. 3a, b).
Fig. 3.
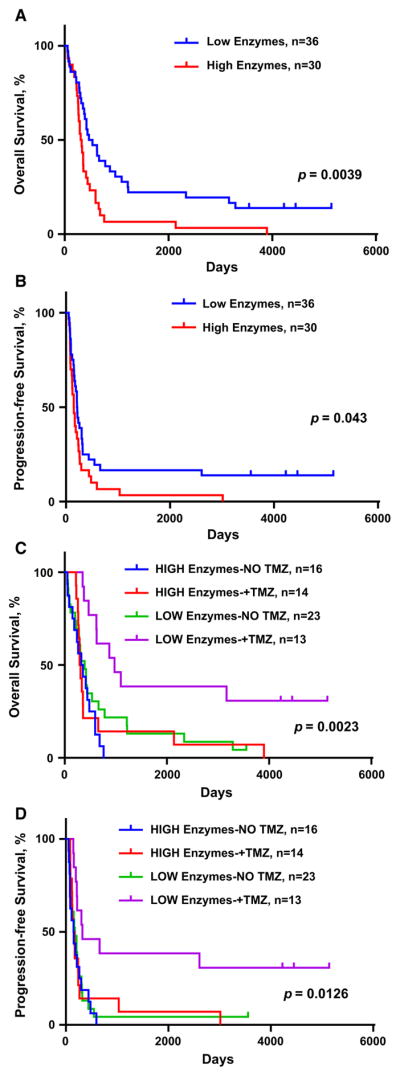
Kaplan-Meier survival curves for 66 newly diagnosed GBMs in relation to expression of ASNS, GLS, and BCAT1, and to temozolomide (TMZ) treatment. a and b. Reduced overall survival (OS) and progression-free survival (PFS) of patients with newly diagnosed GBM whose tumors had higher expression of ASNS, GLS, and BCAT1. c and d. Increased OS and PFS with TMZ treatment in the low enzyme expression group only. Log rank P values are shown
Treatment
Patients received standard of care therapies, although variable. Administered therapies included radiotherapy, “upfront temozolomide” (TMZ, started soon after surgery and pathological confirmation of diagnosis), different adjuvant chemotherapy, or various combinations of these modalities. Such variability was considered to potentially affect survival outcomes in subgroups. Therefore, we compared therapies used, in relation to enzyme expression levels (Tables 2 and 3). Proportions of various combinations of therapies were comparable among the groups. For example, in both low and high enzyme expression groups, 53 % of patients received XRT + adjuvant chemotherapy, with or without upfront TMZ. Proportions of patients without XRT + chemotherapy, or only one or the other, were also comparable. However, 46 % of patients received all 3 in the high group, versus only 30 % in the low group. In summary, the high enzyme expression group patients received at least similar—if not more therapy, supporting a conclusion that poorer survival is unlikely to be due to delivery of less therapy.
The most dramatic therapeutic variable affecting outcome was administration of upfront temozolomide (TMZ). Only patients with low enzyme expression appear to statistically benefit from upfront TMZ administration (Fig. 3c, d, Supplementary material, Fig. S2).
A higher proportion of patients with newly diagnosed GBM with high enzyme expression were treated with upfront TMZ, compared to the proportion for newly diagnosed GBM with low enzyme expression (47 vs. 36 %). (Diagnostic surgeries for those who received upfront TMZ occurred during 2000–2004. The surgeries for those without upfront TMZ occurred during 1996–2004). Seventeen out of 30 (57 %) with high enzymes were diagnosed and treated after 2000—with more frequent upfront TMZ—compared to 14 out of 36 (39 %) with low enzymes. These percentages support an interpretation that worse survival in the high enzyme expression group is not due to differences in treatment over time, such as use of upfront TMZ.
Multivariate analysis
Multivariate survival analysis was used to compare the low versus high gene expression groups in relation to treatment, age, and sex. Results suggested that younger age-at-diagnosis and upfront TMZ treatment both significantly correlated with better overall survival (P <0.0001 and P = 0.03, respectively). Only age-at-diagnosis significantly affected time to progression (P = 0.0016). However, age was not significantly different between low versus high gene expression groups (Table 3). Even after adjusting for all potential confounders, we found a significant difference in time to survival between low versus high gene expression groups (Hazard ratio = 1.896, P = 0.017). Sex did not affect outcome.
IDH Status, amino acid metabolizing genes and survival
IDH status was analyzed in 85 patient samples (out of 156) based on availability. Thirty-one had IDH mutations. Only 1 specimen contained an IDH2 mutation, whereas 30 had an IDH1 mutation. Nine out of 31 specimens with an IDH mutation had GBM, compared to 51 out of 54 for IDH1WT. Twenty-four had wild type IDH1 and IDH2. An additional 30 patients had IDH1 data only (showing IDH1WT, with unknown IDH2 status). Expression levels of ASNS, GLS and BCAT1 were averaged in these 3 groups, and were found to be lower in IDH mutated samples compared to IDH1WT and/or IDH2WT (Table 4). IDH was tested in 25 AGs (out of 33), and 22 had an IDH-1 mutation. Thirty-nine out of 66 primary GBMs had IDH testing done, and there were only 4 with an IDH mutation. For the 35 patients with a new GBM and wild type IDH, there was superior survival with low enzyme expression versus high (Supplementary material, Fig. S2). Survival curves for these 35 patients resembled curves seen for all 66 new GBM patients (including 27 with unknown IDH status; Fig. 3a).
Table 4.
Treatment of tumors in the four enzyme expression groups (based on expression levels of ASNS, GLS, and BCAT1): expression of ASNS, GLS, BCAT1-U, and BCAT1-C in relation to IDH status (wild type or mutant)
| IDH statusa | Tumors | ASNS | GLS | BCAT1-U | BCAT1-C |
|---|---|---|---|---|---|
| Wild type IDH1 and IDH2 | 24b | 624 ± 140c | 110 ± 13 | 82 ± 15 | 133 ± 12 |
| Mutant IDH | 31d | 377 ± 52 | 75 ± 6.8 | 24 ± 5.5 | 83 ± 5 |
| P = 0.055e | P = 0.01 | P = 0.0003 | P = 0.0001 | ||
| P = 0.053f | P = 0.02 | P = 0.005 | P = 0.002 | ||
| Wild type IDH1 only | 30 g | 536 ± 81 | 100 ± 10 | 68 ± 15 | 124 ± 12 |
| P = 0.3e | P = 0.3 | P = 0.27 | P = 0.29 |
“Wild type” indicates R132 (CGT) for IDH1 and R172 (AGG) for IDH2
All tumors were GBMs
Mean ± standard error
Tumors included 9 with GBM and 22 anaplastic gliomas (AG)
The P value shown is for comparison to the corresponding value in the “Wild type IDH1 and IDH2” row (t-test)
P values for mutant IDH versus Wild type IDH1 only
Tumors included 27 with GBM and 3 AG
Oncogenes, tumor suppressors, MGMT status, and amino acid metabolism
Expression of relevant oncogenes and tumor suppressors that are central in defining GBM subtypes (i.e., EGFR, PDGFR, p53, NF1 and Rb) were also compared in low versus high AA-metabolizing enzyme expressing glioblastoma samples. Although expression of both oncogenes and tumor suppressor genes were slightly higher in high enzyme tumors (Supplementary material, Fig. S3F), none of these genes played a role in outcome of patients, as a single variable (Supplementary material, Figs. S3A–E) in the dataset of newly diagnosed GBMs.
Data on methylguanine methyltransferase (MGMT) methylation status were available for a subset of the samples (n = 35, only 18 with glioblastoma). Overall, methylated MGMT status was associated with IDH1 mutation and low AA-enzyme expression, all of which are interrelated and predict better overall survival (Supplementary material, Table S4). In contrast, unmethylated MGMT (predominantly wild type IDH) is associated with higher AA-enzymes and worse patient survival. Remarkably, even within a subgroup of newly diagnosed IDHWT GBMs—all unmethylated and treated with upfront temozolomide—the effect of high versus low AA-metabolizing enzymes on overall survival remained persistently significant (P = 0.037 by the Gehan–Breslow–Wilcoxon test, Supplementary material, Fig. S4).
Discussion
Glioblastoma continues to result in very poor outcomes [22], although considerable efforts have been invested in non-surgical strategies, such as DNA damaging agents [23], anti-angiogenesis, signaling inhibition [24], and immunotherapy research [25]. Cancers can be partly viewed as metabolic diseases, and brain cancer is not an exception to this concept [26]. For example, targeting mitochondrial metabolism in cancer is an emerging therapeutic strategy [27], and manipulation of amino acid metabolism is a standard of care for some hematological cancers [28]. Greater knowledge of amino acid metabolism in gliomas may make these tumors another target for such treatment.
Our study demonstrates a potential link between production of selected amino acid metabolizing enzymes and clinical outcome. First, we have shown that GBMs had higher expression of ASNS, GLS, and BCAT1, compared to AGs. Second, progressive disease necessitating repeat surgery often demonstrated increased gene expression in the small number of paired samples available. Further, recurrent GBMs had even higher ASNS expression. And finally, newly diagnosed GBMs showed poorer survival, if any of these 3 genes had increased expression. These findings collectively point to a link between augmented metabolism of certain amino acids and clinico-pathological aggressiveness of malignant gliomas.
Limitations of our retrospective study include the small number of paired samples and analysis of selected genes. In addition, the patient population is heterogeneous, due to inclusion of newly diagnosed and recurrent tumors, as well as differences in the therapy. Specially, older samples were collected before chemo-radiation with temozolomide became the standard of care. Nevertheless, the results lay a platform for further analysis of larger GBM gene expression databases, such as TCGA [29].
Strong statistical correlation among the investigated genes supports an interpretation of a tightly inter-connected amino acid metabolic network (composed of at least the 3 enzymes investigated here). Variation in gene expression for the enzymes in this network appears capable of affecting clinical outcome, independent of treatment with temozolomide—the most widely used standard therapy [30]. This aspect of our findings deserves emphasis, due to its potentially significant implications for therapeutics development. These results support the need for future preclinical studies, such as protein measurements by immunohistochemistry, cell cultures to address selective pressures, and mouse experiments. Such experiments may further support the hypothesis that aggressiveness of gliomas is related to up-regulation of these enzymes. Our laboratory has shown that ASNase may potentiate the cytotoxic effect of chemotherapy against brain tumors, and that ASNase-resistant glioblastoma cells had elevated levels of ASNS mRNA [6]. Future efforts may also be directed to analyzing amino acid metabolism in the context of signaling pathway heterogeneity. For example, the association between the PI3 K/mTOR pathway and amino acid metabolism is being elucidated [12, 31]. EGFR mutated versus wild type GBMs appear to exhibit variable activation of this pathway [32]. Thus, one may hypothesize occurrence of distinct amino acid metabolism patterns for EGFR mutated versus wild type GBMs.
As part of preliminary efforts to address amino acid metabolism in 4 TCGA subtypes of GBMs, we examined expression of ASNS, BCAT1, and GLS by use of the R2: Genomics Analysis and Visualization Platform dataset (http://r2.amc.nl) [33]. ASNS and GLS have comparable expression levels throughout all 4 TCGA subtypes, whereas BCAT1 expression appears higher in classical and mesenchymal subtypes (Supplementary material, Fig. S5). This observation is compatible with wild type IDH in classical and mesenchymal subtypes. Wild type IDH has been shown to be associated with BCAT1-promoting GBM cell proliferation [10].
Only 54 % of samples had IDH testing done due to the sample limitations. However, analysis of the 35 patients with new GBM and confirmed wild type IDH also shows better survival for tumors with low enzyme expression levels, compared to high levels of ASNS, GLS, and/or BCAT1 (Supplementary material, Fig. S2). These findings tend to support an association between nitrogen metabolizing enzymes and survival in most of the GBMs, which are mainly IDHWT.
In conclusion, these findings support an emerging need for testing novel adjuvant strategies that target various aspects of amino acid metabolism in GBM—such as BCAT1 or GLS inhibition or asparagine metabolism. Some of these inhibitors are already in pre-clinical testing [34], and manipulation of asparagine metabolism has been established as a vital part of treatment for acute lymphoblastic leukemia [28].
Supplementary Material
Abbreviations
- AA
Anaplastic astrocytoma
- AG
Anaplastic glioma
- AMG
Anaplastic mixed glioma
- AO
Anaplastic oligodendroglioma
- ASN
Asparagine
- ASNS
Asparagine synthetase
- BCAA
Branched chain amino acids
- BCAT
Branched chain amino-acid aminotransferase
- GBM
Glioblastoma multiforme
- GLN
Glutamine
- GLS
Glutaminase
- IDH
Isocitrate dehydrogenase
- IDH1WT
Isocitrate dehydrogenase 1, wild type
Footnotes
Electronic supplementary material The online version of this article (doi:10.1007/s11060-016-2073-5) contains supplementary material, which is available to authorized users.
Funding None.
Compliance with ethical standards
Conflict of Interest Eduard H. Panosyan: Consultation and compensation from: Baxter, Octapharma, CSL Behring, Jazz Pharmaceuticals. Joseph L. Lasky: Consultation and compensation from: Baxter, Octapharma, CSL Behring. Henry J. Lin: None. Albert Lai: Consultancy with Genentech/Roche, research funding from Takeda/Millennium and Genentech/Roche. Yang Hai: None. Xiuqing Guo: None. Michael Quinn: Contracts with the following academic medical centers: Ronald Reagan UCLA Medical Center, Keck School of Medicine of University of Southern California and Kaiser Permanente. No industry sponsored contracts. Stanley F. Nelson: None. Timothy F. Cloughesy: Consultant with and compensation from: Roche, Genentech, Upshire Smith, VBL, Abbvie, Nektar, Novocure, Tocagen, Notable labs, Novartis, Celgene, Lpath, Proximagen, Amgen, Newgen. Expert testimony: Roche. Phioanh L. Nghiemphu: None.
References
- 1.Wolf A, Agnihotri S, Guha A. Targeting metabolic remodeling in glioblastoma multiforme. Oncotarget. 2010;1(7):567. doi: 10.18632/oncotarget.190. [DOI] [PMC free article] [PubMed] [Google Scholar]
- 2.la Fougère C, Suchorska B, Bartenstein P, Kreth F-W, Tonn J-C. Molecular imaging of gliomas with PET: opportunities and limitations. Neuro-Oncology. 2011;13:806–819. doi: 10.1093/neuonc/nor054. [DOI] [PMC free article] [PubMed] [Google Scholar]
- 3.Langen K-J, Tatsch K, Grosu A-L, Jacobs AH, Weckesser M, Sabri O. Diagnostics of cerebral gliomas with radiolabeled amino acids. Dtsch Arztebl Int. 2008;105:55–61. doi: 10.3238/arztebl.2008.0055. [DOI] [PMC free article] [PubMed] [Google Scholar]
- 4.Galldiks N, Langen K. Applications of PET imaging of neurological tumors with radiolabeled amino acids. Q J Nucl Med Mol Imaging. 2014;59(1):70–82. [PubMed] [Google Scholar]
- 5.Dranoff G, Elion GB, Friedman HS, Bigner DD. Combination chemotherapy in vitro exploiting glutamine metabolism of human glioma and medulloblastoma. Cancer Res. 1985;45:4082–4086. [PubMed] [Google Scholar]
- 6.Panosyan EH, Wang Y, Xia P, Lee W-NP, Pak Y, Laks DR, Lin HJ, Moore TB, Cloughesy TF, Kornblum HI, Lasky JL. Asparagine depletion potentiates the cytotoxic effect of chemotherapy against brain tumors. Mol Cancer Res. 2014;12:694–702. doi: 10.1158/1541-7786.mcr-13-0576. [DOI] [PMC free article] [PubMed] [Google Scholar]
- 7.Seltzer MJ, Bennett BD, Joshi AD, Gao P, Thomas AG, Ferraris DV, Tsukamoto T, Rojas CJ, Slusher BS, Rabinowitz JD, Dang CV, Riggins GJ. Inhibition of glutaminase preferentially slows growth of glioma cells with mutant IDH1. Cancer Res. 2010;70:8981–8987. doi: 10.1158/0008-5472.can-10-1666. [DOI] [PMC free article] [PubMed] [Google Scholar]
- 8.Taylor SA, Crowley J, Pollock TW, Eyre HJ, Jaeckle C, Hynes HE, Stephens RL. Objective antitumor activity of acivicin in patients with recurrent CNS malignancies: a Southwest Oncology Group trial. J Clin Oncol. 1991;9:1476–1479. doi: 10.1200/JCO.1991.9.8.1476. [DOI] [PubMed] [Google Scholar]
- 9.Chang SM, Kuhn JG, Robins HI, Schold SC, Spence AM, Berger MS, Mehta MP, Bozik ME, Pollack I, Schiff D, Gilbert M, Rankin C, Prados MD. Phase II study of phenylacetate in patients with recurrent malignant glioma: a North American brain tumor consortium report. J Clin Oncol. 1999;17:984. doi: 10.1200/JCO.1999.17.3.984. [DOI] [PubMed] [Google Scholar]
- 10.Tonjes M, Barbus S, Park YJ, Wang W, Schlotter M, Lindroth AM, Pleier SV, Bai AHC, Karra D, Piro RM, Felsberg J, Addington A, Lemke D, Weibrecht I, Hovestadt V, Rolli CG, Campos B, Turcan S, Sturm D, Witt H, Chan TA, Herold-Mende C, Kemkemer R, Konig R, Schmidt K, Hull W-E, Pfister SM, Jugold M, Hutson SM, Plass C, Okun JG, Reifenberger G, Lichter P, Radlwimmer B. BCAT1 promotes cell proliferation through amino acid catabolism in gliomas carrying wild-type IDH1. Nat Med. 2013;19:901–908. doi: 10.1038/nm.3217.html#supplementary-information. [DOI] [PMC free article] [PubMed] [Google Scholar]
- 11.Balasubramanian MN, Butterworth EA, Kilberg MS. Asparagine synthetase: regulation by cell stress and involvement in tumor biology. 2013;304(8):E789–E799. doi: 10.1152/ajpendo.00015.2013. [DOI] [PMC free article] [PubMed] [Google Scholar]
- 12.Wise DR, Thompson CB. Glutamine addiction: a new therapeutic target in cancer. Trends Biochem Sci. 2010;35:427–433. doi: 10.1016/j.tibs.2010.05.003. [DOI] [PMC free article] [PubMed] [Google Scholar]
- 13.Agnihotri S, Aldape KD, Zadeh G. Isocitrate dehydrogenase status and molecular subclasses of glioma and glioblastoma. Neurosurg Focus. 2014;37:E13. doi: 10.3171/2014.9.focus14505. [DOI] [PubMed] [Google Scholar]
- 14.Reitman ZJ, Jin G, Karoly ED, Spasojevic I, Yang J, Kinzler KW, He Y, Bigner DD, Vogelstein B, Yan H. Profiling the effects of isocitrate dehydrogenase 1 and 2 mutations on the cellular metabolome. Proc Natl Acad Sci. 2011;108:3270–3275. doi: 10.1073/pnas.1019393108. [DOI] [PMC free article] [PubMed] [Google Scholar]
- 15.Venneti S, Thompson CB. Metabolic modulation of epi-genetics in gliomas. Brain Pathol. 2013;23:217–221. doi: 10.1111/bpa.12022. [DOI] [PMC free article] [PubMed] [Google Scholar]
- 16.Bender DA. Amino acid metabolism. Wiley; New York: 2012. Amino acids synthesized from glutamate: glutamine, proline, ornithine, citrulline and arginine; pp. 157–223. [Google Scholar]
- 17.Zhang J, Fan J, Venneti S, Cross Justin R, Takagi T, Bhinder B, Djaballah H, Kanai M, Cheng Emily H, Judkins Alexander R, Pawel B, Baggs J, Cherry S, Rabinowitz Joshua D, Thompson Craig B. Asparagine plays a critical role in regulating cellular adaptation to glutamine depletion. Mol Cell. 2014;56:205–218. doi: 10.1016/j.molcel.2014.08.018. [DOI] [PMC free article] [PubMed] [Google Scholar]
- 18.Lee Y, Scheck A, Cloughesy T, Lai A, Dong J, Farooqi H, Liau L, Horvath S, Mischel P, Nelson S. Gene expression analysis of glioblastomas identifies the major molecular basis for the prognostic benefit of younger age. BMC Med Genom. 2008;1:52. doi: 10.1186/1755-8794-1-52. [DOI] [PMC free article] [PubMed] [Google Scholar]
- 19.http://probesetanalyzer.com/
- 20.Mareninov S, De Jesus J, Sanchez D, Kay A, Wilson R, Babic I, Chen W, Telesca D, Lou J, Mirsadraei L, Gardner T, Khanlou N, Vinters H, Shafa B, Lai A, Liau L, Mischel P, Cloughesy T, Yong W. Lyophilized brain tumor specimens can be used for histologic, nucleic acid, and protein analyses after 1 year of room temperature storage. J Neurooncol. 2013;113:365–373. doi: 10.1007/s11060-013-1135-1. [DOI] [PMC free article] [PubMed] [Google Scholar]
- 21.Chou AP, Chowdhury R, Li S, Chen W, Kim AJ, Piccioni DE, Selfridge JM, Mody RR, Chang S, Lalezari S, Lin J, Sanchez DE, Wilson RW, Garrett MC, Harry B, Mottahedeh J, Nghiemphu PL, Kornblum HI, Mischel PS, Prins RM, Yong WH, Cloughesy T, Nelson SF, Liau LM, Lai A. Identification of retinol binding protein 1 promoter hypermethylation in isocitrate dehydrogenase 1 and 2 mutant gliomas. J Natl Cancer Inst. 2012;104:1458–1469. doi: 10.1093/jnci/djs357. [DOI] [PMC free article] [PubMed] [Google Scholar]
- 22.Weller M, Cloughesy T, Perry JR, Wick W. Standards of care for treatment of recurrent glioblastoma—are we there yet? Neuro-Oncology. 2013;15:4–27. doi: 10.1093/neuonc/nos273. [DOI] [PMC free article] [PubMed] [Google Scholar]
- 23.Squatrito M, Holland EC. DNA damage response and growth factor signaling pathways in gliomagenesis and therapeutic resistance. Cancer Res. 2011;71:5945–5949. doi: 10.1158/0008-5472.can-11-1245. [DOI] [PubMed] [Google Scholar]
- 24.Khasraw M, Ameratunga MS, Grant R, Wheeler H, Pavlakis N. Antiangiogenic therapy for high-grade glioma. Cochrane Database Syst Rev. 2014;9:CD008218. doi: 10.1002/14651858.CD008218.pub3. [DOI] [PubMed] [Google Scholar]
- 25.Patel M, Kim J, Ruzevick J, Li G, Lim M. The future of glioblastoma therapy: synergism of standard of care and immunotherapy. Cancers. 2014;6:1953–1985. doi: 10.3390/cancers6041953. [DOI] [PMC free article] [PubMed] [Google Scholar]
- 26.Marie SKN, Shinjo SMO. Metabolism and brain cancer. Clinics. 2011;66:33–43. doi: 10.1590/S1807-59322011001300005. [DOI] [PMC free article] [PubMed] [Google Scholar]
- 27.Weinberg SE, Chandel NS. Targeting mitochondria metabolism for cancer therapy. Nat Chem Biol. 2015;11:9–15. doi: 10.1038/nchembio.1712. [DOI] [PMC free article] [PubMed] [Google Scholar]
- 28.Avramis VI, Panosyan EH. Pharmacokinetic/pharmacodynamic relationships of asparaginase formulations: the past, the present and recommendations for the future. Clin Pharmacokinet. 2005;44:367–393. doi: 10.2165/00003088-200544040-00003. [DOI] [PubMed] [Google Scholar]
- 29.Stathias V, Pastori C, Griffin TZ, Komotar R, Clarke J, Zhang M, Ayad NG. Identifying glioblastoma gene networks based on hypergeometric test analysis. PLoS ONE. 2014;9:e115842. doi: 10.1371/journal.pone.0115842. [DOI] [PMC free article] [PubMed] [Google Scholar]
- 30.Hart MG, Garside R, Rogers G, Stein K, Grant R. Temozolomide for high grade glioma. Cochrane Database Syst Rev. 2013;4:CD007415. doi: 10.1002/14651858.CD007415.pub2. [DOI] [PMC free article] [PubMed] [Google Scholar]
- 31.Wu S-H, Bi J-F, Cloughesy T, Cavenee WK, Mischel PS. Emerging function of mTORC2 as a core regulator in glioblastoma: metabolic reprogramming and drug resistance. Cancer Biol Med. 2014;11:255–263. doi: 10.7497/j.issn.2095-3941.2014.04.004. [DOI] [PMC free article] [PubMed] [Google Scholar]
- 32.Gao Q, Lei T, Ye F. Therapeutic targeting of EGFR-activated metabolic pathways in glioblastoma. Expert Opin Investig Drugs. 2013;22:1023–1040. doi: 10.1517/13543784.2013.806484. [DOI] [PubMed] [Google Scholar]
- 33.R2: Genomics Analysis and Visualization Platform. ( http://r2.amc.nl). http://hgserver1.amc.nl/cgi-bin/r2/main.cgi.
- 34.Gross MI, Demo SD, Dennison JB, Chen L, Chernov-Rogan T, Goyal B, Janes JR, Laidig GJ, Lewis ER, Li J, MacKinnon AL, Parlati F, Rodriguez MLM, Shwonek PJ, Sjogren EB, Stanton TF, Wang T, Yang J, Zhao F, Bennett MK. Antitumor activity of the glutaminase inhibitor CB-839 in triple-negative breast cancer. Mol Cancer Ther. 2014;13:890–901. doi: 10.1158/1535-7163.mct-13-0870. [DOI] [PubMed] [Google Scholar]
Associated Data
This section collects any data citations, data availability statements, or supplementary materials included in this article.