

Abstract
Before we can assess and interpret how developmental changes in human brain structure relate to cognition, affect, and motivation, and how these processes are perturbed in clinical or at-risk populations, we must first precisely understand typical brain development and how changes in different structural components relate to each other. We conducted a multisample magnetic resonance imaging study to investigate the development of cortical volume, surface area, and thickness, as well as their inter-relationships, from late childhood to early adulthood (7–29 years) using four separate longitudinal samples including 388 participants and 854 total scans. These independent datasets were processed and quality-controlled using the same methods, but analyzed separately to study the replicability of the results across sample and image-acquisition characteristics. The results consistently showed widespread and regionally variable nonlinear decreases in cortical volume and thickness and comparably smaller steady decreases in surface area. Further, the dominant contributor to cortical volume reductions during adolescence was thinning. Finally, complex regional and topological patterns of associations between changes in surface area and thickness were observed. Positive relationships were seen in sulcal regions in prefrontal and temporal cortices, while negative relationships were seen mainly in gyral regions in more posterior cortices. Collectively, these results help resolve previous inconsistencies regarding the structural development of the cerebral cortex from childhood to adulthood, and provide novel insight into how changes in the different dimensions of the cortex in this period of life are inter-related.
SIGNIFICANCE STATEMENT Different measures of brain anatomy develop differently across adolescence. Their precise trajectories and how they relate to each other throughout development are important to know if we are to fully understand both typical development and disorders involving aberrant brain development. However, our understanding of such trajectories and relationships is still incomplete. To provide accurate characterizations of how different measures of cortical structure develop, we performed an MRI investigation across four independent datasets. The most profound anatomical change in the cortex during adolescence was thinning, with the largest decreases observed in the parietal lobe. There were complex regional patterns of associations between changes in surface area and thickness, with positive relationships seen in sulcal regions in prefrontal and temporal cortices, and negative relationships seen mainly in gyral regions in more posterior cortices.
Keywords: brain development, gray matter, morphometry, MRI, replication
Introduction
Insight into postnatal human brain development has been greatly enhanced over the last two decades by the use of imaging methods, particularly magnetic resonance imaging (MRI; Jernigan et al., 2011; Blakemore, 2012; Giedd et al., 2015). There are, however, still fundamental disagreements across available studies regarding the developmental patterns and precise trajectories for cortical volume and its distinct components, surface area and thickness (Mills and Tamnes, 2014). To try to resolve the inconsistencies and provide clues about the processes driving the changes in the different dimensions of the cerebral cortex from childhood to adulthood, we investigated the development of cortical structure concurrently in four separate longitudinal samples, and directly assessed how changes in different cortical measures are inter-related.
Previous results are particularly contradictory with regard to the development of cortical thickness, with some studies reporting increases until late childhood, while others finding continuous thinning from early or midchildhood (Walhovd et al., 2016). Inconsistencies across studies of development of cortical structure may have resulted from varying sample characteristics, image acquisition, image processing, including quality-control (QC) procedures and software used, and/or statistical analyses and curve fitting (Fjell et al., 2010; Sullivan et al., 2011; Aubert-Broche et al., 2013; Ducharme et al., 2016; Mills et al., 2016). One approach to try to clarify these inconsistencies is to conduct multisample studies following current standards and recommendations for processing and analysis. Here, we build upon a recent such study in which we reported replicable models for gross structural brain development between childhood and adulthood (Mills et al., 2016).
Cortical volume is determined by surface area and thickness, and these components are influenced by different evolutionary (Geschwind and Rakic, 2013), genetic (Chen et al., 2013; Kremen et al., 2013), and cellular (Chenn and Walsh, 2002) processes, and show unique changes across different stages of life (Brown et al., 2012; Storsve et al., 2014; Wierenga et al., 2014; Lyall et al., 2015; Amlien et al., 2016). Knowledge about the relative contributions of surface area and thickness to developmental cortical volume changes, and the relationship between changes in surface area and thickness during adolescence, may provide important, although indirect, clues for understanding the biological processes underlying development of cortical structure. In prenatal and perinatal life, the primary processes driving surface-area expansion and thickening are cortical column generation and genesis of neurons within columns, respectively (Rakic, 1988; Bhardwaj et al., 2006). The processes underlying changes in cortical structure throughout childhood and adolescence are less well understood, although we know that the protracted human brain development involves increasing caliber and myelination of axons (Yakovlev and Lecours, 1967; Benes, 1989; Benes et al., 1994), and that early synaptogenesis is followed by pruning (Huttenlocher and Dabholkar, 1997; Petanjek et al., 2011).
To increase our confidence in current interpretations about how the cerebral cortex grows and to gain knowledge that might help us understand the processes driving its development, the present study aimed to (1) characterize the regional developmental trajectories of cortical volume, surface area, and thickness across adolescence in four separate longitudinal samples and (2) directly test how changes in the distinct cortical components are inter-related. Each independent dataset was analyzed separately to examine the consistency and replicability of the results across sample and image-acquisition specifics.
Materials and Methods
Participants.
This study used four separate datasets: Child Psychiatry Branch (CPB), Pittsburgh (PIT), Neurocognitive Development (NCD), and Braintime (BT). Each of these included data about typically developing participants collected at four separate sites (National Institutes of Health, University of Pittsburgh, University of Oslo, Leiden University) in three countries (United States, Norway, Netherlands). All datasets were collected using accelerated longitudinal designs. Each separate study was approved by a local review board. For the CPB dataset, participants and scans were selected from a pool of >1000 scans for their quality and number of time points per individual. For the PIT, NCD, and BT datasets, respectively, 126, 111, and 299 participants were recruited and scanned at baseline. Of these, 20, 26, and 45 dropped out at follow up, and an additional 33, 9, and 45 were excluded based on the QC of the MRI data (see below). The final CPB, PIT, NCD, and BT datasets included 30, 73, 76, and 209 participants, respectively. In total, the present study includes 388 participants (199 females) and 854 scans covering the age range of 7–29 years old (Table 1). Details regarding participant recruitment have been described previously for each sample separately (Tamnes et al., 2013; Herting et al., 2014; Mills et al., 2014b; Braams et al., 2015) and together (Mills et al., 2016).
Table 1.
Participant demographics and MRI acquisition parameters for each sample
| CPB | PIT | NCD | BT | |
|---|---|---|---|---|
| N participants (females) | 30 (9) | 73 (41) | 76 (37) | 209 (112) |
| Age mean (SD)a | 15.6 (1.7) years | 13.4 (0.9) years | 15.2 (3.3) years | 15.7 (3.6) years |
| Age range | 7.0–29.9 years | 10.1–16.2 years | 8.2–21.9 years | 8.0–26.6 years |
| N scans (individual range) | 138 (3–6) | 146 (2) | 152 (2) | 418 (2) |
| Scan interval mean (SD) | 3.7 (2.2) years | 2.2 (0.4) years | 2.6 (0.2) years | 2.0 (0.1) years |
| Scan interval range | 1.1–14.0 years | 1.5–3.7 years | 2.4–3.2 years | 1.6–2.5 years |
| Scanner | GE Signa 1.5 T | Siemens Allegra 3 T | Siemens Avanto 1.5 T | Philips Achieva 3 T |
| Repetition time (TR) | 2400 ms | 1540 ms | 2400 ms | 9.76 ms |
| Echo time (TE) | 5.00 ms | 3.04 ms | 3.61 ms | 4.59 ms |
| Voxel size | 0.938 × 0.938 × 1.5 mm | 1.0 × 1.0 × 1.0 mm | 1.25 × 1.25 × 1.20 mm | 0.875 × 0.875 × 1.2 mm |
aMean across available time points.
Image acquisition and processing.
T1-weighted anatomical scans were obtained at four different sites using different scanners and sequences. Only key parameters are summarized here (Table 1), as details regarding image acquisition at each site were described in detail previously (Mills et al., 2016). At each site, a radiologist reviewed all scans for gross abnormalities. Image processing was performed with FreeSurfer 5.3 (RRID:SCR_001847), which is documented and freely available online (http://surfer.nmr.mgh.harvard.edu/). The technical details of the procedures were described in detail previously (Dale et al., 1999; Fischl et al., 1999, 2002). The processing stream includes motion correction (Reuter et al., 2010), removal of nonbrain tissue using a hybrid watershed/surface-deformation procedure (Ségonne et al., 2004), automated Talairach transformation, nonparametric nonuniform intensity normalization (Sled et al., 1998), tessellation of the gray–white matter boundary, automated topology correction (Fischl et al., 2001; Ségonne et al., 2007), and surface deformation following intensity gradients to optimally place the gray–white and gray–CSF borders at the location where the greatest shift in intensity defines the transition to the other tissue class (Dale and Sereno, 1993; Dale et al., 1999; Fischl and Dale, 2000). Each cortical model was registered to a spherical atlas using individual cortical folding patterns to match cortical geometry across participants (Dale et al., 1999).
Images were then processed using FreeSurfer 5.3's longitudinal stream (Reuter et al., 2012). This process includes the creation of an unbiased within-subject template space and image using robust, inverse consistent registration (Reuter et al., 2010). Several processing steps, such as skull stripping, Talairach transforms, and atlas registration, as well as spherical surface maps and parcellations, were then initialized with common information from the within-subject template, significantly increasing reliability and statistical power (Reuter et al., 2012). The QC procedure was coordinated across sites so that all images were visually inspected post-processing by trained operators for accuracy, but no editing was performed.
Surface maps for cortical volume, surface area (white surface), and thickness, as well as symmetrized annual percentage change (APC; i.e., the linear annual rate of change with respect to the average volume/area/thickness measure across all available time points) over all available observations for each measure, were generated and smoothed with a Gaussian kernel of full-width at half-maximum of 15 mm. Additionally, we computed global total cortical volume, total surface area, and weighted mean thickness (with each label contributing to the mean according to its area) for each time point for each subject across all labels in the Desikan–Killiany cortical parcellation (Desikan et al., 2006), and APC for each of the measures. Similar variables were calculated for the frontal (including anterior cingulate), temporal (including insula), parietal (including posterior and retrosplenial cingulate), and occipital lobes, and for each label across both hemispheres.
Statistical analysis.
First, spaghetti plots and longitudinal curve fitting were performed using the Multimodal Imaging Laboratory data portal (Bartsch et al., 2014; Vidal-Pineiro et al., 2016), which uses functions freely available through the statistical environment R (http://www.r-project.org/, RRID:SCR_001905). Cortical volume, surface area, and thickness measures from each time point, adjusted for the effect of sex, were introduced as predicted variables in generalized additive mixed model (GAMM) analyses where the predictor was age, with k parameters specifying the stiffness of the model curves set to five (except for temporal lobe volume where four was used so the models would converge). The main effect of sex was adjusted for through linear mixed-effect models. GAMM can be represented as the following formula: G(y) = X*α + ‖j=1p(xj) + fj(xj) + Zb + ε, where G(·) is a monotonic differentiable link function, α is the vector of regression coefficients for the fixed parameters; X* is the fixed-effects matrix; fj is the smooth function of the covariate xj; Z is the random-effects model matrix; b is the vector of random-effects coefficients; and ε is the residual error vector (Wood, 2006). GAMM fitting was visualized over its correspondent spaghetti plots. Estimated mean values across sex were used as display values. GAMM provides accurate delineations of developmental trajectories, as it avoids some of the inherent weaknesses of global polynomial models, e.g., quadratic and cubic models, where the timing of peaks and the end points of the trajectories may be substantially affected by irrelevant factors, such as the age range sampled (Fjell et al., 2010).
Second, as background analyses before testing for inter-relationships between cortical volume, surface area, and thickness, mean global and lobar APC values for each cortical measure for each sample were calculated, one-sample t tests were used to test whether the APC values were significantly different from zero, and ANOVAs with Tukey's HSD post hoc comparisons were performed to test for sample differences. For each sample, we then performed vertex-wise general linear models (GLMs) as implemented in FreeSurfer 5.3, testing whether APCs for each of the measures were significantly different from zero, with sex, age (mean across time points), and their interaction as covariates.
Third, regional relationships between changes in cortical volume, surface area, and thickness were initially tested for by means of partial correlations between global and lobar APCs in each measure, with sex and mean age as covariates. Then, a series of GLMs were performed in FreeSurfer to test for vertex-wise change–change relationships among the different measures across the cortical surface. APC maps for each measure were entered as per-vertex regressors of interest to the other measures, with sex, mean age, and their interaction as covariates.
All regional (global and lobar) results were Bonferroni-corrected by a factor of five (reflecting the number of regions), corresponding to a corrected α of p < 0.01. For all vertex-wise analyses, the data were tested against an empirical null distribution of maximum cluster size across 10,000 iterations using Z Monte Carlo simulations as implemented in FreeSurfer (Hayasaka and Nichols, 2003; Hagler et al., 2006) synthesized with a cluster-forming threshold of p < 0.05 (two-sided), yielding clusters fully corrected for multiple comparisons across the surfaces. Cluster-wise corrected p < 0.05 was regarded to be significant.
Results
Delineating cortical developmental trajectories
To accurately characterize longitudinal developmental trajectories, global (Fig. 1) and lobar (Fig. 2) cortical volume, surface area, and thickness measures were visualized as spaghetti plots fitted with GAMM. Total cortical volume decreased across the whole age range in all four samples, with slightly accelerated decreases in the adolescent period compared with late childhood and early adulthood. Total cortical surface area showed nearly linear decreases in all four samples, but appeared overall greater for the two European samples (NCD, BT) and had a somewhat flatter slope for one of the US samples (CPB). Mean cortical thickness showed highly overlapping nonlinear trajectories, with accelerated thinning in adolescence.
Figure 1.

Developmental trajectories for global cortical measures. Spaghetti plots of mean cortical thickness, total cortical surface area, and total cortical volume, controlling for sex. The colored lines represent the GAMM fitting while the lighter colored areas correspond to the 95% confidence intervals. Pink, CPB; purple, PIT; blue, NCD; green, BT.
Figure 2.

Developmental trajectories for lobar cortical measures. Spaghetti plots of lobar cortical thickness, surface area, and volume, controlling for sex. The colored lines represent the GAMM fitting while the lighter colored areas correspond to the 95% confidence intervals. Pink, CPB; Purple, PIT; blue, NCD; green, BT.
The lobar trajectories were overall similar to the global results, although some regional differences were also evident. For example, cortical volume showed a relatively stable trajectory in late childhood in the frontal lobe, and the accelerated thinning in adolescence was most clearly seen in the frontal lobe, while decelerating trajectories with increasing age were seen for thickness in the parietal and occipital lobes.
Mapping longitudinal cortical change
On average for each sample, and on both the global and lobar level, cortical volume, thickness, and surface area all showed negative change rates, i.e., reductions with increasing age (Table 2; see Table 3 for APCs for all measures for all labels in the cortical parcellation). For the global measures and within all four samples, cortical volume showed the largest decrease (APCs from −1.10 to −1.87; sample mean, −1.43), followed by thickness (APCs from −0.83 to −1.38; sample mean, −1.03), and finally surface area (APCs from −0.36 to −0.71; sample mean, −0.55). Although the ranking of APCs in the different global measures was the same in all four samples, there were also significant sample differences in all three measures (Table 2).
Table 2.
Global and lobar change in cortical volume, surface area, and thickness for each sample
| CPB | PIT | NCD | BT | Significant sample differences | |
|---|---|---|---|---|---|
| Cortical volume | −1.10 | −1.87 | −1.15 | −1.60 | CPB–PIT, PIT–NCD, NCD–BT |
| Frontal lobe | −1.04 | −1.67 | −1.08 | −1.60 | |
| Temporal lobe | −0.88 | −1.65 | −0.99 | −1.32 | CPB–PIT, PIT–NCD |
| Parietal lobe | −1.54 | −2.53 | −1.49 | −1.98 | CPB–PIT, PIT–NCD, PIT–BT, NCD–BT |
| Occipital lobe | −0.61 | −1.31 | −0.84 | −1.28 | CPB–PIT, CPB–BT, NCD–BT |
| Cortical surface area | −0.36 | −0.61 | −0.53 | −0.71 | CPB–PIT, CPB–BT, NCD–BT |
| Frontal lobe | −0.29 | −0.48 | −0.47 | −0.61 | CPB–BT |
| Temporal lobe | −0.31 | −0.52 | −0.43 | −0.59 | CPB–BT |
| Parietal lobe | −0.50 | −0.90 | −0.71 | −0.87 | CPB–PIT, CPB–BT |
| Occipital lobe | −0.34 | −0.46 | −0.47 | −0.85 | CPB–BT, PIT–BT NCD–BT |
| Cortical thickness | −0.93 | −1.38 | −0.83 | −0.98 | PIT–NCD, PIT–BT |
| Frontal lobe | −0.93 | −1.29 | −0.83 | −0.99 | |
| Temporal lobe | −0.89 | −1.43 | −0.82 | −0.90 | PIT–NCD, PIT–BT |
| Parietal lobe | −1.15 | −1.63 | −0.94 | −1.17 | PIT–NCD, PIT–BT |
| Occipital lobe | −0.45 | −0.90 | −0.58 | −0.66 |
Values displayed are mean symmetrized APC for each measure. All APC values were significantly different from zero (p < 0.001). Differences among the samples were tested with ANOVAs (p < 0.05, Bonferroni-corrected, factor of 5) with Tukey's HSD post hoc comparisons (p < 0.05) and those showing significant differences are listed in the far right column.
Table 3.
Regional change in cortical volume, surface area and thickness for each sample
| Cortical volume |
Cortical surface area |
Cortical thickness |
||||||||||
|---|---|---|---|---|---|---|---|---|---|---|---|---|
| CPB | PIT | NCD | BT | CPB | PIT | NCD | BT | CPB | PIT | NCD | BT | |
| Frontal, superior | −1.04 | −1.63 | −0.99 | −1.66 | −0.21 | −0.33 | −0.36 | −0.50 | −0.92 | −1.36 | −0.80 | −1.09 |
| Frontal, rostral middle | −1.27 | −2.14 | −1.42 | −2.12 | −0.52 | −0.74 | −0.64 | −0.79 | −1.25 | −1.73 | −1.26 | −1.34 |
| Frontal, caudal middle | −1.38 | −2.09 | −1.55 | −1.90 | −0.54 | −0.79 | −0.83 | −0.80 | −0.94 | −1.24 | −0.87 | −1.02 |
| Frontal, lateral orbital | −1.02 | −1.78 | −1.14 | −1.29 | −0.14 | −0.62 | −0.38 | −0.34 | −0.93 | −1.27 | −0.78 | −0.91 |
| Frontal, pars orbitalis | −1.06 | −1.67 | −1.12 | −1.65 | −0.26 | −0.45 | −0.47 | −0.95 | −0.93 | −1.19 | −0.71 | −0.87 |
| Frontal, pars triangularis | −0.96 | −1.74 | −0.99 | −1.70 | −0.06 | −0.26 | −0.24 | −0.62 | −1.02 | −1.49 | −0.96 | −1.15 |
| Frontal, pars opercularis | −1.02 | −1.66 | −1.15 | −1.51 | −0.28 | −0.46 | −0.47 | −0.50 | −0.95 | −1.28 | −0.86 | −1.00 |
| Frontal, precentral | −0.55 | −1.24 | −0.57 | −1.07 | −0.20 | −0.36 | −0.42 | −0.50 | −0.41 | −0.78 | −0.28 | −0.55 |
| Frontal, pole | −0.42 | −0.95 | 0.17 | −2.38 | −0.32 | −0.58 | 0.31 | −1.52 | −0.54 | −0.77 | −0.45 | −0.89 |
| Frontal, medial orbital | −1.12 | −1.26 | −1.46 | −1.33 | −0.18 | −0.29 | −0.55 | −0.62 | −1.08 | −1.01 | −1.06 | −0.79 |
| Frontal, rostral anterior cingulate | −1.07 | −0.40 | −0.44 | −0.82 | −0.22 | −0.02 | −0.15 | −0.40 | −1.14 | −1.08 | −0.68 | −0.49 |
| Frontal, caudal anterior cingulate | −1.11 | −1.06 | −1.08 | −1.26 | −0.29 | −0.08 | −0.26 | −0.31 | −1.05 | −1.08 | −1.03 | −1.05 |
| Frontal, paracentral | −1.33 | −2.15 | −1.36 | −1.62 | −0.41 | −0.70 | −0.62 | −0.92 | −1.01 | −1.69 | −0.95 | −1.07 |
| Temporal, superior | −0.73 | −1.59 | −0.80 | −1.28 | −0.22 | −0.37 | −0.26 | −0.56 | −0.79 | −1.35 | −0.76 | −0.82 |
| Temporal, middle | −0.74 | −1.50 | −0.92 | −1.42 | −0.19 | −0.34 | −0.26 | −0.52 | −1.07 | −1.64 | −1.06 | −1.06 |
| Temporal, inferior | −0.98 | −1.90 | −1.31 | −1.52 | −0.38 | −0.66 | −0.51 | −0.65 | −1.02 | −1.69 | −1.06 | −1.01 |
| Temporal, banks superior temporal sulcus | −2.06 | −3.12 | −1.91 | −2.06 | −0.76 | −1.23 | −1.02 | −0.84 | −1.91 | −2.45 | −1.32 | −1.57 |
| Temporal, transverse | −1.27 | −1.91 | −1.36 | −1.47 | −0.45 | −1.08 | −0.95 | −1.21 | −0.71 | −0.75 | −0.51 | −0.49 |
| Temporal, pole | 0.28 | −0.85 | 0.59 | 0.01 | 0.02 | −0.28 | 0.27 | −0.07 | 0.14 | −0.66 | 0.13 | 0.09 |
| Temporal, entorhinal | −0.43 | −0.45 | −0.56 | −0.25 | −0.36 | −0.22 | −0.40 | −0.34 | 0.07 | −0.13 | 0.08 | 0.11 |
| Temporal, parahippocampal | −1.32 | −1.77 | −0.83 | −1.20 | −0.29 | −0.51 | −0.27 | −0.52 | −1.03 | −1.49 | −0.62 | −0.81 |
| Temporal, fusiform | −1.28 | −2.02 | −1.19 | −1.50 | −0.23 | −0.43 | −0.38 | −0.64 | −1.04 | −1.53 | −0.82 | −0.95 |
| Temporal, insula | −0.58 | −0.94 | −0.85 | −1.12 | −0.46 | −0.62 | −0.76 | −0.54 | −0.54 | −0.95 | −0.53 | −0.92 |
| Parietal, superior | −1.64 | −2.58 | −1.45 | −2.02 | −0.55 | −0.83 | −0.80 | −0.93 | −1.18 | −1.66 | −0.83 | −1.08 |
| Parietal, inferior | −1.65 | −2.58 | −1.67 | −2.15 | −0.53 | −1.01 | −0.82 | −0.88 | −1.34 | −1.72 | −1.05 | −1.32 |
| Parietal, supramarginal | −1.48 | −2.71 | −1.53 | −2.01 | −0.51 | −1.01 | −0.71 | −0.86 | −1.07 | −1.64 | −0.93 | −1.14 |
| Parietal, postcentral | −1.23 | −2.26 | −1.27 | −1.64 | −0.42 | −0.73 | −0.57 | −0.96 | −0.77 | −1.22 | −0.74 | −0.74 |
| Parietal, precuneus | −1.60 | −2.65 | −1.44 | −1.99 | −0.46 | −0.90 | −0.64 | −0.78 | −1.26 | −1.92 | −0.99 | −1.42 |
| Parietal, posterior cingulate | −1.52 | −2.17 | −1.45 | −1.78 | −0.57 | −0.90 | −0.57 | −0.59 | −1.18 | −1.54 | −1.05 | −1.34 |
| Parietal, retrosplenial cingulate | −1.46 | −2.37 | −1.64 | −2.08 | −0.44 | −0.98 | −0.54 | −0.73 | −1.07 | −1.45 | −1.16 | −1.41 |
| Occipital, lateral | −0.48 | −1.38 | −0.97 | −1.43 | −0.55 | −0.36 | −0.51 | −1.03 | −0.30 | −1.12 | −0.81 | −0.72 |
| Occipital, cuneus | −0.94 | −1.36 | −0.90 | −1.36 | −0.37 | −0.58 | −0.54 | −0.80 | −0.72 | −0.94 | −0.53 | −0.84 |
| Occipital, pericalcarine | 0.05 | 0.35 | 0.37 | 0.11 | 0.17 | −0.08 | −0.23 | −0.33 | −0.21 | 0.21 | 0.25 | 0.17 |
| Occipital, lingual | −0.89 | −1.69 | −0.99 | −1.39 | −0.20 | −0.72 | −0.48 | −0.84 | −0.62 | −0.91 | −0.50 | −0.67 |
Values displayed are mean symmetrized APC for each measure.
For the lobar measures, cortical volume consistently showed the same ranking of APCs within all four samples, with the largest decrease in the parietal lobe, followed by the frontal, the temporal, and finally the occipital lobe. The parietal lobe also showed the largest decrease in both cortical surface area and thickness in all four samples, and the occipital lobe consistently showed the smallest decrease in cortical thickness. Except for frontal lobe volume and thickness and occipital lobe thickness, there were significant sample differences in the lobar APC values in all measures (Table 2).
Vertex-wise surface maps were then created to visualize the statistical significance (controlling for sex and mean age) and rate of APCs in cortical volume (Fig. 3), surface area (Fig. 4), and thickness (Fig. 5) for each of the samples separately. Corrected significant negative changes were seen for all three measures for extensive portions of the cerebral cortex in all four samples. Some exceptions or sample differences were noted. For volume, significant increases or no effects were seen around the central sulcus and in insular, medial temporal, and medial occipital cortices. For surface area compared with the other two measures, more regions did not show significant APCs, especially gyral regions in the three smaller samples. And finally, for thickness, the rate decrease in most regions was larger for the sample with a narrower age range in adolescence (PIT), than for the other three samples. Note that the scale for rate of APCs varies across the different measures.
Figure 3.

Longitudinal change in cortical volume. GLMs were used to test the statistical significance of APC in volume across the brain surface in each sample, with sex and mean age included as covariates. The results were corrected for multiple comparisons using cluster-size inference. Left, Uncorrected p values within the corrected significant clusters. Right, Rates of change.
Figure 4.

Longitudinal change in cortical surface area. GLMs were used to test the statistical significance of APC in area across the brain surface in each sample, with sex and mean age included as covariates. The results were corrected for multiple comparisons using cluster-size inference. Left, Uncorrected p values within the corrected significant clusters. Right, Rates of change.
Figure 5.

Longitudinal change in cortical thickness. GLMs were used to test the statistical significance of APC in thickness across the brain surface in each sample, with sex and mean age included as covariates. The results were corrected for multiple comparisons using cluster-size inference. Left, Uncorrected p values within the corrected significant clusters. Right, Rates of change.
Testing for inter-related changes in different cortical components
Relationships between global and lobar changes in surface area and volume and in thickness and volume were first tested with partial correlations, controlling for sex and mean age (Table 4). All samples showed large positive associations between thickness APCs and volume APCs (r = 0.72–0.95) for both global and all lobar measures. For global measures, the associations between surface area APC and volume APC varied from small to medium (r = 0.16–0.55), while for the lobar measures medium-to-large positive associations (r = 0.51–0.76) were seen in the frontal lobe in three of the samples (PIT, NCD, BT), in the temporal lobe in two samples (NCD, BT), and in the parietal lobe in one sample (PIT).
Table 4.
Relationships between changes in surface area and volume and between changes in thickness and volume, for each sample
| CPB | PIT | NCD | BT | |
|---|---|---|---|---|
| Area change−volume change | ||||
| Global cortex | 0.16 (0.427) | 0.47a (<0.001) | 0.55a (<0.001) | 0.51a (<0.001) |
| Frontal lobe | 0.26 (0.179) | 0.68a (<0.001) | 0.69a (<0.001) | 0.51a (<0.001) |
| Temporal lobe | 0.04 (0.827) | 0.37a (0.002) | 0.69a (<0.001) | 0.52a (<0.001) |
| Parietal lobe | 0.00 (0.985) | 0.76a (<0.001) | 0.33a (0.005) | 0.29a (<0.001) |
| Occipital lobe | 0.37 (0.056) | 0.07 (0.543) | 0.01 (0.922) | −0.07 (0.304) |
| Thickness change−volume change | ||||
| Global cortex | 0.87a (<0.001) | 0.85a (<0.001) | 0.93a (<0.001) | 0.93a (<0.001) |
| Frontal lobe | 0.86a (<0.001) | 0.87a (<0.001) | 0.94a (<0.001) | 0.93a (<0.001) |
| Temporal lobe | 0.90a (<0.001) | 0.95a (<0.001) | 0.95a (<0.001) | 0.92a (<0.001) |
| Parietal lobe | 0.90a (<0.001) | 0.72a (<0.001) | 0.91a (<0.001) | 0.93a (<0.001) |
| Occipital lobe | 0.82a (<0.001) | 0.79a (<0.001) | 0.94a (<0.001) | 0.89a (<0.001) |
Values displayed are partial correlations between symmetrized APC in different cortical measures, controlling for sex and age, with p values in parentheses.
ap < 0.05 (Bonferroni-corrected, factor of 5).
The results from the per-vertex regression models (controlling for sex and mean age) of surface area APCs and volume APCs and of thickness APCs and volume APCs, respectively, confirmed these general patterns (Fig. 6). Highly significant positive associations between thickness change and volume change were observed across nearly the entire cerebral cortex in all four samples. In comparison, the associations between area change and volume change were not as strong or widespread, and in several regions in two of the samples (NCD, BT) even in the opposite direction (i.e., negative).
Figure 6.
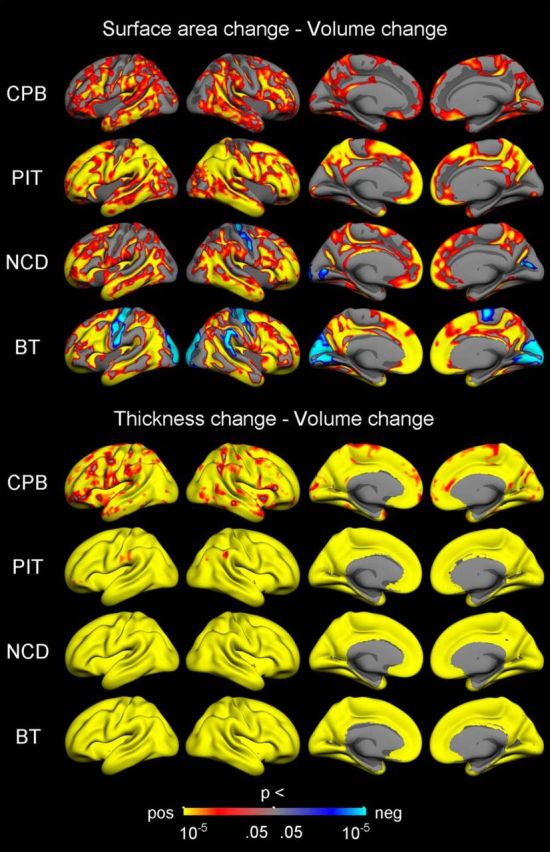
Relationships between change in surface area and thickness and change in volume. Vertex-wise p value maps from GLMs testing the relationships between symmetrized APC in different cortical measures, with sex and mean age included as covariates. The results were corrected for multiple comparisons using cluster-size inference. Uncorrected p values within the corrected significant clusters are shown. Red–yellow reflects a positive relationship, where a relatively large decrease in one measure is associated with a relatively large decrease in the other measure. Blue–cyan reflects a negative relationship, in which a relatively large decrease on one measure is associated with a relatively small decrease or increase on the other measure.
Inter-relationships between APCs in cortical surface area and APCs in cortical thickness were first tested on global and lobar measures with partial correlations, controlling for sex and mean age (Table 5). For the global measures, a significant small positive association (r = 0.22) was seen in the largest sample (BT). For the lobar measures, significant small-to-medium positive associations (r = 0.21–0.52) were seen for the frontal lobe in three samples (PIT, NCD, BT) and for the temporal lobe in two samples (NCD, BT), while significant medium negative associations (r = −0.46 to −0.48) were seen for the occipital lobe in two samples (PIT, BT). Inconsistent with the other samples, the CPB sample showed negative, although nonsignificant, associations for the frontal and temporal lobe measures, possibly related to the younger average baseline age of this sample.
Table 5.
Global and lobar relationships between changes in cortical surface area and thickness for each sample
| Surface area change−thickness change | CPB | PIT | NCD | BT |
|---|---|---|---|---|
| Global cortex | −0.23 (0.231) | 0.03 (0.827) | 0.30 (0.011) | 0.22a (0.001) |
| Frontal lobe | −0.13 (0.524) | 0.38a (0.001) | 0.49a (<0.001) | 0.21a (0.002) |
| Temporal lobe | −0.21 (0.278) | 0.15 (0.219) | 0.52a (<0.001) | 0.23a (0.001) |
| Parietal lobe | −0.32 (0.098) | 0.18 (0.143) | −0.01 (0.940) | −0.03 (0.656) |
| Occipital lobe | −0.18 (0.374) | −0.46a (<0.001) | −0.28 (0.014) | −0.48a (<0.001) |
Values displayed are partial correlations between symmetrized APC in cortical surface area and thickness, controlling for sex and age, with p values in parentheses.
ap < 0.05 (Bonferroni-corrected, factor of 5).
To investigate these regional differences in more detail, per-vertex regression models (controlling for sex and mean age) of surface area APCs and thickness APCs were performed (Fig. 7). In all four samples, positive associations were observed in lateral prefrontal and temporal cortices, while negative associations were seen around the central sulcus and in paracentral, insular, and both lateral and medial occipital cortices. Generally, the negative associations were more widespread than the positive. Importantly, the vertex-wise results also revealed a complex topographic pattern of positive and negative associations, with positive relations mainly seen in sulcal regions and negative relations seen in gyral and insular regions. The exact location of some of the relations between surface area APCs and thickness APCs did, however, vary across samples, e.g., three samples (CPB, NCD, BT) showed positive associations in the superior temporal sulcus, while one sample (PIT) showed positive associations in the middle and interior temporal cortices. Also, the extent of both the positive and negative associations appeared to be related to sample size, with the spatially most limited effects seen in the CPB sample and the most widespread effects, especially negative associations, seen in the BT sample. In the three smallest samples (CPB, PIT, NCD), most vertices did not show significant associations.
Figure 7.

Relationships between change in surface area and change in thickness. Vertex-wise p value maps from GLMs testing the relationships between symmetrized APC in different cortical measures, with sex and mean age included as covariates. The results were corrected for multiple comparisons using cluster-size inference. Uncorrected p values within the corrected significant clusters are shown. Red–yellow reflects a positive relationship, where a relatively large decrease in one measure is associated with a relatively large decrease in the other measure. Blue–cyan reflects a negative relationship, in which a relatively large decrease on one measure is associated with a relatively small decrease or increase on the other measure.
Discussion
The current multisample neuroimaging study aimed to examine the development of the human cerebral cortex across adolescence in four independent longitudinal samples. The results were generally consistent across samples and showed the following: (1) that the cerebral cortex undergoes widespread and regionally variable nonlinear decreases in volume and thickness with increasing age, and comparatively smaller steady decreases in surface area; (2) that the dominant contributor to cortical volume reductions during adolescence is cortical thinning; and (3) that there are complex regional and topological patterns in the relationships between longitudinal changes in surface area and thickness. Together, the results increase confidence in conclusions about structural cortical development and provide novel insight into how changes in distinct cortical components are linked.
In the first 2 years of life, cortical volume, surface area, and thickness all increase over time (Gilmore et al., 2012; Lyall et al., 2015). There are almost no data for the following years of early childhood due to head motion-related MRI artifacts, and there are inconsistencies across studies regarding developmental patterns and trajectories of different structural measures from midchildhood to adulthood (Mills and Tamnes, 2014; Walhovd et al., 2016). Early longitudinal studies suggested continued increases in cortical volume until late childhood or early adolescence (Giedd et al., 1999; Lenroot et al., 2007; Raznahan et al., 2011), while later longitudinal studies (Lebel and Beaulieu, 2011; Aubert-Broche et al., 2013; Tamnes et al., 2013; Mills et al., 2014a, 2016; Wierenga et al., 2014), as well as the current results, indicate that cortical volume is at its highest earlier in childhood and decreases in late childhood and throughout adolescence.
Previous longitudinal studies are particularly conflicting with regard to cortical thickness, with some indicating inverted-U trajectories from childhood to adulthood, with estimates of peak thickness in late childhood (Shaw et al., 2007, 2008; Raznahan et al., 2011), while others show widespread monotonic decreases during childhood and adolescence (Sowell et al., 2004; Shaw et al., 2006; van Soelen et al., 2012; Mutlu et al., 2013; Alexander-Bloch et al., 2014; Mills et al., 2014a; Wierenga et al., 2014; Zielinski et al., 2014; Fjell et al., 2015; Zhou et al., 2015; Ducharme et al., 2016; Vijayakumar et al., 2016). Our results support the conclusion of decreasing cortical thickness with increasing age during late childhood and across adolescence. Fewer longitudinal studies have investigated cortical surface area, but with the exception of one recent paper showing increases in adolescence (Vijayakumar et al., 2016), these (Raznahan et al., 2011; Mills et al., 2014a; Wierenga et al., 2014; Ducharme et al., 2015) and the present results together support the conclusion of childhood increases followed by subtle decreases during adolescence.
After applying similar processing and analytic techniques, the results of the present multisample study showed consistent developmental patterns and trajectories for cortical structure across four longitudinal datasets with varying sample and image-acquisition characteristics. We did not observe any global increase or “peak” for cortical volume, surface area, or thickness from ages 7 to 29 in any of the four samples. The same was true for the lobar measures, except for a small early increase in frontal lobe volume in two of the samples. Our results suggest that previous inconsistencies have not primarily resulted from sample or image-acquisition differences. Rather, we speculate that they stem from the combined effects of differences in image processing, including QC procedures, and/or statistical analyses and curve fitting. All datasets in the present study were processed with an extensively used and well validated open-source software suite (Fischl, 2012) and underwent post-processing QC. Also, curve-fitting was performed with models that avoid some of the weaknesses of global polynomial models.
In both adult and developmental samples, head motion has a negative effect on estimates of cortical volume and thickness, even after excluding low-quality scans (Reuter et al., 2015; Alexander-Bloch et al., 2016). As younger participants generally move more during acquisition, motion is often confounded with age or time point (Satterthwaite et al., 2012). The importance of post-processing QC was demonstrated by Ducharme et al. (2016), who showed that exclusion of scans defined as QC failures had a large impact on identified patterns for cortical thickness development, with a shift toward more complex trajectories when scans of lower quality were included. While we attempted to limit the impact of motion by visually inspecting all reconstructed images and only included scans judged to be of adequate quality, future studies might benefit from further efforts to limit motion during data acquisition, for example by further development of on-line motion-correction procedures and quantitative motion assessment within popular software packages (Reuter et al., 2015; Greene et al., 2016; Tisdall et al., 2016). Additionally, it is likely that differences in statistical analyses may have contributed to the inconsistencies, as we recently showed that whether and how one controls for intracranial volume or total brain size influences developmental models of brain volumes (Mills et al., 2016). In relation to this, future studies are needed to investigate the consistency of reported sex differences in brain structure and development (Lenroot et al., 2007; Mutlu et al., 2013; Vijayakumar et al., 2016), using both raw and corrected measures (Marwha et al., 2017).
In addition to providing detailed descriptions of developmental patterns and trajectories of cortical structure, our results showed consistent and very strong positive relationships between cortical thickness change and volume change across nearly the entire cortex, such that relatively large reductions in thickness were associated with relatively large reductions in volume. In comparison, the relationships between surface-area change and volume change were not as strong or widespread, and for most of the occipital lobe either nonsignificant or negative. Thus, although most of the individual variation in adult cortical volume is due to variation in surface area and not thickness (Im et al., 2008), our results show that the greatest contributor to volume decrease from 7 to 29 years is thinning, as previously also shown to be the case across the adult lifespan (23–87 years; Storsve et al., 2014).
Finally, complex regional and topological patterns in the relationships between surface-area change and thickness change were observed. Across samples, both positive and negative associations were found, with positive relationships mainly seen in sulcal regions in prefrontal and temporal cortices, and negative relationships mainly seen in gyral regions in occipital cortices, paracentral cortex, and insula, and around the central sulcus. Our results mainly showed decreases with increasing age for both surface area and thickness. Thus, positive relationships indicate that relatively large reductions in surface area are associated with relatively large reductions in thickness, while negative relationships indicate that relatively large reductions in surface area are associated with relatively small reductions in thickness, and vice versa. The importance of local topology for cortical development was demonstrated in a recent large cross-sectional study finding that age-related decreases in thickness were most pronounced in the sulci (Vandekar et al., 2015), but no previous study has examined the relationships between longitudinal change in different cortical metrics on a vertex-wise level in children and adolescents (but see Storsve et al., 2014, for a study on adults, and Alemán-Gómezet al., 2013, for lobar analyses in adolescents).
The cellular and molecular changes underlying observed developmental changes in the different dimensions of the cerebral cortex and their inter-relationships remain unknown. They likely include multiple interacting processes that vary in their relative importance across regions and age (Mills and Tamnes, 2014). A recent imaging study suggests that increasing intracortical myelination is a significant driver of cortical changes in adolescence (Whitaker et al., 2016). A hypothesis for the relationships between area change and thickness change in development is that white matter growth in the form of increasing myelination and axon caliber (Yakovlev and Lecours, 1967; Benes, 1989; Benes et al., 1994) causes the cerebral cortex to stretch tangentially to the surface, expanding its area and becoming thinner, as well as improving its ability to differentiate incoming signals (Seldon, 2005, 2007). However, this does not fully explain the surface-area decrease seen in many regions in adolescence. A second hypothesis is that synaptic pruning and dendritic arborization (Bourgeois and Rakic, 1993; Huttenlocher and Dabholkar, 1997; Petanjek et al., 2011) results in decreasing gyrification and flattening of the cortex during adolescence (Raznahan et al., 2011; Alemán-Gómezet al., 2013; Klein et al., 2014) due to release of axonal tension (White et al., 2010). It is likely that a combination of these hypotheses might explain the observed complex patterns in the relationships between surface-area change and thickness change.
Conclusion
The present results from four independent longitudinal datasets showed consistent developmental trajectories and patterns of change in cortical volume, surface area, and thickness across adolescence. Regionally variable nonlinear decreases in cortical volume and thickness, and relatively smaller steady decreases in surface area, were observed from ages 7 to 29. Further, analyses of the inter-relationships between changes in these different dimensions of the cortex revealed tight links between volume reductions and thinning, as well as regional and topological patterns in the relationships between surface-area change and thickness change.
Footnotes
This work was supported by the Research Council of Norway (C.K.T.); the University of Oslo (C.K.T.); The National Institutes of Health (NIH) Intramural Research Program; the NIH Graduate Partnership Program; NIH Grants R01 DA018910 (R.E.D.), R01 HD053893 (E.R.S.), R01 MH087563 (E.R.S.), F32 HD0708084 (M.M.H.), R01 MH107418 (K.L.M.), and K01 MH1087610 (M.M.H.); The Royal Society (S.J.B.), Jacobs Foundation (S.J.B.), The Wellcome Trust (S.J.B.), and the European Research Council starting grant scheme (ERC-2010-StG-263234 to E.A.C.). The authors thank all participating individuals and families in these longitudinal studies.
The authors declare no competing financial interests.
References
- Alemán-Gómez Y, Janssen J, Schnack H, Balaban E, Pina-Camacho L, Alfaro-Almagro F, Castro-Fornieles J, Otero S, Baeza I, Moreno D, Bargalló N, Parellada M, Arango C, Desco M (2013) The human cerebral cortex flattens during adolescence. J Neurosci 33:15004–15010. 10.1523/JNEUROSCI.1459-13.2013 [DOI] [PMC free article] [PubMed] [Google Scholar]
- Alexander-Bloch AF, Reiss PT, Rapoport J, McAdams H, Giedd JN, Bullmore ET, Gogtay N (2014) Abnormal cortical growth in schizophrenia targets normative modules of synchronized development. Biol Psychiatry 76:438–446. 10.1016/j.biopsych.2014.02.010 [DOI] [PMC free article] [PubMed] [Google Scholar]
- Alexander-Bloch A, Clasen L, Stockman M, Ronan L, Lalonde F, Giedd J, Raznahan A (2016) Subtle in-scanner motion biases automated measurement of brain anatomy from in vivo MRI. Hum Brain Mapp 37:2385–2397. 10.1002/hbm.23180 [DOI] [PMC free article] [PubMed] [Google Scholar]
- Amlien IK, Fjell AM, Tamnes CK, Grydeland H, Krogsrud SK, Chaplin TA, Rosa MG, Walhovd KB (2016) Organizing principles of human cortical development-thickness and area from 4 to 30 years: insights from comparative primate neuroanatomy. Cereb Cortex 26:257–267. 10.1093/cercor/bhu214 [DOI] [PubMed] [Google Scholar]
- Aubert-Broche B, Fonov VS, García-Lorenzo D, Mouiha A, Guizard N, Coupé P, Eskildsen SF, Collins DL (2013) A new method for structural volume analysis of longitudinal brain MRI data and its application in studying the growth trajectories of anatomical brain structures in childhood. Neuroimage 82:393–402. 10.1016/j.neuroimage.2013.05.065 [DOI] [PubMed] [Google Scholar]
- Bartsch H, Thompson WK, Jernigan TL, Dale AM (2014) A web-portal for interactive data exploration, visualization, and hypothesis testing. Front Neuroinform 8:25. 10.3389/fninf.2014.00025 [DOI] [PMC free article] [PubMed] [Google Scholar]
- Benes FM. (1989) Myelination of cortical-hippocampal relays during late adolescence. Schizophr Bull 15:585–593. 10.1093/schbul/15.4.585 [DOI] [PubMed] [Google Scholar]
- Benes FM, Turtle M, Khan Y, Farol P (1994) Myelination of a key relay zone in the hippocampal formation occurs in the human brain during childhood, adolescence, and adulthood. Arch Gen Psychiatry 51:477–484. 10.1001/archpsyc.1994.03950060041004 [DOI] [PubMed] [Google Scholar]
- Bhardwaj RD, Curtis MA, Spalding KL, Buchholz BA, Fink D, Björk-Eriksson T, Nordborg C, Gage FH, Druid H, Eriksson PS, Frisén J (2006) Neocortical neurogenesis in humans is restricted to development. Proc Natl Acad Sci U S A 103:12564–12568. 10.1073/pnas.0605177103 [DOI] [PMC free article] [PubMed] [Google Scholar]
- Blakemore SJ. (2012) Imaging brain development: the adolescent brain. Neuroimage 61:397–406. 10.1016/j.neuroimage.2011.11.080 [DOI] [PubMed] [Google Scholar]
- Bourgeois JP, Rakic P (1993) Changes of synaptic density in the primary visual cortex of the macaque monkey from fetal to adult stage. J Neurosci 13:2801–2820. [DOI] [PMC free article] [PubMed] [Google Scholar]
- Braams BR, van Duijvenvoorde AC, Peper JS, Crone EA (2015) Longitudinal changes in adolescent risk-taking: a comprehensive study of neural responses to rewards, pubertal development, and risk-taking behavior. J Neurosci 35:7226–7238. 10.1523/JNEUROSCI.4764-14.2015 [DOI] [PMC free article] [PubMed] [Google Scholar]
- Brown TT, Kuperman JM, Chung Y, Erhart M, McCabe C, Hagler DJ Jr, Venkatraman VK, Akshoomoff N, Amaral DG, Bloss CS, Casey BJ, Chang L, Ernst TM, Frazier JA, Gruen JR, Kaufmann WE, Kenet T, Kennedy DN, Murray SS, Sowell ER, et al. (2012) Neuroanatomical assessment of biological maturity. Curr Biol 22:1693–1698. 10.1016/j.cub.2012.07.002 [DOI] [PMC free article] [PubMed] [Google Scholar]
- Chen CH, Fiecas M, Gutiérrez ED, Panizzon MS, Eyler LT, Vuoksimaa E, Thompson WK, Fennema-Notestine C, Hagler DJ Jr, Jernigan TL, Neale MC, Franz CE, Lyons MJ, Fischl B, Tsuang MT, Dale AM, Kremen WS (2013) Genetic topography of brain morphology. Proc Natl Acad Sci U S A 110:17089–17094. 10.1073/pnas.1308091110 [DOI] [PMC free article] [PubMed] [Google Scholar]
- Chenn A, Walsh CA (2002) Regulation of cerebral cortical size by control of cell cycle exit in neural precursors. Science 297:365–569. 10.1126/science.1074192 [DOI] [PubMed] [Google Scholar]
- Dale AM, Sereno MI (1993) Improved localization of cortical activity by combining EEG and MEG with MRI cortical surface reconstruction: a linear approach. J Cogn Neurosci 5:162–176. 10.1162/jocn.1993.5.2.162 [DOI] [PubMed] [Google Scholar]
- Dale AM, Fischl B, Sereno MI (1999) Cortical surface-based analysis. I. Segmentation and surface reconstruction. Neuroimage 9:179–194. 10.1006/nimg.1998.0395 [DOI] [PubMed] [Google Scholar]
- Desikan RS, Ségonne F, Fischl B, Quinn BT, Dickerson BC, Blacker D, Buckner RL, Dale AM, Maguire RP, Hyman BT, Albert MS, Killiany RJ (2006) An automated labeling system for subdividing the human cerebral cortex on MRI scans into gyral based regions of interest. Neuroimage 31:968–980. 10.1016/j.neuroimage.2006.01.021 [DOI] [PubMed] [Google Scholar]
- Ducharme S, Albaugh MD, Nguyen TV, Hudziak JJ, Mateos-Pérez JM, Labbe A, Evans AC, Karama S, Brain Development Cooperative Group (2015) Trajectories of cortical surface area and cortical volume maturation in normal brain development. Data Brief 5:929–938. 10.1016/j.dib.2015.10.044 [DOI] [PMC free article] [PubMed] [Google Scholar]
- Ducharme S, Albaugh MD, Nguyen TV, Hudziak JJ, Mateos-Pérez JM, Labbe A, Evans AC, Karama S, Brain Development Cooperative Group (2016) Trajectories of cortical thickness maturation in normal brain development—the importance of quality control procedures. Neuroimage 125:267–279. 10.1016/j.neuroimage.2015.10.010 [DOI] [PMC free article] [PubMed] [Google Scholar]
- Fischl B. (2012) FreeSurfer. Neuroimage 62:774–781. 10.1016/j.neuroimage.2012.01.021 [DOI] [PMC free article] [PubMed] [Google Scholar]
- Fischl B, Dale AM (2000) Measuring the thickness of the human cerebral cortex from magnetic resonance images. Proc Natl Acad Sci U S A 97:11050–11055. 10.1073/pnas.200033797 [DOI] [PMC free article] [PubMed] [Google Scholar]
- Fischl B, Sereno MI, Dale AM (1999) Cortical surface-based analysis. II: inflation, flattening, and a surface-based coordinate system. Neuroimage 9:195–207. 10.1006/nimg.1998.0396 [DOI] [PubMed] [Google Scholar]
- Fischl B, Liu A, Dale AM (2001) Automated manifold surgery: constructing geometrically accurate and topologically correct models of the human cerebral cortex. IEEE Trans Med Imaging 20:70–80. 10.1109/42.906426 [DOI] [PubMed] [Google Scholar]
- Fischl B, Salat DH, Busa E, Albert M, Dieterich M, Haselgrove C, van der Kouwe A, Killiany R, Kennedy D, Klaveness S, Montillo A, Makris N, Rosen B, Dale AM (2002) Whole brain segmentation: automated labeling of neuroanatomical structures in the human brain. Neuron 33:341–355. 10.1016/S0896-6273(02)00569-X [DOI] [PubMed] [Google Scholar]
- Fjell AM, Walhovd KB, Westlye LT, Østby Y, Tamnes CK, Jernigan TL, Gamst A, Dale AM (2010) When does brain aging accelerate? Dangers of quadratic fits in cross-sectional studies. Neuroimage 50:1376–1383. 10.1016/j.neuroimage.2010.01.061 [DOI] [PubMed] [Google Scholar]
- Fjell AM, Grydeland H, Krogsrud SK, Amlien I, Rohani DA, Ferschmann L, Storsve AB, Tamnes CK, Sala-Llonch R, Due-Tønnessen P, Bjørnerud A, Sølsnes AE, Håberg AK, Skranes J, Bartsch H, Chen CH, Thompson WK, Panizzon MS, Kremen WS, Dale AM, et al. (2015) Development and aging of cortical thickness corresponds to genetic organization patterns. Proc Natl Acad Sci U S A 112:15462–15467. 10.1073/pnas.1508831112 [DOI] [PMC free article] [PubMed] [Google Scholar]
- Geschwind DH, Rakic P (2013) Cortical evolution: judge the brain by its cover. Neuron 80:633–647. 10.1016/j.neuron.2013.10.045 [DOI] [PMC free article] [PubMed] [Google Scholar]
- Giedd JN, Blumenthal J, Jeffries NO, Castellanos FX, Liu H, Zijdenbos A, Paus T, Evans AC, Rapoport JL (1999) Brain development during childhood and adolescence: a longitudinal MRI study. Nat Neurosci 2:861–863. 10.1038/13158 [DOI] [PubMed] [Google Scholar]
- Giedd JN, Raznahan A, Alexander-Bloch A, Schmitt E, Gogtay N, Rapoport JL (2015) Child psychiatry branch of the National Institute of Mental Health longitudinal structural magnetic resonance imaging study of human brain development. Neuropsychopharmacology 40:43–49. 10.1038/npp.2014.236 [DOI] [PMC free article] [PubMed] [Google Scholar]
- Gilmore JH, Shi F, Woolson SL, Knickmeyer RC, Short SJ, Lin W, Zhu H, Hamer RM, Styner M, Shen D (2012) Longitudinal development of cortical and subcortical gray matter from birth to 2 years. Cereb Cortex 22:2478–2485. 10.1093/cercor/bhr327 [DOI] [PMC free article] [PubMed] [Google Scholar]
- Greene DJ, Black KJ, Schlaggar BL (2016) Considerations for MRI study design and implementation in pediatric and clinical populations. Dev Cogn Neurosci 18:101–112. 10.1016/j.dcn.2015.12.005 [DOI] [PMC free article] [PubMed] [Google Scholar]
- Hagler DJ Jr, Saygin AP, Sereno MI (2006) Smoothing and cluster thresholding for cortical surface-based group analysis of fMRI data. Neuroimage 33:1093–1103. 10.1016/j.neuroimage.2006.07.036 [DOI] [PMC free article] [PubMed] [Google Scholar]
- Hayasaka S, Nichols TE (2003) Validating cluster size inference: random field and permutation methods. Neuroimage 20:2343–2356. 10.1016/j.neuroimage.2003.08.003 [DOI] [PubMed] [Google Scholar]
- Herting MM, Gautam P, Spielberg JM, Kan E, Dahl RE, Sowell ER (2014) The role of testosterone and estradiol in brain volume changes across adolescence: a longitudinal structural MRI study. Hum Brain Mapp 35:5633–5645. 10.1002/hbm.22575 [DOI] [PMC free article] [PubMed] [Google Scholar]
- Huttenlocher PR, Dabholkar AS (1997) Regional differences in synaptogenesis in human cerebral cortex. J Comp Neurol 387:167–178. [DOI] [PubMed] [Google Scholar]
- Im K, Lee JM, Lyttelton O, Kim SH, Evans AC, Kim SI (2008) Brain size and cortical structure in the adult human brain. Cereb Cortex 18:2181–2191. 10.1093/cercor/bhm244 [DOI] [PubMed] [Google Scholar]
- Jernigan TL, Baaré WF, Stiles J, Madsen KS (2011) Postnatal brain development: structural imaging of dynamic neurodevelopmental processes. Prog Brain Res 189:77–92. 10.1016/B978-0-444-53884-0.00019-1 [DOI] [PMC free article] [PubMed] [Google Scholar]
- Klein D, Rotarska-Jagiela A, Genc E, Sritharan S, Mohr H, Roux F, Han CE, Kaiser M, Singer W, Uhlhaas PJ (2014) Adolescent brain maturation and cortical folding: evidence for reductions in gyrification. PLoS One 9:e84914. 10.1371/journal.pone.0084914 [DOI] [PMC free article] [PubMed] [Google Scholar]
- Kremen WS, Fennema-Notestine C, Eyler LT, Panizzon MS, Chen CH, Franz CE, Lyons MJ, Thompson WK, Dale AM (2013) Genetics of brain structure: contributions from the Vietnam Era Twin Study of Aging. Am J Med Genet B Neuropsychiatr Genet 162B:751–761. 10.1002/ajmg.b.32162 [DOI] [PMC free article] [PubMed] [Google Scholar]
- Lebel C, Beaulieu C (2011) Longitudinal development of human brain wiring continues from childhood into adulthood. J Neurosci 31:10937–10947. 10.1523/JNEUROSCI.5302-10.2011 [DOI] [PMC free article] [PubMed] [Google Scholar]
- Lenroot RK, Gogtay N, Greenstein DK, Wells EM, Wallace GL, Clasen LS, Blumenthal JD, Lerch J, Zijdenbos AP, Evans AC, Thompson PM, Giedd JN (2007) Sexual dimorphism of brain developmental trajectories during childhood and adolescence. Neuroimage 36:1065–1073. 10.1016/j.neuroimage.2007.03.053 [DOI] [PMC free article] [PubMed] [Google Scholar]
- Lyall AE, Shi F, Geng X, Woolson S, Li G, Wang L, Hamer RM, Shen D, Gilmore JH (2015) Dynamic development of regional cortical thickness and surface area in early childhood. Cereb Cortex 25:2204–2212. 10.1093/cercor/bhu027 [DOI] [PMC free article] [PubMed] [Google Scholar]
- Marwha D, Halari M, Eliot L (2017) Meta-analysis reveals a lack of sexual dimorphism in human amygdala volume. Neuroimage 147:282–294. 10.1016/j.neuroimage.2016.12.021 [DOI] [PubMed] [Google Scholar]
- Mills KL, Tamnes CK (2014) Methods and considerations for longitudinal structural brain imaging analysis across development. Dev Cogn Neurosci 9:172–190. 10.1016/j.dcn.2014.04.004 [DOI] [PMC free article] [PubMed] [Google Scholar]
- Mills KL, Lalonde F, Clasen LS, Giedd JN, Blakemore SJ (2014a) Developmental changes in the structure of the social brain in late childhood and adolescence. Soc Cogn Affect Neurosci 9:123–131. 10.1093/scan/nss113 [DOI] [PMC free article] [PubMed] [Google Scholar]
- Mills KL, Goddings AL, Clasen LS, Giedd JN, Blakemore SJ (2014b) The developmental mismatch in structural brain maturation during adolescence. Dev Neurosci 36:147–160. 10.1159/000362328 [DOI] [PubMed] [Google Scholar]
- Mills KL, Goddings AL, Herting MM, Meuwese R, Blakemore SJ, Crone EA, Dahl RE, Güroğlu B, Raznahan A, Sowell ER, Tamnes CK (2016) Structural brain development between childhood and adulthood: convergence across four longitudinal samples. Neuroimage 141:273–281. 10.1016/j.neuroimage.2016.07.044 [DOI] [PMC free article] [PubMed] [Google Scholar]
- Mutlu AK, Schneider M, Debbané M, Badoud D, Eliez S, Schaer M (2013) Sex differences in thickness, and folding developments throughout the cortex. Neuroimage 82:200–207. 10.1016/j.neuroimage.2013.05.076 [DOI] [PubMed] [Google Scholar]
- Petanjek Z, Judaš M, Šimic G, Rasin MR, Uylings HB, Rakic P, Kostovic I (2011) Extraordinary neoteny of synaptic spines in the human prefrontal cortex. Proc Natl Acad Sci U S A 108:13281–13286. 10.1073/pnas.1105108108 [DOI] [PMC free article] [PubMed] [Google Scholar]
- Rakic P. (1988) Specification of cerebral cortical areas. Science 241:170–176. 10.1126/science.3291116 [DOI] [PubMed] [Google Scholar]
- Raznahan A, Shaw P, Lalonde F, Stockman M, Wallace GL, Greenstein D, Clasen L, Gogtay N, Giedd JN (2011) How does your cortex grow? J Neurosci 31:7174–7177. 10.1523/JNEUROSCI.0054-11.2011 [DOI] [PMC free article] [PubMed] [Google Scholar]
- Reuter M, Rosas HD, Fischl B (2010) Highly accurate inverse consistent registration: a robust approach. Neuroimage 53:1181–1196. 10.1016/j.neuroimage.2010.07.020 [DOI] [PMC free article] [PubMed] [Google Scholar]
- Reuter M, Schmansky NJ, Rosas HD, Fischl B (2012) Within-subject template estimation for unbiased longitudinal image analysis. Neuroimage 61:1402–1418. 10.1016/j.neuroimage.2012.02.084 [DOI] [PMC free article] [PubMed] [Google Scholar]
- Reuter M, Tisdall MD, Qureshi A, Buckner RL, van der Kouwe AJ, Fischl B (2015) Head motion during MRI acquisition reduces gray matter volume and thickness estimates. Neuroimage 107:107–115. 10.1016/j.neuroimage.2014.12.006 [DOI] [PMC free article] [PubMed] [Google Scholar]
- Satterthwaite TD, Wolf DH, Loughead J, Ruparel K, Elliott MA, Hakonarson H, Gur RC, Gur RE (2012) Impact of in-scanner head motion on multiple measures of functional connectivity: relevance for studies of neurodevelopment in youth. Neuroimage 60:623–632. 10.1016/j.neuroimage.2011.12.063 [DOI] [PMC free article] [PubMed] [Google Scholar]
- Ségonne F, Dale AM, Busa E, Glessner M, Salat D, Hahn HK, Fischl B (2004) A hybrid approach to the skull stripping problem in MRI. Neuroimage 22:1060–1075. 10.1016/j.neuroimage.2004.03.032 [DOI] [PubMed] [Google Scholar]
- Ségonne F, Pacheco J, Fischl B (2007) Geometrically accurate topology-correction of cortical surfaces using nonseparating loops. IEEE Trans Med Imaging 26:518–529. 10.1109/TMI.2006.887364 [DOI] [PubMed] [Google Scholar]
- Seldon HL. (2005) Does brain white matter growth expand the cortex like a balloon? Hypothesis and consequences. Laterality 10:81–95. [DOI] [PubMed] [Google Scholar]
- Seldon HL. (2007) Extended neocortical maturation time encompasses speciation, fatty acid and lateralization theories of the evolution of schizophrenia and creativity. Med Hypotheses 69:1085–1089. 10.1016/j.mehy.2007.03.001 [DOI] [PubMed] [Google Scholar]
- Shaw P, Lerch J, Greenstein D, Sharp W, Clasen L, Evans A, Giedd J, Castellanos FX, Rapoport J (2006) Longitudinal mapping of cortical thickness and clinical outcome in children and adolescents with attention-deficit/hyperactivity disorder. Arch Gen Psychiatry 63:540–549. 10.1001/archpsyc.63.5.540 [DOI] [PubMed] [Google Scholar]
- Shaw P, Eckstrand K, Sharp W, Blumenthal J, Lerch JP, Greenstein D, Clasen L, Evans A, Giedd J, Rapoport JL (2007) Attention-deficit/hyperactivity disorder is characterized by a delay in cortical maturation. Proc Natl Acad Sci U S A 104:19649–19654. 10.1073/pnas.0707741104 [DOI] [PMC free article] [PubMed] [Google Scholar]
- Shaw P, Kabani NJ, Lerch JP, Eckstrand K, Lenroot R, Gogtay N, Greenstein D, Clasen L, Evans A, Rapoport JL, Giedd JN, Wise SP (2008) Neurodevelopmental trajectories of the human cerebral cortex. J Neurosci 28:3586–3594. 10.1523/JNEUROSCI.5309-07.2008 [DOI] [PMC free article] [PubMed] [Google Scholar]
- Sled JG, Zijdenbos AP, Evans AC (1998) A nonparametric method for automatic correction of intensity nonuniformity in MRI data. IEEE Trans Med Imaging 17:87–97. 10.1109/42.668698 [DOI] [PubMed] [Google Scholar]
- Sowell ER, Thompson PM, Leonard CM, Welcome SE, Kan E, Toga AW (2004) Longitudinal mapping of cortical thickness and brain growth in normal children. J Neurosci 24:8223–8231. 10.1523/JNEUROSCI.1798-04.2004 [DOI] [PMC free article] [PubMed] [Google Scholar]
- Storsve AB, Fjell AM, Tamnes CK, Westlye LT, Overbye K, Aasland HW, Walhovd KB (2014) Differential longitudinal changes in cortical thickness, surface area and volume across the adult life span: regions of accelerating and decelerating change. J Neurosci 34:8488–8498. 10.1523/JNEUROSCI.0391-14.2014 [DOI] [PMC free article] [PubMed] [Google Scholar]
- Sullivan EV, Pfefferbaum A, Rohlfing T, Baker FC, Padilla ML, Colrain IM (2011) Developmental change in regional brain structure over 7 months in early adolescence: comparison of approaches for longitudinal atlas-based parcellation. Neuroimage 57:214–224. 10.1016/j.neuroimage.2011.04.003 [DOI] [PMC free article] [PubMed] [Google Scholar]
- Tamnes CK, Walhovd KB, Dale AM, Østby Y, Grydeland H, Richardson G, Westlye LT, Roddey JC, Hagler DJ Jr, Due-Tønnessen P, Holland D, Fjell AM, Alzheimer's Disease Neuroimaging Initiative (2013) Brain development and aging: overlapping and unique patterns of change. Neuroimage 68:63–74. 10.1016/j.neuroimage.2012.11.039 [DOI] [PMC free article] [PubMed] [Google Scholar]
- Tisdall MD, Reuter M, Qureshi A, Buckner RL, Fischl B, van der Kouwe AJ (2016) Prospective motion correction with volumetric navigators (vNavs) reduces the bias and variance in brain morphometry induced by subject motion. Neuroimage 127:11–22. 10.1016/j.neuroimage.2015.11.054 [DOI] [PMC free article] [PubMed] [Google Scholar]
- van Soelen IL, Brouwer RM, van Baal GC, Schnack HG, Peper JS, Collins DL, Evans AC, Kahn RS, Boomsma DI, Hulshoff Pol HE (2012) Genetic influences on thinning of the cerebral cortex during development. Neuroimage 59:3871–3880. 10.1016/j.neuroimage.2011.11.044 [DOI] [PubMed] [Google Scholar]
- Vandekar SN, Shinohara RT, Raznahan A, Roalf DR, Ross M, DeLeo N, Ruparel K, Verma R, Wolf DH, Gur RC, Gur RE, Satterthwaite TD (2015) Topologically dissociable patterns of development of the human cerebral cortex. J Neurosci 35:599–609. 10.1523/JNEUROSCI.3628-14.2015 [DOI] [PMC free article] [PubMed] [Google Scholar]
- Vidal-Piñeiro D, Walhovd KB, Storsve AB, Grydeland H, Rohani DA, Fjell AM (2016) Accelerated longitudinal gray/white matter contrast decline in aging in lightly myelinated cortical regions. Hum Brain Mapp 37:3669–3684. 10.1002/hbm.23267 [DOI] [PMC free article] [PubMed] [Google Scholar]
- Vijayakumar N, Allen NB, Youssef G, Dennison M, Yücel M, Simmons JG, Whittle S (2016) Brain development during adolescence: a mixed-longitudinal investigation of cortical thickness, surface area, and volume. Hum Brain Mapp 37:2027–2038. 10.1002/hbm.23154 [DOI] [PMC free article] [PubMed] [Google Scholar]
- Walhovd KB, Fjell AM, Giedd J, Dale AM, Brown TT (2017) Through thick and thin: a need to reconcile contradictory results on trajectories in human cortical development. Cereb Cortex 1:11 10.1093/cercor/bhv301 [DOI] [PMC free article] [PubMed] [Google Scholar]
- Whitaker KJ, Vértes PE, Romero-Garcia R, Váša F, Moutoussis M, Prabhu G, Weiskopf N, Callaghan MF, Wagstyl K, Rittman T, Tait R, Ooi C, Suckling J, Inkster B, Fonagy P, Dolan RJ, Jones PB, Goodyer IM, the NSPN Consortium, Bullmore ET. (2016) Adolescence is associated with genomically patterned consolidation of the hubs of the human brain connectome. Proc Natl Acad Sci U S A 113:9105–9110. 10.1073/pnas.1601745113 [DOI] [PMC free article] [PubMed] [Google Scholar]
- White T, Su S, Schmidt M, Kao CY, Sapiro G (2010) The development of gyrification in childhood and adolescence. Brain Cogn 72:36–45. 10.1016/j.bandc.2009.10.009 [DOI] [PMC free article] [PubMed] [Google Scholar]
- Wierenga LM, Langen M, Oranje B, Durston S (2014) Unique developmental trajectories of cortical thickness and surface area. Neuroimage 87:120–126. 10.1016/j.neuroimage.2013.11.010 [DOI] [PubMed] [Google Scholar]
- Wood SN. (2006) Generalized additive models: an introduction with R. Boca Raton, FL: Chapman and Hall/CRC. [Google Scholar]
- Yakovlev PA, Lecours IR (1967) The myelogenetic cucles of regional maturation of the brain. In: Regional development of the brain in early life (Minkowski A, ed), pp 3–70. Oxford: Blackwell. [Google Scholar]
- Zhou D, Lebel C, Treit S, Evans A, Beaulieu C (2015) Accelerated longitudinal cortical thinning in adolescence. Neuroimage 104:138–145. 10.1016/j.neuroimage.2014.10.005 [DOI] [PubMed] [Google Scholar]
- Zielinski BA, Prigge MB, Nielsen JA, Froehlich AL, Abildskov TJ, Anderson JS, Fletcher PT, Zygmunt KM, Travers BG, Lange N, Alexander AL, Bigler ED, Lainhart JE (2014) Longitudinal changes in cortical thickness in autism and typical development. Brain 137:1799–1812. 10.1093/brain/awu083 [DOI] [PMC free article] [PubMed] [Google Scholar]