Significance
BRCA1 associated protein 1 (BAP1) is a tumor suppressor and its inactivating mutations frequently occur in a subset of human cancers. This study reveals an unexpected finding that loss of BAP1 compromises the cellular adaptability to metabolic stress, and links BAP1 to unfolded protein response to regulate cell survival under metabolic stress. We also report the first line of in vivo evidence that Bap1 KO mice experienced unresolved endoplasmic reticulum stress in the kidney. Our study not only provides mechanical insights for BAP1 functions in cell survival upon metabolic stress through endoplasmic reticulum stress signaling, but also may provide a conceptual framework for further understanding BAP1 function in cancer.
Keywords: BAP1, ER stress, unfolded protein response, energy stress, glucose starvation
Abstract
The endoplasmic reticulum (ER) is classically linked to metabolic homeostasis via the activation of unfolded protein response (UPR), which is instructed by multiple transcriptional regulatory cascades. BRCA1 associated protein 1 (BAP1) is a tumor suppressor with de-ubiquitinating enzyme activity and has been implicated in chromatin regulation of gene expression. Here we show that BAP1 inhibits cell death induced by unresolved metabolic stress. This prosurvival role of BAP1 depends on its de-ubiquitinating activity and correlates with its ability to dampen the metabolic stress-induced UPR transcriptional network. BAP1 inhibits glucose deprivation-induced reactive oxygen species and ATP depletion, two cellular events contributing to the ER stress-induced cell death. In line with this, Bap1 KO mice are more sensitive to tunicamycin-induced renal damage. Mechanically, we show that BAP1 represses metabolic stress-induced UPR and cell death through activating transcription factor 3 (ATF3) and C/EBP homologous protein (CHOP), and reveal that BAP1 binds to ATF3 and CHOP promoters and inhibits their transcription. Taken together, our results establish a previously unappreciated role of BAP1 in modulating the cellular adaptability to metabolic stress and uncover a pivotal function of BAP1 in the regulation of the ER stress gene-regulatory network. Our study may also provide new conceptual framework for further understanding BAP1 function in cancer.
Animal cells rely on nutrient supplies (e.g., glucose, and oxygen) to generate energy and biomaterials and to maintain cellular homeostasis under both physiological and pathological conditions. The metabolic stress response, defined as how cells respond to the lack of nutrient supplies in an adaptive or suicidal manner, is therefore essential to cellular functions and survival. Cells use multiple signaling cascades to adapt cellular functions and control cell fate in a manner dependent on the duration and strength of stress (1). Elucidating the molecular mechanisms of metabolic stress response is thus important for more in-depth understanding of organism development and human disease.
The evolutionarily conserved unfolded protein response (UPR) protects cells against the stress of misfolded proteins in the endoplasmic reticulum (ER) for continued survival, and will initiate regulated cell death if the ER stress cannot be resolved (2). The key to UPR-mediated cell fate decision is the gene-expression network driven by the ER stress-activated transcriptional factors (TFs) (3). The canonical UPR TFs include X-box binding protein 1 (XBP1), activating transcription factor 6 (ATF6), ATF4, and C/EBP homologous protein (CHOP), which function downstream of three ER-localized stress sensors: inositol-requiring enzyme 1α (IRE1α), ATF6, and double-stranded RNA-dependent protein kinase (PKR)-like ER kinase (PERK), respectively. Of the UPR gene regulatory network, the ATF4/CHOP arm mediates expression of genes that promote the ER stress-induced cell death by causing ATP depletion and inducing reactive oxidative stress (ROS) (4). Although the three parallel arms of UPR use different signaling cascades and TFs to independently transduce the ER stress signals into the nucleus, their transcriptional effects significantly overlap because of the feed-forward regulations of the expression of these UPR TFs (5). However, little is known as how the expression of these UPR TFs is coregulated.
BAP1 (BRCA1-associated protein 1) functions as a nuclear de-ubiquitinating (DUB) enzyme, and regulates cellular processes, including transcription, DNA replication fork progression, and DNA double-strand break repair in a DUB-dependent manner (6). BAP1 interacts with several chromatin-modifying factors and TFs (6), underscoring the important role of BAP1 in the regulation of gene transcription. BAP1 is a tumor-suppressor gene located on chromosome 3p21, a genomic locus frequently deleted in human cancers. Both somatic and germ-line inactivating mutations of BAP1 occur in a variety of cancers, including uveal melanomas, mesotheliomas, and renal cell carcinoma (6). Paradoxically, in certain cancers, low expressions of WT BAP1 or BAP1 mutations correlate with longer patient survival (7, 8), suggesting that BAP1 may play complex and context-dependent roles in the regulation of cancer cell survival and death, a question that remains largely unexplored. The direct transcriptional targets of BAP1 in the mammalian system, particularly through which BAP1 controls cell death, also remains unknown currently. Because cancer cells consistently experience metabolic stress during tumor development and therapeutic prevention, and compromised adaptability to cellular metabolic stress may influence tumor incidence as well as patient survival (9), in this study we have investigated the potential role of BAP1 in metabolic stress response.
Results
BAP1 Inhibits Glucose Deprivation-Induced Apoptosis.
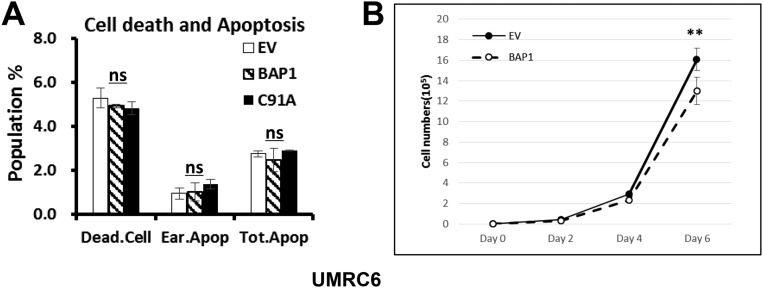
To investigate the potential role of BAP1 in energy stress response, we established cell lines stably expressing BAP1 WT, BAP1 C91A mutant (which abolishes BAP1 DUB activity), and the empty vector (EV) control in UMRC6 cells, a BAP1-deficient renal cancer cell line (10) (Fig. 1A). We found that, under normal culture conditions (with 25 mM glucose), BAP1 reexpression in these cells did not significantly affect basal cell death, and only inhibited cell proliferation very moderately (Fig. S1). We then examined whether glucose deprivation provoked any differential cytotoxic effect in these cells. Examination of cell morphology and further analysis by Annexin V/Propidium Iodide (PI) staining revealed that restoring the expression of BAP1 WT, but not BAP1-C91A mutant, in UMRC6 cells attenuated glucose deprivation-induced cell death (Fig. 1B and Fig. S2A), suggesting that BAP1 promotes cell survival in UMRC6 cells under glucose starvation, which is dependent on its DUB activity.
Fig. 1.
BAP1 inhibits cell apoptosis induced by glucose deprivation. (A–D) The effects of reexpression of BAP1-WT or BAP1-C91A mutant on glucose deprivation-induced cell death in BAP1-deficient UMRC6 (A and B) or NCI-H226 cells (C and D). (E and F) The effect of BAP1 knockdown on glucose deprivation-induced apoptosis in 786-O cells. **P < 0.01; ns, nonsignificant. CTRL, with glucose; EV, empty vector (A–D) or control shRNA (E and F). NG14/NG24, no glucose for 14 or 24 h.
Fig. S1.
The effects of reexpression of BAP1 on basal cell viability and cell proliferation in UMRC6 cells. (A) Reexpression of BAP1 and BAP1-C91A mutant did not affect basal cell viability in UMRC6 cells. UMRC6 stable cells were cultured in media containing 25 mM glucose for 48 h, stained with Annexin V-FITC and PI, and analyzed by FACS. Early apoptotic (Ear.Apop): Annexin V+/PI− population; total apoptotic population (Tot.Apop): Annexin V+ population; dead cells (Dead.Cell): PI+ population. ns, nonsignificant. (B) Reexpression of BAP1 moderately inhibits the cell growth in UMRC6 cells. UMRC6 stable cells were cultured in media containing 25 mM glucose for up to 6 d, and cell number were analyzed at indicated days. **P < 0.01.
Fig. S2.
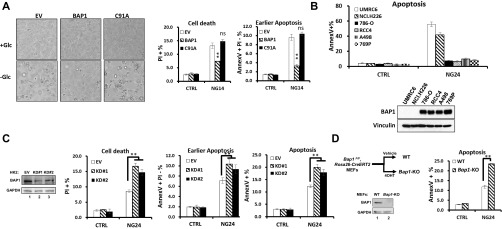
BAP1 inhibits cell apoptosis induced by glucose deprivation in different cell lines. (A) Reexpression of BAP1-WT and BAP1-C91A mutant on glucose deprivation-induced cell death in UMRC6 cells. UMRC6 stable cells cultured in growth media containing 0 mM glucose (−Glc or NG14) or 25 mM glucose (+Glc or CTRL) for 14 h were examined by microscopy (Left) or analyzed by Annexin V/PI staining followed by FACS (Right). (Magnification: 10×.) (B) The correlation of sensitivity to glucose starvation-induced cell death and BAP1 expression among different cancer cell lines. (Upper) Indicated cancer cells cultured with glucose containing or free medium for 24 h (CTRL or NG24) were analyzed by Annexin V/PI staining followed by FACS. Total apoptotic (Annexin V+) populations were shown. (Lower) BAP1 levels in these cancer cell lines were examined by Western blot. (C) BAP1 knockdown on glucose deprivation-induced apoptosis in HK2 cells. (Left) Cell lysates from HK2 cells stabling expressing control shRNA (EV) or two independent BAP1-targeting shRNAs (KD#1, and KD#2) were examined by Western blot. (Right) HK2 stable cells cultured with glucose containing or free medium for different hours were assayed for cell apoptosis by FACS. (D) The effect of Bap1 deletion on glucose deprivation-induced apoptosis in primary MEFs. (Left) Cell lysates from Bap1F/F, Rosa26-CreERT2 primary MEFs treated with vehicle (WT MEFs) or 4OHT (Bap1 KO MEFs) for 7 d were examined by Western blot. (Right) MEFs cultured with glucose containing or free medium for 24 h (CTRL or NG24) were assayed for cell apoptosis by FACS. **P < 0.01; ns, nonsignificant.
We next compared glucose starvation-induced cell death in a few cancer cell lines with BAP1-deficient or -proficient status. Such analysis revealed that two BAP1-deficient cancer cells, UMRC6 and NCI-H226 cells, are more sensitive to glucose starvation-induced cell death than other BAP1-proficient cancer cells (Fig. S2B). Importantly, similar to UMRC6 cells, restoration of BAP1 expression in NCI-H226 cells protected cells from glucose starvation-induced cell death (Fig. 1 C and D), whereas BAP1 knockdown by two independent shRNAs in BAP1 proficient 786-O cells sensitized cells to glucose starvation-induced cell death (Fig. 1 E and F). Finally, BAP1 knockdown in HK2 cells (Fig. S2C), an immortalized kidney epithelial cell line isolated from normal human kidney, or Bap1 deletion in primary Bap1F/F; Rosa26-CreERT2 MEFs (Fig. S2D), also promoted glucose starvation-induced cell death, suggesting that BAP1 also regulates glucose deprivation-induced cell death in nontransformed cellular contexts. Collectively, these results clearly demonstrated a prosurvival role of BAP1 in glucose deprivation-induced cell death and suggested an uncharacterized role of BAP1 in mediating metabolic stress response.
BAP1 Targets the ER Stress Gene Network Under Glucose Deprivation.
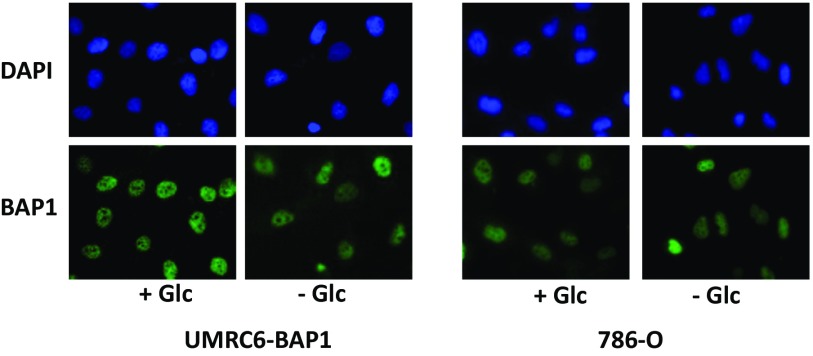
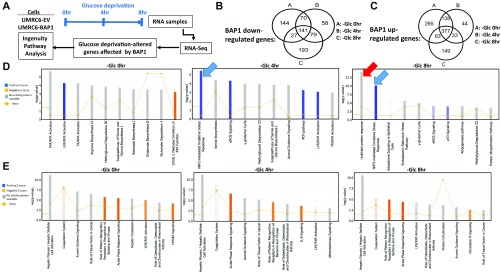
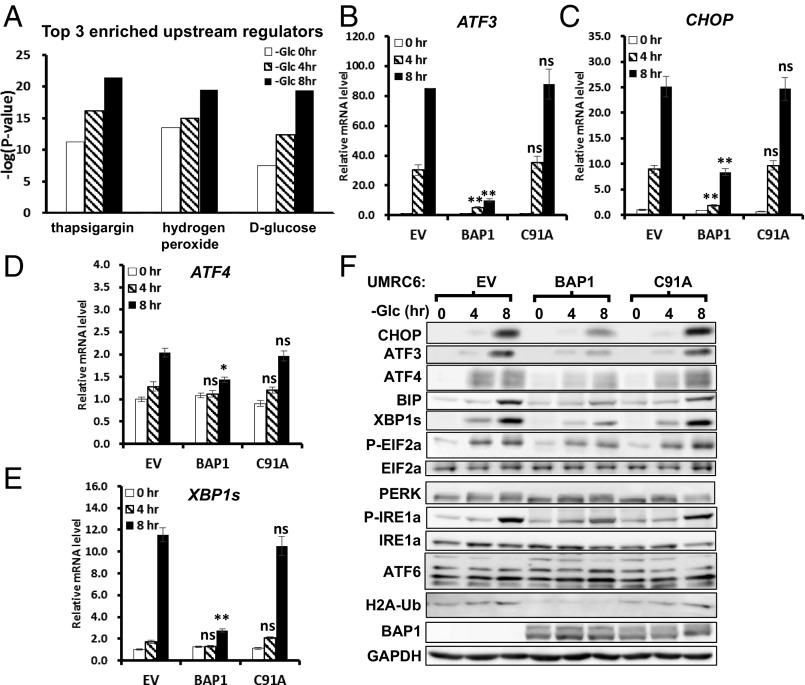
Because glucose deprivation did not affect the nuclear localization of BAP1 in UMRC6-BAP1 or 786-O cells (Fig. S3), we reasoned that nuclear BAP1 likely regulates this metabolic regulatory network at the level of gene transcription. To test this theory, we performed RNA sequencing (RNA-Seq) analysis in UMRC6-EV and UMRC6-BAP1 WT stable cell lines at 0, 4, and 8 h upon glucose starvation (Fig. S4A). Computational analysis identified many genes differentially regulated by BAP1 (either up- or down-regulated) at each time point (Fig. S4 B and C). Ingenuity pathway analysis (IPA) revealed that, although some pathways were enriched at all three time points, other pathways—most notably UPR and oxidative stress response-related pathways—were not enriched under basal condition (at the 0-h time point), but specifically enriched upon glucose starvation (Fig. S4 D and E). Consistent with this finding, IPA comparison analysis for the enriched upstream regulators revealed that thapsigargin (a known ER stress inducer) -induced UPR and hydrogen peroxide-induced oxidative stress response were most significantly up-regulated upon glucose starvation (Fig. 2A). Together, these computational analyses suggested that BAP1 may regulate UPR and oxidative stress response under glucose starvation.
Fig. S3.
The effect of glucose deprivation on BAP1 subcellular localization. UMRC6-BAP1 stable cells or 786-O cells were cultured in the growth media with (+Glc) or without (−Glc) 25 mM glucose for 4 h; cells were then fixed and assayed by immunofluorescence using anti-BAP1 antibody. DAPI staining indicated the nucleus. (Magnification: 10×.)
Fig. S4.
RNA-Seq analysis of the up-/down-regulated genes and Pathways affected by BAP1 upon glucose stress. (A) Schematic diagram of RNA-Seq experiment design and analysis workflow. (B and C) The numbers of significantly altered genes [(B) BAP1 down-reglated genes; (C) BAP1 up-regulated genes (≥twofold difference)] at 0, 4, or 8 h after glucose deprivation in UMRC6 cells are indicated in Venn diagram. (D and E) The cellular pathways enriched upon BAP1 expression at each time point are indicated: (D) enriched pathways among BAP1-downreglated genes; (E) enriched pathways among BAP1 up-regulated genes. Arrows indicate UPR and oxidative stress response-related pathways.
Fig. 2.
BAP1 targets the ER stress gene network under glucose deprivation. (A) Top three enriched upstream regulators (as indicated on x axes) from IPA comparison analysis. (B–F) The effect of BAP1 or BAP1-C91A reexpression on glucose deprivation-induced UPR effectors in UMRC6 cells analyzed by real-time qPCR (B–E) and Western blotting (F). *P < 0.05; **P < 0.01; ns, nonsignificant.
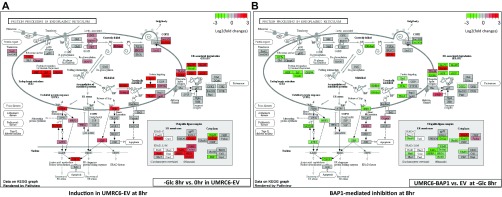
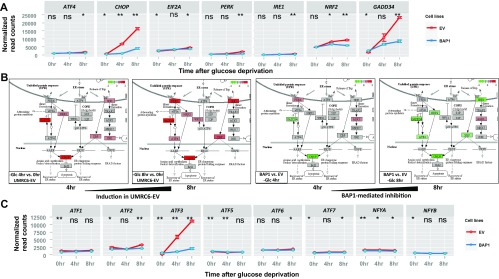
We then integrated the RNA-Seq data with the pathways of protein processing in ER [Kyoto Encyclopedia of Genes and Genomes (KEGG): ko04141] and visualized the expression fold-changes of genes involved in UPR. Consistent with the notion that glucose deprivation induces UPR (11), 8-h glucose deprivation transcriptionally induced a large set of genes related to UPR in UMRC6-EV cells (Fig. S5A). Notably, reexpression of BAP1 in UMRC6 cells significantly inhibited the induction of these UPR effectors under glucose starvation (Fig. S5B). Among these UPR effectors, CHOP and ATF3 were rapidly induced even at 4 h upon glucose deprivation in UMRC6-EV cells, and their induction was dramatically inhibited by BAP1 (Fig. S6).
Fig. S5.
BAP1 inhibits glucose deprivation-induced UPR gene regulatory network activation. Genes belonging to the Protein processing in ER pathway (KEGG: ko04141; www.genome.jp/dbget-bin/www_bget?pathway+ko04141) were plotted in pseudocolor indicative of its mRNA fold-changes (log2-transformed) on top of the pathway diagrams. Red: 2–8+ fold up-regulation; gray: less than twofold alteration; green: 2–8+ fold down-regulation. (A) Eight-hour glucose deprivation-induced UPR gene changes in UMRC6-EV cells. (B) Upon 8-h glucose deprivation, BAP1-affected UPR gene changes.
Fig. S6.
The effect of BAP1 on glucose starvation-induced UPR gene expression. (A) The expression levels of various UPR effectors were plotted using normalized read counts from RNA-Seq dataset. (B) BAP1 inhibits glucose starvation-induced UPR genes implicated in ER-nucleus signal cascades. The diagrams were prepared from the same Pathview analysis as shown Fig. 2C. (C) The expression levels of various secondary UPR TFs were plotted using normalized read counts from RNA-Seq dataset. *P < 0.05; **P < 0.01; ns, nonsignificant.
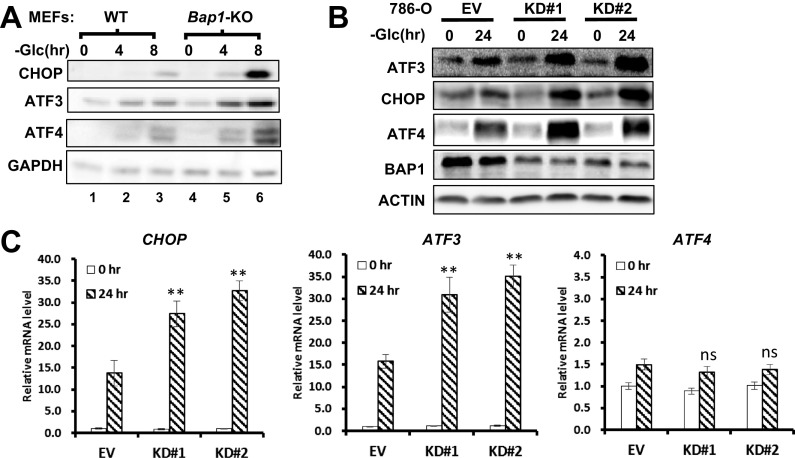
Consistent with our RNA-Seq data, real-time quantitative PCR (qPCR) and Western blot analyses confirmed that BAP1-WT, but not BAP1-C91A, inhibited glucose starvation-induced expression of these UPR effectors (except ATF4, which is mainly modulated at translational level in UPR) at both mRNA and protein levels in UMRC6 cells (Fig. 2 B–F). BAP1 also repressed glucose starvation-induced IRE1α and PERK phosphorylation of eukarotic initiation factor 2-α (eIF2α) (Fig. 2F). Finally, we showed that Bap1 deletion in mouse embryonic fibroblasts (MEFs) or BAP1 knockdown in 876-O cells further increased glucose starvation-induced UPR effectors (Fig. S7). Taken together, these results clearly demonstrate that BAP1 regulates the ER stress gene network under glucose deprivation.
Fig. S7.
The effect of BAP1 deficiency on glucose deprivation-induced UPR effectors. (A) The effects of Bap1 deletion on UPR effector activation induced by glucose deprivation in MEFs were examined by Western blot. (B and C) The effect of BAP1 knockdown on glucose deprivation-induced UPR effectors in 786-O cells at 24 h was assayed by Western blot (B) and real-time qPCR (C). **P < 0.01; ns, nonsignificant.
BAP1 Inhibits UPR-Mediated ROS Induction and ATP Depletion.
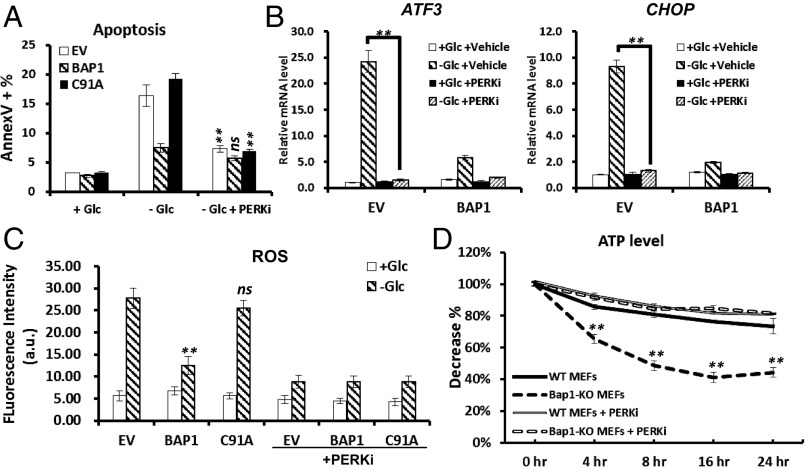
Because unresolved ER stress leads to cell death, we next sought to determine whether BAP1 inhibits glucose deprivation-induced apoptosis through repressing UPR. It has been consistently documented that PERK-mediated phosphorylation of eIF2α and up-regulation of ATF4 and CHOP lead to ATP depletion or ROS induction through the ATF4/CHOP-driven gene regulatory network, eventually resulting in unresolved ER stress-induced cell death (4, 12). Indeed, PERK kinase inhibitor (PERKi) treatment normalized glucose deprivation-induced apoptosis in UMRC6-EV and UMRC6-BAP1 C91A cells (Fig. 3A) or 786-O cells with BAP1 knockdown (Fig. S8A). PERKi also inhibited the induction of ATF3/CHOP mRNAs upon glucose withdrawal (Fig. 3B). These results suggested that BAP1 regulates glucose deprivation-induced apoptosis at least partly through PERK-mediated ER stress signaling.
Fig. 3.
BAP1 inhibits UPR-mediated ROS induction and ATP depletion. (A) The effect of PERK inhibitor on glucose deprivation-induced apoptosis in UMRC6 stable cells. (B) The effect of PERK inhibitor on glucose deprivation-induced UPR effectors in UMRC6 stable cells. (C) The effect of reexpression of BAP1 and BAP1-C91A mutant on glucose deprivation-induced ROS in UMRC6 stable cells. (D) The effect of Bap1 deletion on glucose deprivation-induced ATP depletion in MEFs. **P < 0.01; ns, nonsignificant.
Fig. S8.
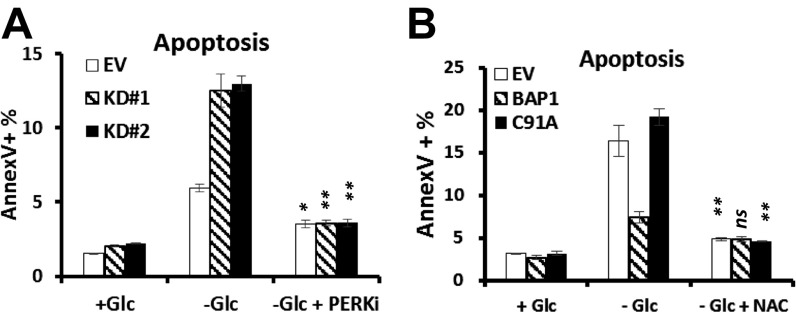
The effects of PERKi and NAC treatment on glucose starvation-induced cell death. (A) The effect of PERK inhibitor on glucose deprivation-induced apoptosis in 786-O stable cells. 786-O stable cells were cultured in glucose-free medium with 5-nM PERK inhibitor (−Glc +PERKi) or vehicle (−Glc) for 24 h, then assayed for cell apoptosis by FACS. (B) The effect of antioxidant NAC on glucose deprivation-induced apoptosis in UMRC6 stable cells. Cells were cultured in glucose-free medium with 5 nM NAC (−Glc +NAC) or vehicle (−Glc) for 14 h, then assayed for cell apoptosis by FACS. *P < 0.05; **P < 0.01; ns: nonsignificant.
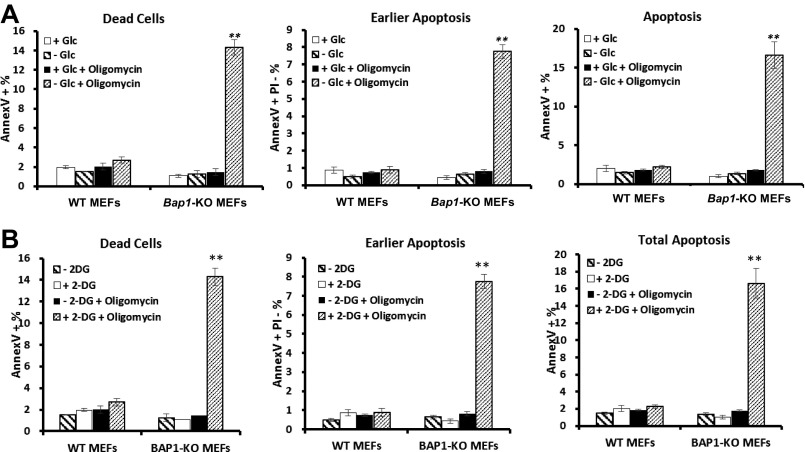
Next we examined whether BAP1 also regulates UPR-mediated ROS induction and ATP depletion. Reexpression of BAP1-WT, but not BAP1-C69A mutant, in UMRC6 cells inhibited the increase of ROS under glucose starvation, and glucose starvation-induced ROS can be normalized by PERKi treatment (Fig. 3C). Relieving ROS by using N-acetyl cysteine (NAC), a known antioxidant, blocked glucose deprivation-induced cell death in UMRC6 cell lines, confirming the contribution of ROS induction on glucose starvation-induced cell death (Fig. S8B). Glucose deprivation led to more decrease of cellular ATP levels in Bap1 KO MEFs than in WT MEFs, and ATP depletion in Bap1 KO MEFs upon glucose starvation can be largely rescued by PERKi treatment (Fig. 3D), suggesting that loss of Bap1 compromised the cellular adaptability to main ATP levels. Correspondingly, glucose deprivation combined with the treatment of ATP synthase inhibitor oligomycin induced substantially more cell death in Bap1 KO MEFs than in Bap1 WT MEFs (Fig. S9A). Similar observation was also made by the treatment of 2 deoxy-glucose (2DG), a glycolysis inhibitor, in combination with oligomycin (Fig. S9B). Collectively, these results suggested that BAP1 protects cells from apoptosis by preventing ATP depletion or ROS induction through inhibiting PERK-mediated ER stress signaling.
Fig. S9.
The effect of Bap1 deletion on energy stress-induced apoptosis in MEFs. (A) Bap1 WT and KO MEFs were cultured in 25 mM or 0 mM glucose medium with or without 1 mM oligomycin treatment for 4 h, then assayed for apoptosis by FACS. (B) Bap1 WT and KO MEFs cultured in 25 mM glucose medium were treated with 20 mM 2-DG and 1 mM oligomycin, either alone or in combination, for 4 h, then assayed for apoptosis by FACS. Early apoptotic cells: Annexin V+/PI− population; Total apoptotic cells: Annexin V+ population; Dead cells: PI+ population; **P < 0.01; ns, nonsignificant.
BAP1 Directly Represses ATF3 and CHOP Transcription.
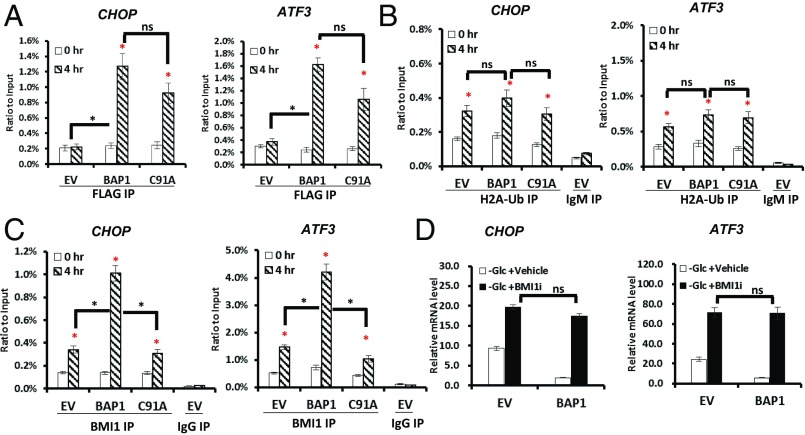
The rapid down-regulation of ATF3 and CHOP, among other UPR effectors, by BAP1 (Fig. 2) raised the possibility that they may be BAP1 direct targets. Indeed, the ChIP assay demonstrated that glucose deprivation induced the binding of BAP1 to the promoter of ATF3 or CHOP, and interestingly, BAP1-C91A mutant bound to the promoters with the comparable level to that of BAP1 WT (Fig. 4A), suggesting that the DUB activity of BAP1 likely is not required for BAP1 association with these promoters. BAP1-mediated transcriptional repression has been associated with BAP1 function to remove the monoubiquitination of histone 2A (H2A) through its DUB activity (13). ChIP analysis revealed that 4-h glucose deprivation promoted H2A-Ub association with the promoter of ATF3 or CHOP in UMRC6-EV cells; furthermore, BAP1 did not significantly affect the level of H2A-Ub binding to ATF3 or CHOP promoter (Fig. 4B).
Fig. 4.
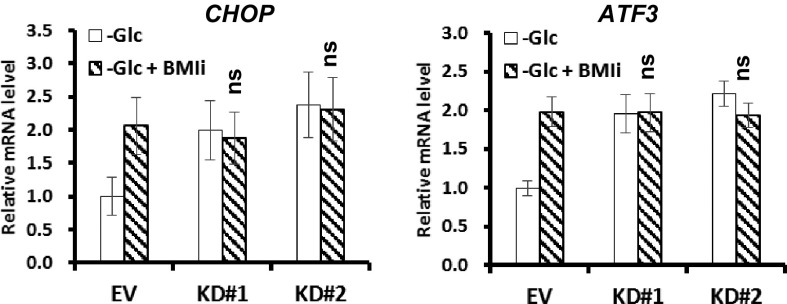
BAP1 directly represses ATF3 and CHOP transcription in a manner dependent on BMI1. (A–C) Glucose deprivation-induced binding of BAP1 (A), H2A-Ub (B), or BMI1 (C) to the promoters of CHOP and ATF3 in UMRC6 cells. (D) The effect of BMI1 inhibitor on glucose deprivation-induced UPR TFs in UMRC6 stable cells. *P < 0.05; ns, nonsignificant. Red asterisks indicate the comparison between glucose deprivation for 0 and 4 h in each cell line.
BMI1-containing Polycomb repressive complex 1 (PRC1), a ubiquitin ligase complex, mediates the monoubiquitination of H2A. It has been suggested that an appropriate balance between H2A ubiquitination and DUB is important for the maintenance of target gene repression (14). We thus examined the binding of BMI1 to ATF3 or CHOP promoter under glucose deprivation. ChIP analysis revealed that glucose deprivation induced the binding of BMI1 to these promoters (Fig. 4C). Interestingly, there was significantly more promoter-associated BMI1 in UMRC6-BAP1 WT cells than that in UMRC6-EV cells or UMRC6-BAP1 C91A cells under glucose starvation (Fig. 4C), suggesting that BAP1 promotes glucose deprivation-induced BMI1 binding to ATF3/CHOP promoters in a DUB-dependent manner. Given the important role of RING1B in BMI1-containing PRC1 complex (15), we also examined the binding of RING1B to ATF3 or CHOP promoter by ChIP analysis, which showed that the enrichment of RING1B to ATF3 or CHOP promoter mirrored that of BMI1 (Fig. S10).
Fig. S10.
RING1B ChIP analysis of CHOP and ATF3 genes. UMRC6 stable cells were cultured in glucose-free medium for 0 or 4 h, then assayed by ChIP using anti-RING1B antibody. The level of enriched promoters was examined by qPCR using primers specific for ATF3 and CHOP. HOXA10, a known BAP1 target gene, was also examined in the parallel RING1B ChIP analysis. *P < 0.05; ns, nonsignificant. Red asterisks indicate the comparison between glucose deprivation for 0 and 4 h under each condition.
We then examined whether BAP1-mediated transcriptional repression of ATF3 and CHOP requires BMI1, by using small chemical inhibitor that specifically targets BMI1 (BMI1i). Real-time qPCR analysis revealed that, under glucose starvation condition, BMI1i treatment increased ATF3 and CHOP expression in either UMRC6-EV or UMRC6-BAP1 WT cells (Fig. 4D), suggesting that, similar to BAP1, BMI1 also represses ATF3 and CHOP expression in response to glucose deprivation. In addition, in the presence of BMI1i, BAP1 failed to repress ATF3 or CHOP expression under glucose deprivation (Fig. 4D), suggesting that BMI1 is required for BAP1-mediated transcriptional repression of ATF3 and CHOP. Similar observation was made in 786-O cells with BAP1 knockdown (Fig. S11). We have also analyzed ATF4 in all of the experiments described above, which revealed negative results for ATF4 (Fig. S12). Collectively, these results provided evidence that BAP1 directly targets ATF3 and CHOP transcription upon glucose deprivation, and suggested a profound interplay between BAP1 and BMI1 (Discussion).
Fig. S11.
The effect of BMI1 inhibitor on glucose deprivation-induced UPR TFs. 786-O stable cells were cultured in glucose-free medium with vehicle or 5 nM BMI1 inhibitor PTC-209 (BMI1i) for 24 h, gene expression was then analyzed using real-time qPCR. ns, nonsignificant.
Fig. S12.
BAP1 does not bind on ATF4 promoter. (A) UMRC6 stables cell were cultured in glucose-free medium for 4 h, then assayed by ChIP using anti-FLAG (for BAP1), anti–H2A-Ub, or anti-BMI1 antibody. The level of enriched promoters was examined by qPCR using primers specific for each promoter. (B and C) The effect of BMI1 inhibitor on the expression of ATF4. UMRC6 (B) or 786-O (C) stable cells were cultured in glucose-free medium with vehicle or 5 nM BMI1 inhibitor PTC-209 (BMI1i) for 4 or 24 h, ATF4 gene expression was then analyzed using real-time qPCR.
BAP1 Modulates Metabolic Stress-Induced UPR and Apoptosis Through ATF3 and CHOP.
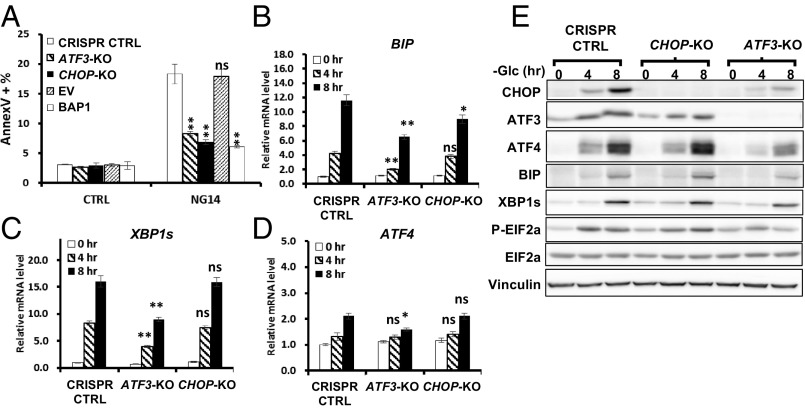
We next sought to determine the extent to which BAP1 inhibits glucose starvation-induced apoptosis through its target gene ATF3 or CHOP. To this end, we established ATF3 KO or CHOP KO UMRC6 cells via CRISPR/Cas9 technology. Our analyses revealed that deficiency of either ATF3 or CHOP in UMRC6 cells inhibited glucose deprivation-induced apoptosis to the level comparable to that in UMRC6 BAP1-WT cells (Fig. 5A), suggesting that both ATF3 and CHOP are important downstream effectors of BAP1 to regulate glucose starvation-induced apoptosis. We then examined glucose starvation-induced UPR effectors that were repressed by BAP1 in ATF3 KO or CHOP KO UMRC6 cells. We observed that ATF3 deficiency significantly attenuated glucose starvation-induced UPR effectors; on the other hand, CHOP deficiency had minimal or very moderate effect on glucose starvation-induced UPR effectors (Fig. 5 B–E and Fig. S13). As expected, the deficiency of ATF3 or CHOP did not significantly alter ATF4 mRNA levels (Fig. 5D). Taken together, these results suggested that BAP1 modulates UPR gene regulatory network and glucose starvation-induced apoptosis through ATF3 and CHOP.
Fig. 5.
BAP1 modulates metabolic stress-induced UPR and apoptosis through ATF3 and CHOP. (A) The effects of ATF3 KO, CHOP KO and BAP1 reexpression on the glucose deprivation-induced apoptosis in UMRC6 cells. (B–E) The effect of ATF3 KO or CHOP KO on glucose deprivation-induced UPR effectors in UMRC6 cells analyzed by real-time qPCR (B–D) or Western blot (E). *P < 0.05; **P < 0.01; ns, nonsignificant.
Fig. S13.
Real-time PCR analysis of the effect of ATF3 depletion on glucose starvation- induced XBP1 transcription and splicing. The effect of ATF3 deletion in UMRC6 cells on glucose deprivation-induced XBP1u (unspliced form) and XBP1s (spliced form), as well as the ratio XBP1s/XBP1u, was assayed by real-time qPCR. *P < 0.05; ns, nonsignificant.
Bap1 KO Mice Are More Sensitive to Tunicamycin Treatment.
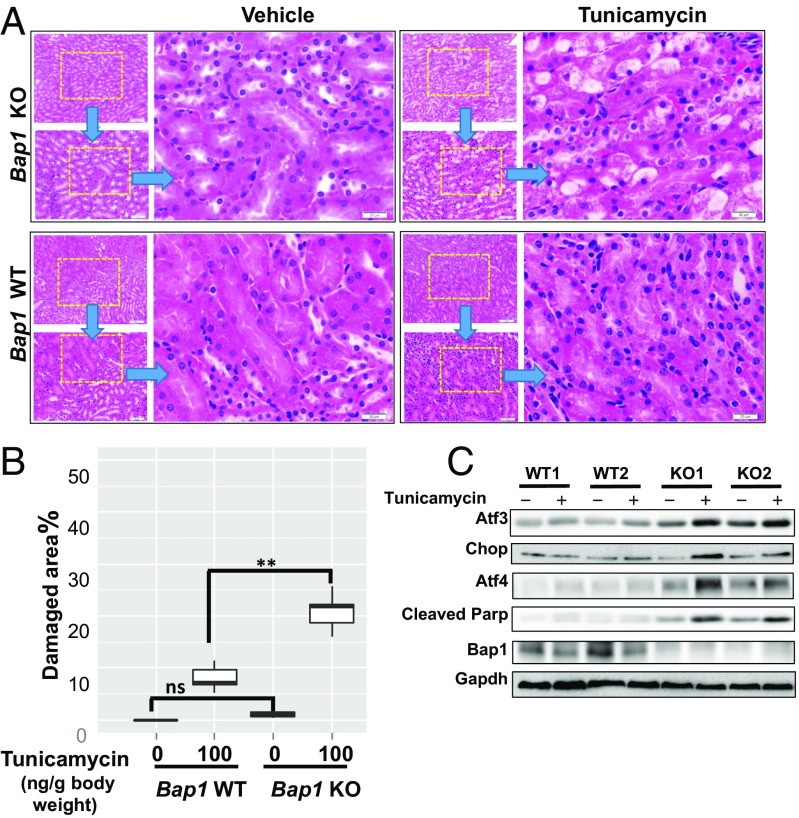
To investigate the potential role of BAP1 in the regulation of the ER stress in vivo, we generated conditional KO mice carrying floxed alleles of Bap1 (Bap1F/F), which were then crossed with Rose26-CreERT2 mice to generate Bap1F/F; Rosa26-CreERT2 mice (Fig. S14A). Bap1F/F; Rosa26-CreERT2 and control littermates Bap1F/F (or Bap1+/+; Rosa26-CreERT2) were injected with tamoxifen for 5 consecutive days at 4 wk of age, resulting in Bap1 WT and KO mice. The deletion of Bap1 in the kidney was confirmed by Western blotting (Fig. S14B). Tunicamycin-induced renal lesions have been well characterized to study the physiological relevance of ER stress in vivo (4). To examine whether Bap1 KO mice were more sensitive to tunicamycin-induced kidney damage, we treated Bap1 WT or KO mice with tunicamycin or vehicle at 4 d postcompleting tamoxifen injection (DPI), and then analyzed kidneys from these mice at 9 DPI (Fig. S14C). We found that, whereas Bap1 KO mice without tunicamycin treatment did not exhibit any obvious kidney damage phenotype at 9 DPI, Bap1 KO mice exhibited more severe kidney damage, characterized by larger vacuolization at the cortico–meduallary junction region in the kidney, than Bap1 WT mice treated with the same dosage of tunicamycin (100 ng/g body weight) (Fig. 6 A and B). Consistent with this, there were increased Atf3/Chop/Atf4 levels and enhanced apoptosis (as evidenced by increased Parp cleavage) in Bap1 KO kidneys than in WT kidneys upon tunicamycin treatment (Fig. 6C). Collectively, these results suggest that Bap1 KO mice experienced increased ER stress in vivo and were sensitive to tunicamycin treatment, which is consistent with the data from our in vitro analyses.
Fig. S14.
Generation and analysis of Bap1-deficient mice. (A) Schematic diagram of the generation of Bap1 KO alleles. Positions of Bap1 coding exons 3–5 as well as loxP recombination sites in Bap1 WT or Bap1 KO allele after Cre-mediated loxP recombination are indicated. (B) Tamoxifen-induced Bap1 deficiency in mice kidneys; 21 d after tamoxifen (Tam) injection, protein lysates were prepared from two pairs of representative Bap1 WT and KO mouse kidneys, and examined by Western blot. (C) Schematic diagram of tunicamycin treatment and kidney analysis in Bap1 WT and KO mice. Four days after tamoxifen injection, Bap1 WT and KO mice received a single dosage of tunicamycin (100 ng/g body weight). Five days later, mice kidneys were collected, stained with H&E and examined.
Fig. 6.
Bap1 KO mice are more sensitive to tunicamycin treatment. (A) Histology analysis of kidneys from Bap1 WT and KO mice with or without tunicamycin treatment. (Scale bars: Upper Insets, 200 μm; Lower Insets, 50 μm; Right, 20 μm.) (B) Box plot of relative quantification of tunicamycin-induced kidney damages in Bap1 WT and KO mice. **P < 0.01; ns, nonsignificant. (C) Western blot analysis of kidneys from Bap1 WT and KO mice with or without tunicamycin treatment.
Discussion
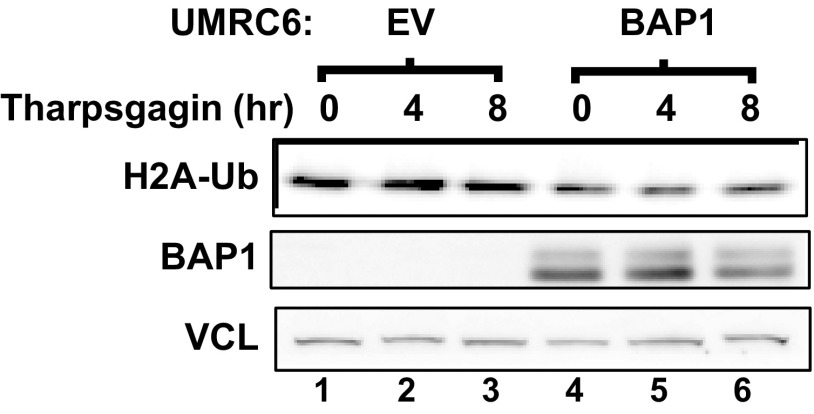
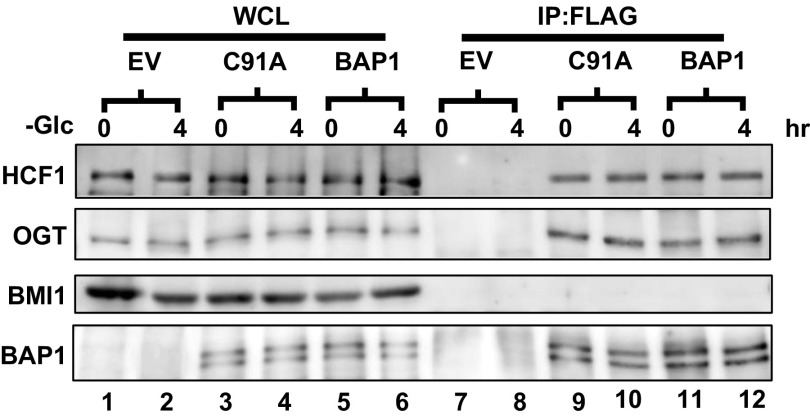
In this study, we show that BAP1 serves to repress the UPR gene regulatory network under glucose starvation, and uncover a prosurvival role of BAP1 in unresolved metabolic stress-induced cell death via BAP1-mediated UPR repression. Our data suggest a model that glucose starvation induces BAP1 binding to the ATF3 or CHOP promoter, either directly or indirectly through other associated proteins, and BAP1 binding to ATF3/CHOP promoters does not require its DUB activity. Once binding on ATF3/CHOP promoters, BAP1 represses ATF3/CHOP expression in a DUB-dependent manner. This model is consistent with our data that BAP1 C91A mutation does not affect BAP1 binding to ATF3/CHOP promoters, but leads to loss-of-function phenotypes in other biological assays. It seems that glucose starvation or tharpsgagin treatment does not affect the global level of H2A-Ub (Fig. 2F and Fig. S15), suggesting that these metabolic stresses do not regulate BAP1 DUB activity toward H2A-Ub. How BAP1 is recruited to ATF3 or CHOP promoter in response to metabolic stress remains less clear. BAP1 forms a complex with several other nuclear proteins involved in transcriptional or chromatin regulation, including HCF1, OGT, FoxK1/2, ASXL1/2, and KDM1b (6). However, it seems that glucose starvation did not significantly affect the interaction between BAP1 and its known associated proteins (Fig. S16). It is possible that glucose starvation-induced posttranslational modifications on BAP1 may play a role in recruiting BAP1 to ATF3 or CHOP promoter, a hypothesis that remains to be tested in the future studies.
Fig. S15.
Western blot analysis of global H2A-Ub level upon tharpsgagin treatment in UMRC6-EV and UMRC6-BAP1 cells. Indicated UMRC6 stable cells treated with 1 μm tharpsigargin for 8 h. The lysates were collected and examined by Western blot using indicated antibodies. Vinculin (VCL) was used as loading control.
Fig. S16.
Coimmunoprecipitation analysis of the association of BAP1 with OGT, HCF1, and BMI1. Cell lysates of UMRC6-BAP1 cells that had been cultured in glucose free medium for 0 or 4 h were subjected to the immunoprecipitation using anti-FLAG (for BAP1) antibody, then examined by Western blot using indicated antibodies.
The exact mechanisms by which BAP1 represses ATF3 and CHOP transcription under glucose starvation through its DUB activity remain less understood. BAP1 forms the Polycomb repressive deubiquitylase (PR-DUB) complex that removes monoubiquitin from H2A at lys 119 (13), whereas the BMI1-containing PRC1 functions as an ubiquitin ligase complex to mediate the monoubiquitination of H2A at lys 119, which was initially proposed to mediate gene repression (16, 17). This model would predict that BAP1, through DUB H2A, antagonizes PRC1-mediated gene repression. However, whether H2A-ubiquitination per se functions as a repression marker is still an open question in the field (18, 19). Indeed, other studies showed that the repression of certain target genes requires not only the PRC1-mediated H2A ubiquitination, but also PR-DUB–mediated H2A DUB, which suggests that, at least in some contexts, an appropriate balance between H2A ubiquitination and DUB, rather than H2A ubiquitination per se, is important for the maintenance of target gene repression (20). Our data showed that glucose starvation promotes the binding of not only BAP1, but also BMI1 and RING1B, two integral and critical components of PRC1, on ATF3/CHOP promoters, and that inactivation of either BAP1 or BMI1 similarly enhances ATF3 or CHOP expression in response to glucose deprivation. Thus, our data are in line with the second model described above, and suggest a hypothesis that glucose starvation may promote the binding of both BMI1 and BAP1 on ATF3/CHOP promoters to ensure a dynamic balance between BMI1/RING1B-containing PRC1-mediated H2A ubiquitination and BAP1-containing PR-DUB–mediated H2A DUB at ATF3/CHOP promoters, and to maintain ATF3/CHOP transcription repression.
Because the somatic and germ-line BAP1 mutations frequently occur in several forms of human cancers, it is of particular importance and interest to study BAP1 function in tumor biology. The prosurvival function of BAP1 revealed from this study may seem counterintuitive with its well-documented role as a tumor suppressor. It is important to note that several other tumor suppressors, such as LKB1, TSC1, and TSC2, also have prosurvival functions, and deficiency of these tumor suppressors renders tumor cells sensitive to metabolic stresses, including the ER stress and glucose starvation-induced energy stress (21–24). As nutrient supplies are generally more limited in tumors than in normal tissues, and tumor cells often encounter enormous metabolic stress (9), it is conceivable that, although BAP1 deficiency promotes tumor initiation, in established tumors BAP1-deficient tumor cells may be hypersensitive to metabolic stress-induced cell death, resulting in limited tumor progression and improved patient survival. Notably, whereas BAP1 is a bona fide tumor suppressor in mesothelioma, its mutation or loss of expression frequently predicts longer patient survival in mesothelioma (7, 8). Our study may also provide a mechanistic rationale for exploring the therapeutic use of drugs targeting metabolism (such as metformin) in BAP1-deficient cancers.
Materials and Methods
SI Materials and Methods for detailed description.
Mice.
All animal manipulations were performed under MD Anderson Institutional Animal Care and Use Committee-approved protocols. The Bap1F allele was generated by flanking the exon 4 of mouse Bap1 gene with two loxP sites. C57BL/6J Bap1F/F mice were crossed with tamoxifen-inducible Cre line Rosa26-CreERT2 to generate Bap1F/F; Rosa26-CreERT2 mice. Tamoxifen treatment in mice to induce target gene deletion was performed as previously described (25–28).
Cell Culture Studies.
Primary MEFs were prepared from embryonic day 13.5 embryos, as previously described (29). The generation of Bap1 WT and KO MEFs from Bap1F/F; Rosa26-CreERT2 MEFs was conducted as previous described (30, 31). Briefly, MEFs (passage 0 or 1) were treated with either vehicle (ethanol) or 200 μM 4-hydroxytamoxifen (4-OHT; Sigma, H7904) for 5 d, resulting in Bap1 WT and KO MEFs. Other parental cell lines used in this study were purchased from American Type Culture Collection. For glucose-starvation experiments, cells were cultured in DMEM with different concentrations of glucose (0 or 25 mM) + 10% (vol/vol) dialyzed FBS, as described in our previous publications (32).
SI Materials and Methods
Mice Studies.
For tamoxifen treatment to induce target gene deletion, tamoxifen (120 μg/g body weight; Sigma, T5648) was injected into 4-wk-old mice intraperitoneally for 5 consecutive days. To inject tunicamycin for triggering the ER stress-induced kidney damage, a single dosage (100 ng/g body weight) of tunicamycin (Sigma) was injected intraperitoneally. Mice were killed at later time points and mouse kidneys were prepared for H&E staining (5 μm). The H&E slides were examined by a pathologist (M.J.Y., MD Anderson Cancer Center). For quantification of kidney damage, the percentage of the vacuolized areas in Bap1-KO mice versus Bap1 WT mice was calculated. Five areas (50 μm × 50 μm) in each H&E-stained mouse kidney sample (n = 3∼6 per genotype per treatment) were randomly chosen and analyzed using ImageJ (33).
Apoptosis Assay, ROS, and ATP Measurement.
To measure apoptosis, cells were stained by FITC Annexin V kit (BD Bioscience) per the manufacturer’s instructions, and then subjected to FACS analysis using BD Accuri C6 flow cytometer (BD Bioscience). To measure oxidative stress, cells were stained with 10 mM CM-H2DCFDA (Invitrogen) for 30 min at 37 °C, then placed in ice-cold PBS and immediately subjected to FACs analysis. To measure ATP level, cells were collected and analyzed by the ATP determination kit (Invitrogen).
Constructs.
shRNAs targeting human BAP1 were obtained from sigma. Human BAP1 cDNA was cloned into retrovirus vector pBabe-Puro with N-terminal FLAG tag. The BAP1-C91A mutant was generated using PCR-based mutagenesis strategy. All constructs containing PCR fragments were confirmed by DNA sequencing. Guide RNA targeting human BAP1 were subcloned into pLenti-Crispr-v2 vector (Addgene). To make stable cell lines, viruses were prepared by cotransfecting target plasmids together with packaging plasmids per the provider’s instruction. Stable cell lines after virus infection were selected with 2 μg/μL of puromycin and maintained with 1 μg/μL of puromycin.
Antibodies.
The following antibodies were used in this study: CHOP, ATF4, XBP1s, BIP, P-EIF2a, EIF2a, cleaved PARP, H2A-Ub, RING1B, OGT, PERK, IRE1a, P-IRE1a, BMI1, (Cell Signaling Technology); Flag M2, vinculin (Sigma); ATF3, BAP1, GAPDH (GeneTex); ATF6 (Abcam), H2A-Ub, BMI1 (Millipore); HCF-1 (Bethl), Alexa Fluor-488 Goat Anti-Mouse IgG, Dynabeads Rat Anti-Mouse IgM (Invitrogen).
Primers.
The following primers and sequences (5′ to 3′, forward/reverse) were used in the studies.
Primers to measure mRNA level by real-time qPCR:
CHOP: CCTTTCTCCTTCGGGACACT /TTGATTCTTCCTCTTCATTTCCAGG;
BIP: CGCTGTGCTCCTGTGCTA/CAACCACCTTGAACGGCAA;
ATF3: CTAACCTGACGCCCTTTGTC/GCTTCTCCGACTCTTTCTGC;
ATF4: TCCAACAACAGCAAGGAGGA/TACCCAACAGGGCATCCAAG;
XBP1s: TGCTGAGTCCGCAGCAGGTG/ GCTGGCAGGCTCTGGGGAAG;
XBP1u: TGCTGAGTCCGCAGCACTCAG/GCTGGCAGGCTCTGGGGAAG.
Primers to measure promoter enrichment by ChIP:
ATF3: GAGGTGCTGGCTACAGAAGG/CGGGAGAAAGCTGAGTGAGG;
ATF4: GCGGCGAAGGAAAGAACG/CTCACGAAAGGAGAGAGGTGT;
CHOP: TGCCACTTTCTGATTGGTAGGTT/TGCCACCCGCTCATCTTT;
HOXA10: TGGCCCATCAATACAGATTACA/CAATCCCGAGCCAGAGTTTC.
Guide RNA sequences for human ATF3 and CHOP (to generate human ATF3 and CHOP CRISPR KO cell lines):
CHOP: TTTGTGATGGACACCCCGAG;
ATF3: TTTGTGATGGACACCCCGAG.
Statistical Analyses and Plotting.
Results consistently observed in at least three independent experiments were plotted as line graph or bar graph with error bars representing mean ± SEM. The unpaired two-tailed Student’s t test function in Excel (Microsoft) was used to calculate P values.
Real-Time qPCR.
Real-time qPCR was performed using QuantiTect SYBR Green PCR kit (Qiagen), and was run on Stratagene MX3000P. For real-time qPCR, total RNA was extracted from cells using RNeasy (Qiagen) and first-strand cDNA was prepared with High Capacity cDNA Reverse Transcription Kit (Applied Biosystems).
ChIP.
ChIP experiments used SimpleChIP Plus Enzymatic Chromatin IP Kit (Magnetic Beads; Cell Signaling Technology) and proceeded per the manufacturer’s instructions. Briefly, cells were cross-linked after 4-h glucose deprivation. After chromatin digestion, antibody against BAP1 (using anti-FLAG), H2A-Ub and BMI1 as well as control antibody were used for ChIP. The enriched promoters were examined by real-time qPCR. The signal relative to input was evaluated using a formula from the manufacture’s protocol as follows: Percent input = 2% × 2(C[T]2% input sample − C[T]IP sample) where C[T] = threshold cycle.
Western Blot.
Minced mice tissues were lysed with RIPA buffer (20 mM Tris pH 7.5, 150 mM NaCl, 1% Nonidet P-40, 0.5% sodium deoxycholate, 1 mM EDTA, 0.1% SDS). Cultured cells were lysed with Nonidet P-40 buffer (150 mM sodium chloride, 1.0% Nonidet P-40, 50 mM Tris, pH 8.0). All lysis buffers contains complete mini protease inhibitors (Roche) and phosphatase inhibitor mixture (Calbiochem). Protein concentrations were determined by Bradford assay (Bio-Rad, 500-0006) and Western blots were performed using 20–40 μg of protein. Protein samples were separated by SDS/PAGE and transferred to a polyvinylidene difluoride membrane using a transfer apparatus according to the manufacturer’s protocols (Bio-Rad). After incubation with 5% (wt/vol) nonfat milk in TBST (10 mM Tris, pH 8.0, 150 mM NaCl, 0.5% Tween 20) for 60 min, the membrane was washed once with TBST and incubated with antibodies. Membranes were washed three times for 10 min and incubated with horseradish peroxidase-conjugated anti-mouse or anti-rabbit antibodies for 2 h. Blots were washed with TBST three times and developed using the ECL system (Thermo Fisher Scientific) on Image Station 4000MM Pro (Kodak) according to the manufacturer’s protocols.
Immunofluorescence.
Cells grown on coverslips were fixed with 4% (vol/vol) formaldehyde for 30 min at 4 °C, and blocked with 5% (wt/vol) milk in PEM buffer [400 mM Potassium Pipes (pH 6.8), 0.8 mM EGTA, 5 mM MgCl2]. Cells were then probed with primary antibodies, followed by Alexa Fluor-488 secondary antibody. Fluorescence images were acquired with Leica DMI 3000 B microscope.
RNA-Seq and Bioinformatic Analysis.
Upon glucose deprivation at 0, 4, and 8 h, cells were collected and total RNA were prepared. Samples were collected in duplicate independently. RNA-Seq was performed in the sequencing core facility at the MD Anderson Cancer Center. The raw reads in FASTQ format were aligned to the reference genome, hg19, using the MOSAIK implemented Smith–Waterman algorithm to perform gapped alignment. The overlaps between aligned reads and annotated genes, genecode.v15, were counted using HTSeq software. The reads mapped to both strands were counted. The gene counts were normalized using the scaling factor method. Under any condition, if the number of overlapped read of any given gene is less than one per million total mapped reads for all samples, this gene was excluded from further analysis. A negative binomial generalized linear model was performed to each gene expression and the Wald test was performed to compare the expression between UMRC6-BAP1 vs. UMRC6-EV cell lines. For pathway analysis, Qiagen’s IPA (https://www.qiagenbioinformatics.com/) were used. For integrated bio-data analysis, dplyr, ggplot2, pathview as well as their dependent tools distributed as packages in open source software project Bioconductor were used (34–37).
Acknowledgments
We thank Peng Huang for helpful discussions; and Donglai Wang and Aifu Lin for the help during the initiation stage of this project. This research has been supported by funding from an institutional research grant from the University of Texas MD Anderson Cancer Center, Cancer Prevention & Research Institute of Texas (RP130020), National Institutes of Health (CA181196, CA190370), and Ellison Medical Foundation Grant AG-NS-0973-13 (to B.G.). Y.Z. is a Scholar from Center for Cancer Epigenetics at the University of Texas MD Anderson Cancer Center.
Footnotes
The authors declare no conflict of interest.
This article is a PNAS Direct Submission.
Data deposition: The data reported in this paper have been deposited in the Gene Expression Omnibus (GEO) database, www.ncbi.nlm.nih.gov/geo (accession no. GSE95097).
This article contains supporting information online at www.pnas.org/lookup/suppl/doi:10.1073/pnas.1619588114/-/DCSupplemental.
References
- 1.Green DR, Galluzzi L, Kroemer G. Metabolic control of cell death. Science. 2014;345(6203):1250256. doi: 10.1126/science.1250256. [DOI] [PMC free article] [PubMed] [Google Scholar]
- 2.Walter P, Ron D. The unfolded protein response: From stress pathway to homeostatic regulation. Science. 2012;334(6059):1081–1086. doi: 10.1126/science.1209038. [DOI] [PubMed] [Google Scholar]
- 3.Hetz C. The unfolded protein response: Controlling cell fate decisions under ER stress and beyond. Nat Rev Mol Cell Biol. 2012;13(2):89–102. doi: 10.1038/nrm3270. [DOI] [PubMed] [Google Scholar]
- 4.Marciniak SJ, et al. CHOP induces death by promoting protein synthesis and oxidation in the stressed endoplasmic reticulum. Genes Dev. 2004;18(24):3066–3077. doi: 10.1101/gad.1250704. [DOI] [PMC free article] [PubMed] [Google Scholar]
- 5.Ron D, Walter P. Signal integration in the endoplasmic reticulum unfolded protein response. Nat Rev Mol Cell Biol. 2007;8(7):519–529. doi: 10.1038/nrm2199. [DOI] [PubMed] [Google Scholar]
- 6.Carbone M, et al. BAP1 and cancer. Nat Rev Cancer. 2013;13(3):153–159. doi: 10.1038/nrc3459. [DOI] [PMC free article] [PubMed] [Google Scholar]
- 7.Arzt L, Quehenberger F, Halbwedl I, Mairinger T, Popper HH. BAP1 protein is a progression factor in malignant pleural mesothelioma. Pathol Oncol Res. 2014;20(1):145–151. doi: 10.1007/s12253-013-9677-2. [DOI] [PubMed] [Google Scholar]
- 8.Baumann F, et al. Mesothelioma patients with germline BAP1 mutations have 7-fold improved long-term survival. Carcinogenesis. 2015;36(1):76–81. doi: 10.1093/carcin/bgu227. [DOI] [PMC free article] [PubMed] [Google Scholar]
- 9.Boroughs LK, DeBerardinis RJ. Metabolic pathways promoting cancer cell survival and growth. Nat Cell Biol. 2015;17(4):351–359. doi: 10.1038/ncb3124. [DOI] [PMC free article] [PubMed] [Google Scholar]
- 10.Peña-Llopis S, et al. BAP1 loss defines a new class of renal cell carcinoma. Nat Genet. 2012;44(7):751–759. doi: 10.1038/ng.2323. [DOI] [PMC free article] [PubMed] [Google Scholar]
- 11.Lee AS. Mammalian stress response: Induction of the glucose-regulated protein family. Curr Opin Cell Biol. 1992;4(2):267–273. doi: 10.1016/0955-0674(92)90042-b. [DOI] [PubMed] [Google Scholar]
- 12.Han J, et al. ER-stress-induced transcriptional regulation increases protein synthesis leading to cell death. Nat Cell Biol. 2013;15(5):481–490. doi: 10.1038/ncb2738. [DOI] [PMC free article] [PubMed] [Google Scholar]
- 13.Scheuermann JC, et al. Histone H2A deubiquitinase activity of the Polycomb repressive complex PR-DUB. Nature. 2010;465(7295):243–247. doi: 10.1038/nature08966. [DOI] [PMC free article] [PubMed] [Google Scholar]
- 14.Vissers JH, Nicassio F, van Lohuizen M, Di Fiore PP, Citterio E. The many faces of ubiquitinated histone H2A: Insights from the DUBs. Cell Div. 2008;3:8. doi: 10.1186/1747-1028-3-8. [DOI] [PMC free article] [PubMed] [Google Scholar]
- 15.Tavares L, et al. RYBP-PRC1 complexes mediate H2A ubiquitylation at polycomb target sites independently of PRC2 and H3K27me3. Cell. 2012;148(4):664–678. doi: 10.1016/j.cell.2011.12.029. [DOI] [PMC free article] [PubMed] [Google Scholar]
- 16.Kallin EM, et al. Genome-wide uH2A localization analysis highlights Bmi1-dependent deposition of the mark at repressed genes. PLoS Genet. 2009;5(6):e1000506. doi: 10.1371/journal.pgen.1000506. [DOI] [PMC free article] [PubMed] [Google Scholar]
- 17.Wang H, et al. Role of histone H2A ubiquitination in Polycomb silencing. Nature. 2004;431(7010):873–878. doi: 10.1038/nature02985. [DOI] [PubMed] [Google Scholar]
- 18.Pengelly AR, Kalb R, Finkl K, Müller J. Transcriptional repression by PRC1 in the absence of H2A monoubiquitylation. Genes Dev. 2015;29(14):1487–1492. doi: 10.1101/gad.265439.115. [DOI] [PMC free article] [PubMed] [Google Scholar]
- 19.Endoh M, et al. Histone H2A mono-ubiquitination is a crucial step to mediate PRC1-dependent repression of developmental genes to maintain ES cell identity. PLoS Genet. 2012;8(7):e1002774. doi: 10.1371/journal.pgen.1002774. [DOI] [PMC free article] [PubMed] [Google Scholar]
- 20.Scheuermann JC, Gutiérrez L, Müller J. Histone H2A monoubiquitination and Polycomb repression: The missing pieces of the puzzle. Fly (Austin) 2012;6(3):162–168. doi: 10.4161/fly.20986. [DOI] [PubMed] [Google Scholar]
- 21.Kang YJ, Lu M-K, Guan K-L. The TSC1 and TSC2 tumor suppressors are required for proper ER stress response and protect cells from ER stress-induced apoptosis. Cell Death Differ. 2011;18(1):133–144. doi: 10.1038/cdd.2010.82. [DOI] [PMC free article] [PubMed] [Google Scholar]
- 22.Inge LJ, et al. LKB1 inactivation sensitizes non-small cell lung cancer to pharmacological aggravation of ER stress. Cancer Lett. 2014;352(2):187–195. doi: 10.1016/j.canlet.2014.06.011. [DOI] [PubMed] [Google Scholar]
- 23.Shaw RJ, et al. The tumor suppressor LKB1 kinase directly activates AMP-activated kinase and regulates apoptosis in response to energy stress. Proc Natl Acad Sci USA. 2004;101(10):3329–3335. doi: 10.1073/pnas.0308061100. [DOI] [PMC free article] [PubMed] [Google Scholar]
- 24.Inoki K, Zhu T, Guan K-L. TSC2 mediates cellular energy response to control cell growth and survival. Cell. 2003;115(5):577–590. doi: 10.1016/s0092-8674(03)00929-2. [DOI] [PubMed] [Google Scholar]
- 25.Gan B, et al. mTORC1-dependent and -independent regulation of stem cell renewal, differentiation, and mobilization. Proc Natl Acad Sci USA. 2008;105(49):19384–19389. doi: 10.1073/pnas.0810584105. [DOI] [PMC free article] [PubMed] [Google Scholar]
- 26.Gan B, et al. Lkb1 regulates quiescence and metabolic homeostasis of haematopoietic stem cells. Nature. 2010;468(7324):701–704. doi: 10.1038/nature09595. [DOI] [PMC free article] [PubMed] [Google Scholar]
- 27.Gan B, et al. FoxOs enforce a progression checkpoint to constrain mTORC1-activated renal tumorigenesis. Cancer Cell. 2010;18(5):472–484. doi: 10.1016/j.ccr.2010.10.019. [DOI] [PMC free article] [PubMed] [Google Scholar]
- 28.Lee H, et al. BAF180 regulates cellular senescence and hematopoietic stem cell homeostasis through p21. Oncotarget. 2016;7(15):19134–19146. doi: 10.18632/oncotarget.8102. [DOI] [PMC free article] [PubMed] [Google Scholar]
- 29.Gan B, et al. Role of FIP200 in cardiac and liver development and its regulation of TNFalpha and TSC-mTOR signaling pathways. J Cell Biol. 2006;175(1):121–133. doi: 10.1083/jcb.200604129. [DOI] [PMC free article] [PubMed] [Google Scholar]
- 30.Lin A, et al. FoxO transcription factors promote AKT Ser473 phosphorylation and renal tumor growth in response to pharmacologic inhibition of the PI3K-AKT pathway. Cancer Res. 2014;74(6):1682–1693. doi: 10.1158/0008-5472.CAN-13-1729. [DOI] [PMC free article] [PubMed] [Google Scholar]
- 31.Lin A, et al. The FoxO-BNIP3 axis exerts a unique regulation of mTORC1 and cell survival under energy stress. Oncogene. 2013;33(February):1–12. doi: 10.1038/onc.2013.273. [DOI] [PMC free article] [PubMed] [Google Scholar]
- 32.Liu X, et al. LncRNA NBR2 engages a metabolic checkpoint by regulating AMPK under energy stress. Nat Cell Biol. 2016;18(4):431–442. doi: 10.1038/ncb3328. [DOI] [PMC free article] [PubMed] [Google Scholar]
- 33.Schneider CA, Rasband WS, Eliceiri KW. NIH Image to ImageJ: 25 years of image analysis. Nat Methods. 2012;9(7):671–675. doi: 10.1038/nmeth.2089. [DOI] [PMC free article] [PubMed] [Google Scholar]
- 34.Luo W, Brouwer C. Pathview: An R/Bioconductor package for pathway-based data integration and visualization. Bioinformatics. 2013;29(14):1830–1831. doi: 10.1093/bioinformatics/btt285. [DOI] [PMC free article] [PubMed] [Google Scholar]
- 35.Wickham H, Francois R. 2016 dplyr: A Grammar of Data Manipulation. R Packag, Version 0.5.0. Available at https://CRAN.R-project.org/package=dplyr. Accessed June 24, 2016.
- 36.Gentleman RC, et al. Bioconductor: Open software development for computational biology and bioinformatics. Genome Biol. 2004;5(10):R80. doi: 10.1186/gb-2004-5-10-r80. [DOI] [PMC free article] [PubMed] [Google Scholar]
- 37.Wickham H. ggplot2: Elegant Graphics for Data Analysis. Springer-Verlag; New York: 2009. [Google Scholar]


