Significance
Protein phosphorylation is a major regulatory mechanism for many cellular functions, but no phosphoprotein in biofluids has been developed for disease diagnosis because of the presence of active phosphatases. This study presents a general strategy to isolate and identify phosphoproteins in extracellular vesicles (EVs) from human plasma as potential markers to differentiate disease from healthy states. We identified close to 10,000 unique phosphopeptides in EVs from small volumes of plasma samples and more than 100 phosphoproteins in plasma EVs that are significantly higher in patients diagnosed with breast cancer as compared with healthy controls. This study demonstrates that the development of phosphoproteins in plasma EVs as disease biomarkers is highly feasible and may transform cancer screening and monitoring.
Keywords: phosphoproteins, proteomics, extracellular vesicles, mass spectrometry, biomarker
Abstract
The state of protein phosphorylation can be a key determinant of cellular physiology such as early-stage cancer, but the development of phosphoproteins in biofluids for disease diagnosis remains elusive. Here we demonstrate a strategy to isolate and identify phosphoproteins in extracellular vesicles (EVs) from human plasma as potential markers to differentiate disease from healthy states. We identified close to 10,000 unique phosphopeptides in EVs isolated from small volumes of plasma samples. Using label-free quantitative phosphoproteomics, we identified 144 phosphoproteins in plasma EVs that are significantly higher in patients diagnosed with breast cancer compared with healthy controls. Several biomarkers were validated in individual patients using paralleled reaction monitoring for targeted quantitation. This study demonstrates that the development of phosphoproteins in plasma EV as disease biomarkers is highly feasible and may transform cancer screening and monitoring.
Early diagnosis and monitoring of diseases such as cancers through blood tests has been a decades-long aim of medical diagnostics. Because protein phosphorylation is one of the most important and widespread molecular regulatory mechanisms that controls almost all aspects of cellular functions (1, 2), the status of phosphorylation events conceivably provides clues regarding disease status (3). However, few phosphoproteins have been developed as disease markers. Assays of phosphoproteins from tissues face tremendous challenges because of the invasive nature of tissue biopsy and the highly dynamic nature of protein phosphorylation during the typically long and complex procedure of tissue biopsy. Furthermore, biopsy tissue from tumors is not available for monitoring patient response over the course of treatment. Development of phosphoproteins as disease biomarkers from biofluids is even more challenging because of the presence of active phosphatases in high concentration in blood. With several highly abundant proteins representing more than 95% of the mass in blood, few phosphorylated proteins in plasma/serum can be identified with stable and detectable concentrations.
The recent discovery of extracellular vesicles (EVs), including microvesicles and exosomes, and their potentially important cellular functions in tumor biology and metastasis has presented them as intriguing sources for biomarker discovery and disease diagnosis (4–6). Critical for immune regulation and intercellular communication, EVs have many differentiating characteristics of cancer cell-derived cargo, including mutations, active miRNAs, and signaling molecules with metastatic features (7, 8). The growing body of functional studies has provided strong evidence that these EV-based disease markers can be identified well before the onset of symptoms or physiological detection of a tumor, making them a promising candidate for early-stage cancer and other diseases (6, 9). Interestingly, EVs are membrane-encapsulated nano- or microparticles, which protects their inside contents from external proteases and other enzymes (10–12). These features make them highly stable in a biofluid for extended periods of time and also allow us to potentially develop phosphoproteins in EVs for medical diagnoses. The ability to detect the genome output (active proteins, and in particular phosphoproteins) can provide more direct real-time information about the organism’s physiological functions and disease progression, particularly in cancers.
We aimed to develop EV phosphoproteins as potential disease markers by focusing on breast cancer in this study. With tremendous challenges facing mass spectrometry-based biomarker discovery using biofluids, identification of EV phosphoproteins presents a totally different path to disease diagnosis. To this end, we isolated and identified the largest group of EV phosphoproteins to date from both microvesicles and exosomes and measured phosphorylation changes across patients with breast cancer and healthy individuals. We subsequently identified multiple potential candidates and verified several among patients and healthy controls. The EV phosphoproteomics approach demonstrated here can be applied to other systems, and thus establish a strategy for biomarker discovery.
Results
Identification of 9,643 Unique Phosphopeptides from Plasma Microvesicles and Exosomes.
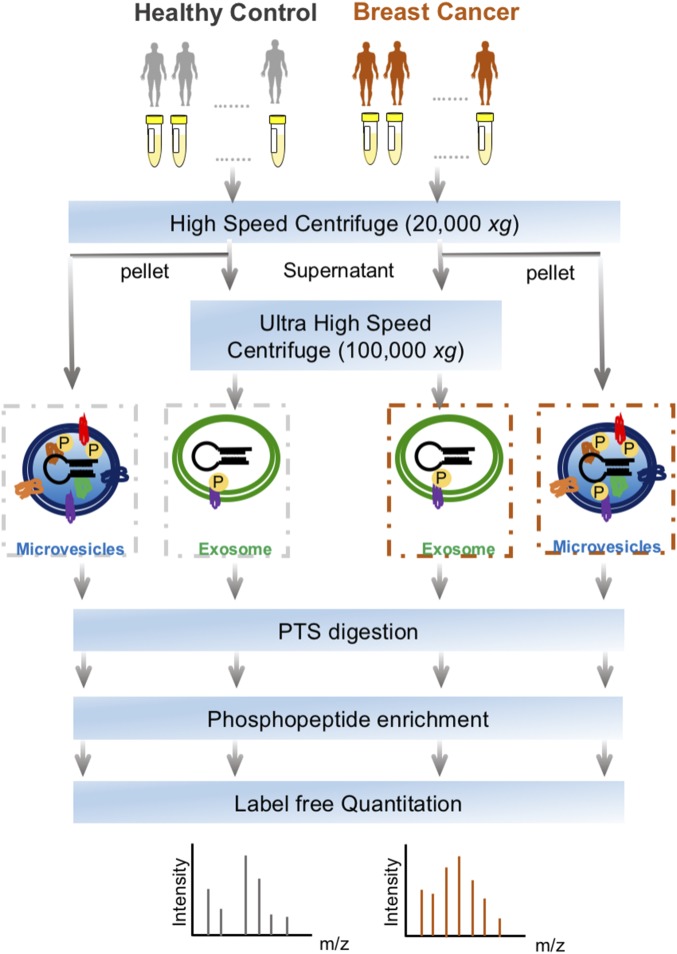
The workflow for the isolation of EVs, enrichment of phosphopeptides, and EV phosphoproteome analyses is illustrated in Fig. 1. Microvesicles and exosomes were isolated from human plasma samples through high-speed and ultra-high-speed centrifugations, respectively, an approach that has been used in previous studies (13–15). For the initial screening, the plasma samples were collected and pooled from healthy individuals (n = 6) and from patients diagnosed with breast cancer (n = 18). After lysis of EVs, proteins were extracted and peptides generated using trypsin with the aid of phase-transfer surfactants for better digestion efficiency and fewer missed tryptic sites (16). Phosphopeptides were enriched and analyzed by liquid chromatography-tandem mass spectrometry (LC-MS/MS) on a high-speed, high-resolution mass spectrometer. For each phosphopeptide sample, three technical replicates were performed. Label-free quantification was performed to determine differential phosphorylation of EV proteins in the plasma of control and breast cancer patient samples.
Fig. 1.
The workflow for EVs phosphoproteomics of plasma samples from patients with breast cancer and healthy controls. EVs including microvesicles and exosomes were isolated through sequential high-speed centrifugation, followed by protein extraction, phase transfer surfactant digestion, and phosphopeptide enrichment for LC-MS analyses.
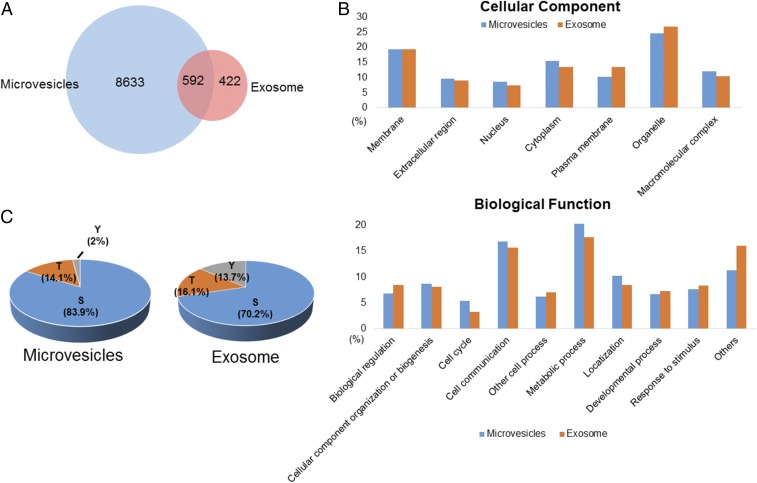
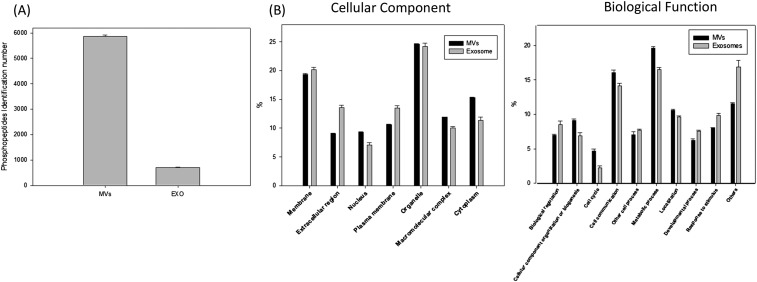
The strategy allowed us to identify 9,643 unique phosphopeptides, including 9,225 from microvesicles and 1,014 from exosomes, representing 1,934 and 479 phosphoproteins in microvesicles and exosomes, respectively. On average, close to 7,000 unique EV phosphopeptides were identified from 1 mL human plasma. As shown in Fig. 2A and Fig. S1A, more than 50% of exosome phosphopeptides were also identified in microvesicles. Gene ontology analysis of the phosphoproteins indicated overall similar cellular components and biological functions between microvesicles and exosomes (Fig. 2B and Fig. S1B). Although previous large-scale phosphoproteomics studies revealed that phosphorylation preferentially targets nuclear proteins (17, 18), a significant portion of the EV phosphoproteomes are distinctively from membranes and organelles. As expected, proteins annotated as extracellular were significantly overrepresented in the EV phosphoproteomes. We also found that many EV phosphoproteins are involved in cell–cell communication, stimulus response, and biogenesis.
Fig. 2.
(A) The Venn diagram showing the number of unique phosphopeptides identified in microvesicles and exosomes. (B) Classification of the identified phosphoproteins based on cellular component and biological function. (C) The distribution of serine/threonine/tyrosine (S/T/Y) phosphopeptides in microvesicles and exosomes.
Fig. S1.
(A) The bar chart showing the number of unique phosphopeptides identified in microvesicles and exosomes. The values indicated the mean identification numbers of technical replicates, the error bar shows the SD between replicates. (B) Classification of the identified phosphoproteins based on cellular component and biological function. The values indicated the mean of technical replicates; the error bar shows the SD between replicates.
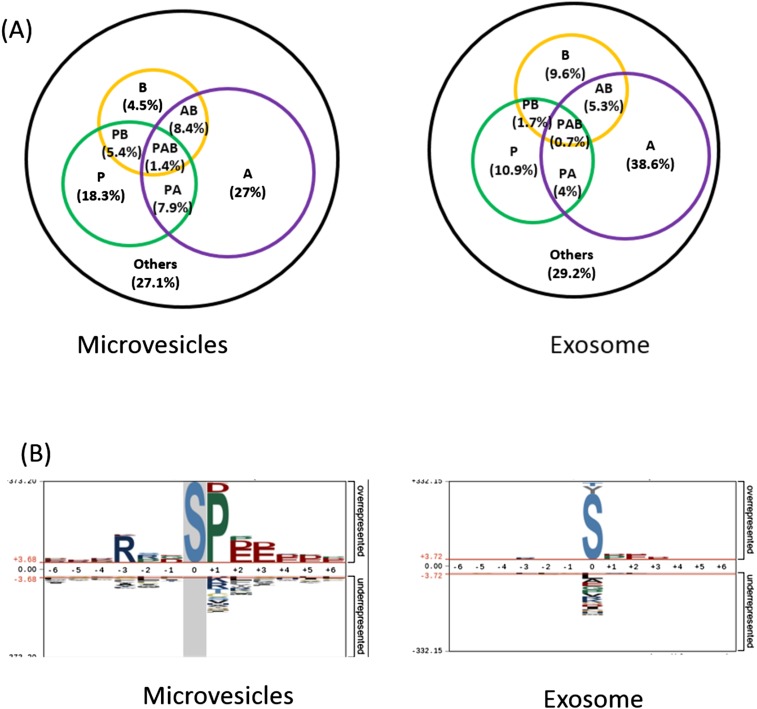
The EV phosphoproteome analyses revealed that the distribution of tyrosine, threonine, and serine phosphorylation (pY, pT and pS) sites is 2.0%, 14.1%, and 83.9%, respectively, for microvesicle phosphoproteins, which is similar to previously reported site distribution in in vivo human phosphoproteomes (19). Interestingly, the distribution of pY in exosomes is an order of magnitude higher, at 13.7%, which is quite close to the distribution of pT, at 16.1% (Fig. 2C). This apparent discrepancy may reflect the different origins of microvesicles and exosomes. Microvesicles bud directly from the plasma membrane, whereas exosomes are represented by endosome-associated proteins, in which proteins such as integrins, hormone receptors, growth factor receptors, receptor tyrosine kinases, and nonreceptor tyrosine kinases such as Src kinases are involved. A further motif analysis of pS/T phosphorylation sites revealed overall similar distribution of general motif to cellular phosphoproteome; for example, the most abundant class of sites is acidophilic, followed by proline-directed and basophilic (Fig. S2A). However, in the exosome phosphoproteome, proline-directed phosphorylation constitutes only half of that in microvesicles, and therefore the motif assay does not show dominant –SP- motif in the exosome phosphoproteome (Fig. S2B).
Fig. S2.
(A) Classification of phosphosites based on kinase specificities (P, proline-directed; A, acidophilic; B, basophilic; others). (B) The summary of motifs were extracted from the sequence windows of identified probability >0.75 phosphorylation sites by pLogo.
Cancer-Specific Phosphoproteins in EV.
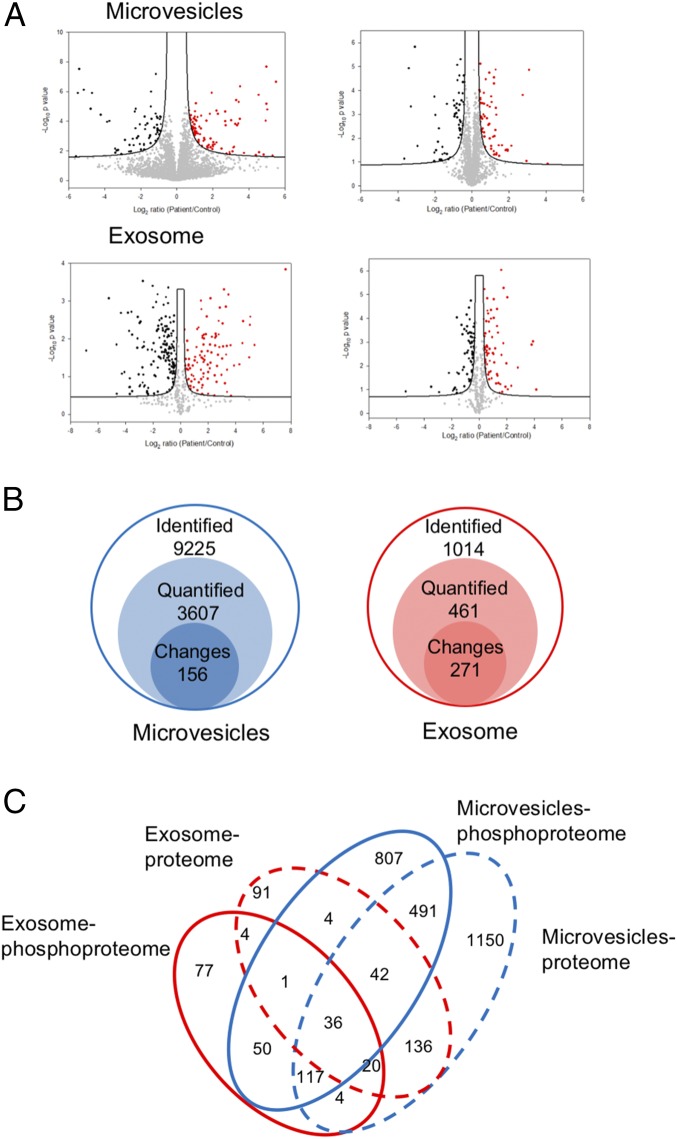
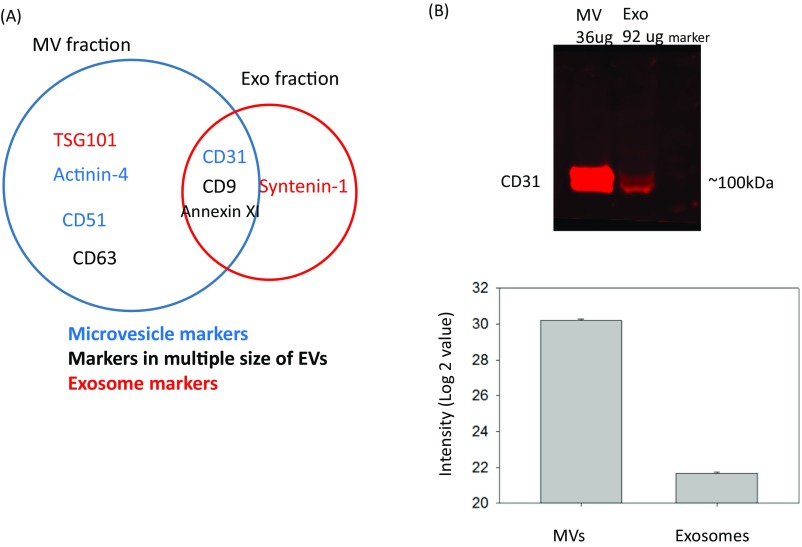
Label-free quantitation of phosphopeptides with the probability score of phosphorylation site location over 0.75 was used to identify differential phosphorylation events in patients with breast cancer from those in healthy individuals. We quantified 3,607 and 461 unique phosphosites and identified 156 and 271 phosphosites with significant changes [false discovery rate (FDR) < 0.05 and S0 = 0.2] in microvesicles and exosomes, respectively (Fig. 3 A and B). Differential phosphorylation may be a result of changes in protein expression or changes of a particular site’s phosphorylation. To distinguish these factors, we also performed label-free quantitation of total proteomes for both microvesicles and exosomes. We identified 1,996 proteins, 34.4% of which were also identified with phosphopeptide enrichment. In comparison, 862 proteins were detected in the phosphorylation data alone, indicating that phosphoproteins are typically of low abundance, escaping detection via the shotgun proteomics approach. Quantitative analyses of EV proteomes revealed strikingly similar expression of most proteins in healthy individuals and patients with cancer (Fig. 3A). In comparison, there are a larger number of phosphorylation sites with significant changes in patient samples, indicating that these phosphorylation differences between patients with cancer and healthy individuals are not a result of changes in protein expression, and thus reflect phosphorylation truly specific to patients with cancer. The result also justifies our approach to developing protein phosphorylation changes, instead of protein expression changes, as the measurement of disease progression. EV proteomic analyses also revealed that several protein markers were only identified in microvesicles or exosomes specifically, but at the same time, there are some protein markers identified in both particles (Fig. S3). Western blotting was carried out with the antibody against CD 31, which is considered an endothelial-derived microvesicles marker. Although CD 31 was mainly identified in microvesicles, the Western blotting (WB) experiment and MS data indicated that the current isolation method based on ultracentrifugation is not entirely specific.
Fig. 3.
(A) The volcano plots representing the quantitative analyses of the phosphoproteomes (Left) and proteomes (Right) of microvesicles and exosomes in patients with breast cancer vs. in healthy controls. Significant changes in proteins and phosphosites in breast cancer that were identified through a permutation-based FDR t test (FDR = 0.05; S0 = 0.2), based on three technical replicates. The significant up-regulated proteins and phosphosites are colored in red, and down-regulated are colored in black. (B) The numbers of identified phosphopeptides (class 1), quantified phosphosites (class 2), and significantly changed phosphosites (class 3) in label-free quantification. See supplementary figures and Dataset S1 for more detailed information. (C) The Venn diagram showing the protein overlap between phosphoproteomes and proteomes in microvesicles and exosome.
Fig. S3.
(A) The Venn diagram showing the common EVs markers present in MVs and exosome fractions through proteomic analyses. (B) Western blotting (WB) and MS data showing the purity of EV isolation. Two EV fractions were collected and analyzed by WB using antibody against CD 31, which is considered an endothelial-derived microvesicles marker. A total of 36 μg protein was used in MV fraction, and considering exosomes may possibly contain some plasma proteins, around 2.5-fold of protein amount of exosome fraction was used. MS data were extracted from two EV fractions, and the bar chart showed the intensity mean value with error bar of control and patient replicates.
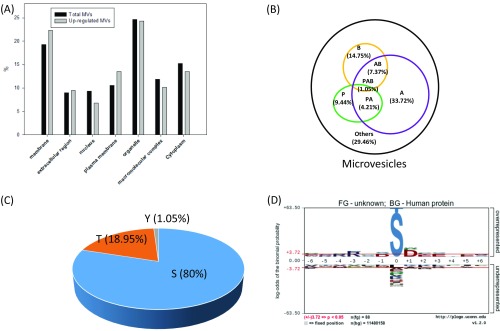
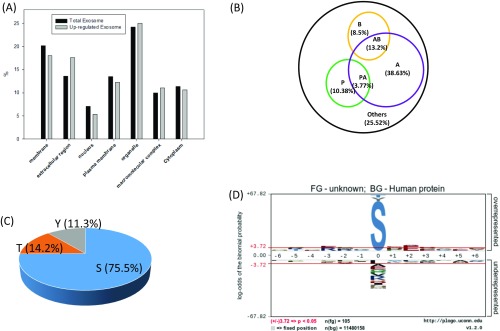
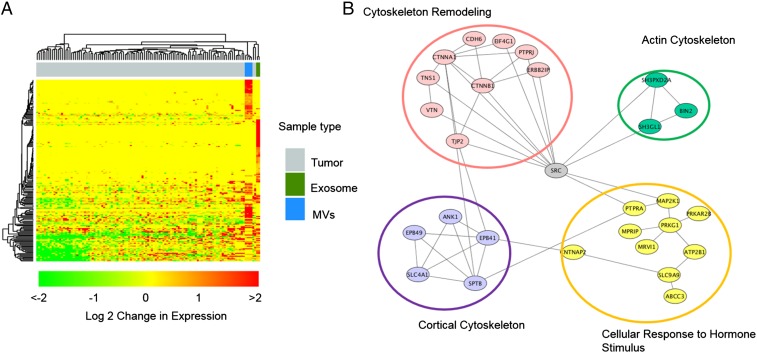
We compared these phosphosites representing 197 unique phosphopeptides that showed significant increase in patients with breast cancer with all identified unique phosphopeptides in EV phosphoproteomes (Figs. S4 and S5). Again, the disparity of relative abundance of pY/pT/pS and sequence motif in microvesicle and exosomes may be a result of their different origins. Although phosphopeptides that showed a significant decrease in patients with breast cancer might be interesting, it is conceivable that these phosphopeptides were not necessarily down-regulated in EV pools, as EVs from other cell sources could compensate them. Therefore, we focused our attention on these 197 unique phosphopeptides. Motif analyses of the corresponding phosphosites found that proline-directed motif (s/tP) decreased significantly, whereas the AB motif increased. In terms of cellular components, the up-regulated phosphoproteins showed a slightly increased share of membrane proteins in MV, whereas there is increase in extracellular proteins in exosome. We further compared the 197 unique phosphopeptides with a recent comprehensive proteogenomic study in which breast phosphoproteomics studies were carried out in tissues from 105 patients with breast cancer (20). We found that a significant portion of these 197 phosphopeptides (>60%) were also identified by the proteogenomic study (Fig. 4A), indicating that EV phosphoproteome is sensitive and that quantitative analyses of EV phosphoproteomics can identify phosphorylation events that are disease specific. However, because EVs can be released from diverse types of cells, the difference could be the result of distinctive immune response or other factors in healthy individuals and patients with cancer. Nevertheless, the results highlight the advantage of analyzing EV phosphoproteome through liquid biopsy over tissue biopsy, which is invasive and subject to variation because of the long procedure.
Fig. S4.
(A) Comparison of cellular components of MV phosphopeptides that showed an increase in patients with cancer, with those of total phosphopeptides identified in MV. (B–D) Motif and the distribution of S/T/Y phosphopeptides that showed increase in patients with cancer in microvesicles.
Fig. S5.
(A) Comparison of cellular components of exosome phosphopeptides that showed increase in patients with cancer with those of total phosphopeptides identified in exosome. (B–D) Motif and the distribution of S/T/Y phosphopeptides that showed increase in patients with cancer in exosomes.
Fig. 4.
(A) The hierarchical clustering analysis of up-regulated phosphopeptides conveys the overlap between EVs in this study and breast cancer tissues by Mertins et al. (20). The top bars show the clustering of different samples, and gray represents the tumor samples analyzed by Mertins et al., whereas blue bars are replicates of MV analysis and cobalt green are exosome analyses in this study. The fold change is shown in log 2 value. (B) The STRING network analysis of up-regulated phosphoproteins in EVs.
To better understand the biological roles of differential phosphorylation events, we examined phosphoproteins specific to patients with cancer, using STRING to identify enriched gene ontology categories and signaling networks (21). We found that several crucial functions related to cancer metastasis, membrane reorganization, and intercellular communication were enriched in cancer-specific EV phosphoproteins (Fig. 4B). It is interesting to reveal the central role of SRC tyrosine kinase with multiple phosphoproteins identified in the study, which is consistent with previous studies linking an elevated level of activity of SRC to cancer progression by promoting other signals. Please note that although 16% of phosphoproteins that were up-regulated in patients with cancer are membrane proteins, and because of relative lack of protein–protein interaction data with membrane proteins, these membrane proteins were not implicated in the STRING analysis.
Verification of Phosphorylation Specific to Patients with Cancer, Using Parallel Reaction Monitoring.
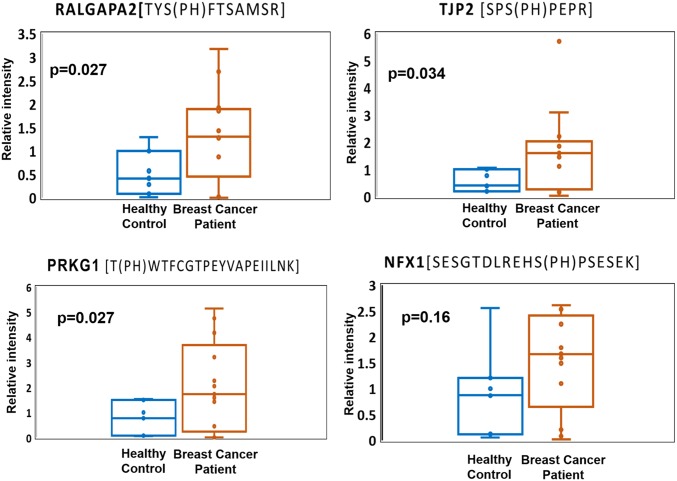
Because breast cancer is extremely heterogeneous, the chance to identify a single diagnostic biomarker is likely rare. Instead, the identification of a panel of candidate markers that reflect the onset and progression of key disease-related signaling events would be feasible to offer better prognostic value. In an effort to validate the differential phosphorylation of potential markers in patients with cancer, we applied parallel reaction monitoring (PRM) (22) to quantify individual EV phosphopeptides in plasma from patients with breast cancer and healthy individuals. Because phosphospecific antibodies suitable for construction of ELISA are rarely available, targeted, quantitative MS approaches such as PRM and MRM (multireaction monitoring) are essential for initial validation. As a demonstration that PRM can be used to initially verify candidate phosphoproteins, we selected four phosphoproteins: Ral GTPase-activating protein subunit alpha-2 (RALGAPA2), cGMP-dependent protein kinase1 (PKG1), tight junction protein 2 (TJP2), and nuclear transcription factor, X box-binding protein 1 (NFX1). These four proteins showed significant phosphorylation up-regulation in patients with cancer, were previously reported as phosphoproteins, and have been implicated in multiple breast cancer studies (23–26).
Quantitative assays based on PRM were performed with plasma EV samples from 13 patients with cancer (eight additional patient samples) and seven healthy controls (one additional control). The relative abundance data of phosphopeptides from four individual proteins are presented as a linear box-and-whiskers plot (Fig. 5). With reference from the figure, RALGAPA2, PKG1, and TJP2 were observed to be significantly elevated in patients with breast cancer compared with in control patients. However, the fold difference is noticeably smaller in PRM than label-free quantification. In particular, NFX1 phosphorylation was only identified in breast cancer samples, and not in healthy controls, but because of large variation among individual samples, the difference of NFX1 phosphorylation on the specific site is statistically inconclusive. The data may be the reflection of dynamic suppression of targeted proteomics such as MRM and PRM. Nevertheless, large variation among clinical samples underscores current challenges facing biomarker validation.
Fig. 5.
Four potential markers were validated in 13 patients with breast cancer and seven healthy individuals, using PRM. Three potential markers, RALGAPA2, PRKG1, and TJP2, show significant difference (P < 0.05) in patients with breast cancer compared with healthy controls.
Discussion
MS-based proteomic profiling and quantitation holds enormous promise for uncovering biomarkers. However, successful applications to human diseases remain limited. This is, in large part, a result of the complexity of biofluids that have an extremely wide dynamic range and are typically dominated by a few highly abundant proteins. This prevents the development of a coherent, practical pipeline for systemic screening and validation. Here, we reported in-depth analyses of phosphoproteomes in plasma EVs and demonstrated the feasibility of developing phosphoproteins as potential disease biomarkers. Previous studies typically could only identify a small number of phosphoproteins in plasma, likely as a result of the presence of phosphatases in the bloodstream, and the level of phosphorylation does not have any clear meaningful connection to biological status (27, 28). We presented an MS-based strategy that includes the isolation of EV particles from human blood, enrichment of EV phosphopeptides, LC-MS/MS analyses, and PRM quantification for biomarker discovery and quantitative verification. We analyzed samples from patients with breast cancer, in comparison with healthy controls, to identify candidate breast cancer biomarkers. These candidates will need to be further evaluated in larger, heterogeneous patient cohorts of defined breast cancer subtypes in the future. The study highlights our ability to isolate and identify thousands of phosphopeptides from limited volumes of biobanked human plasma samples. These findings provide a proof of principle for this strategy to be used to explore existing resources for a wide range of diseases.
Recently, liquid biopsies (analysis of biofluids such as plasma and urine) have gained much attention for cancer research and clinical care, as they offer multiple advantages in clinical settings, including their noninvasive nature, a suitable sample source for longitudinal disease monitoring, better screenshot of tumor heterogeneity, and so on. Current liquid biopsies primarily focus on the detection and downstream analysis of circulating tumor cells and circulating tumor DNA. A major obstacle with the current methods is the heterogeneity and extreme rarity of the circulating tumor cells and circulating DNA. EVs offer all the same attractive advantages of a liquid biopsy, but without the sampling limitation of circulating tumor cells and circulating tumor DNA. At present, most of the studies on EVs focus on microRNAs and a small portion on EV proteins. The ability to detect the genome output, and in particular functional proteins such as phosphoproteins, can arguably provide more useful real-time information about the organism’s physiological functions and disease progression, such as in the early detection and monitoring of cancers.
Our study clearly indicates that EV phosphoproteomes can be readily captured and analyzed. It is interesting to know that EV phosphoproteins are stable over a long period of storage time (the plasma samples from Indiana Biobank were collected more than 5 y ago), which is critical for applications in clinical tests. However, a thorough investigation on EV phophoproteome stability might be necessary, as cellular phosphorylation events are extremely dynamic and EVs are circulating in the blood for long periods of time. EV phosphoproteomes may mainly represent phosphorylation events that are constitutively active, and therefore insensitive to capturing acute events. All these questions can be addressed with further studies on well-defined EV samples, possibly using animal models.
Last, although we present here a feasible strategy to develop phosphoproteins as potential disease markers, it relies on the isolation of a good quantity of EVs with high reproducibility. At this stage, the isolation of microvesicles and exosomes is primarily based on differential high-speed centrifugation, which is not highly specific and is unlikely suitable for clinical settings. Immunoprecipitation of microvesicles and exosomes may introduce bias and contaminations from plasma proteins. The development of phosphoproteins as biomarkers is also severely limited by the availability of phosphospecific antibodies. The inability to develop ELISA or similar immunobased assays will inevitably depend on alternative validation methods such as MS-based targeted quantitation and nonantibody-based methods (29, 30). The complexity of biofluids and the necessity of including EV isolation and phosphopeptide isolation in a sample preparation will no doubt add extra challenges to the accuracy of MS-based targeted quantitation of heterogeneous clinical samples.
Materials and Methods
Plasma samples were collected under approval from Purdue University Human Research Protection Program and Indiana University Human Subjects Office Institutional Review Boards, and all patients were properly consented before samples were collected. Details on EV isolation, protein extraction, phosphopeptide enrichment, mass spectrometric data acquisition and data analysis, and PRM quantitation are provided in SI Materials and Methods. All the identified phosphopeptides are listed in supplementary tables, and all of the mass spectrometric data have been deposited to the PRIDE partner repository with the dataset identifier PXD005214 (31).
SI Materials and Methods
Plasma Samples.
Plasma samples from control and breast cancer patients were obtained through the Komen Tissue Bank (komentissuebank.iu.edu/) and the Tissue Procurement and Distribution Facility at the Indiana University Simon Cancer Center (www.cancer.iu.edu/research-trials/facilities/tissue/index.shtml). The samples stored in these facilities are made available to researchers under IRB exemption status at Indiana and Purdue University for research purposes. Blood samples were collected from six healthy females and from 30 patients with the standard protocol. In brief, plasma sample processing was initiated within 30 min of blood draw to an evacuated blood collection tube with EDTA. Samples were spun for 30 min at 4,000 × g to remove all cell debris and platelets and then stored at −80 °C.
Extracellular Vesicle Isolation.
A total 5.5 mL of pooled plasma samples were collected from both healthy controls and patients with breast cancer for technical replicates on EV phosphoproteomics. Plasma samples were centrifuged at 20,000 × g at 4 °C for 1 h. Pellets were washed with cold PBS and centrifuged again at 20,000 × g at 4 °C for 1 h; the pellets were collected as microvesicles. Supernatants after the first centrifugation were further centrifuged at ultra-high speed 100,000 × g at 4 °C for 1 h. Pellets were washed with cold PBS and centrifuged at 100,000 × g for 1 h again. The pellets collected from the ultra-high-speed centrifugation were exosome particles.
Protein Digestion.
The digestion was performed with a phase transfer surfactant aids procedure (35). EVs were solubilized in lysis buffer containing 12 mM sodium deoxycholate, 12 mM sodium lauroyl sarcosinate, and phosphatase inhibitor mixture (Sigma-Aldrich) in 100 mM Tris⋅HCl at pH 8.5. Proteins were reduced and alkylated with 10 mM Tris-(2-carboxyethyl)phosphine and 40 mM chloroacetamide at 95 °C for 5 min. Alkylated proteins were diluted to fivefold with 50 mM triethylammonium bicarbonate and digested with Lys-C (Wako) in a 1:100 (wt/wt) enzyme-to-protein ratio for 3 h at 37 °C. Trypsin was added to a final 1:50 (wt/wt) enzyme-to-protein ratio for overnight digestion. The digested peptides were acidified with trifluoroacetic acid to a final concentration of 0.5% trifluoroacetic acid, and 250 μL ethyl acetate was added to 250 μL digested solution. The mixture was shaken for 2 min and then centrifuged at 20,000 × g for 2 min to obtain aqueous and organic phases. The aqueous phase was collected and desalted, using 100 mg Sep-pak C18 column (Waters).
Phosphopeptide Enrichment.
The phosphopeptide enrichment was performed according to the reported protocol, with some modifications (36). The in-house-constructed immobilized metal ion affinity chromatography (IMAC) tip was made by capping the end with a 20 μm polypropylene frits disk (Agilent). The tip was packed with 5 mg Ni-NTA silica resin by centrifugation. Before sample loading, Ni2+ ions were removed by 100 mM EDTA solution. Furthermore, the beads were chelating with Fe3+ and equilibrated with loading buffer [6% (vol/vol) acetic acid (AA) at pH 2.7]. Tryptic peptides were reconstituted in loading buffer and loaded onto the IMAC tip. After successive washes with 4% (vol/vol) acetic acid, 25% (vol/vol) acetonitrile, and 6% (vol/vol) acetic acid, the bound phosphopeptides were eluted with 200 mM NH4H2PO4. The eluted phosphopeptides were desalted using C-18 StageTips (37).
LC-MS/MS Analysis.
Phosphopeptides were dissolved in 4 µL of 0.3% formic acid with 3% (vol/vol) acetonitrile and injected into an Easy-nLC 1000 (Thermo Fisher Scientific). Peptides were separated on a 45-cm in-house packed column [360 µm OD × 75 µm inner diameter (ID)] containing C18 resin (2.2 µm, 100 Å; Michrom Bioresources), with a 30-cm column heater (Analytical Sales and Services), and the temperature was set at 50 °C. The mobile phase buffer consisted of 0.1% formic acid in ultrapure water (buffer A) with an eluting buffer of 0.1% formic acid in 80% (vol/vol) acetonitrile (buffer B) run with a linear 45- or 60-min gradient of 6–30% buffer B at flow rate of 250 nL/min. The Easy-nLC 1000 was coupled online with a hybrid high-resolution LTQ-Orbitrap Velos Pro mass spectrometer (Thermo Fisher Scientific). The mass spectrometer was operated in the data-dependent mode, in which a full-scan MS (from m/z 350 to 1,500 with the resolution of 30,000 at m/z 400), followed by MS/MS on the 10 most intense ions [normalized collision energy, 30%; automatic gain control (AGC) 3E4, maximum injection time, 100 ms].
Data Processing.
The raw files were searched directly against UniprotKB database version Jan2015 with no redundant entries, using MaxQuant software (version 1.5.4.1) (38) with Andromeda search engine. Initial precursor mass tolerance was set at 20 ppm, the final tolerance was set at 6 ppm, and ion trap mass spectrometry (ITMS) MS/MS tolerance was set at 0.6 Da. Search criteria included a static carbamidomethylation of cysteines (+57.0214 Da), and variable modifications of oxidation (+15.9949 Da) on methionine residues, acetylation (+42.011 Da) at N terminus of protein, and phosphorylation (+79.996 Da) on serine, threonine, or tyrosine residues were searched. Search was performed with trypsin/P digestion and allowed a maximum of two missed cleavages on the peptides analyzed from the sequence database. The false-discovery rates of proteins, peptides, and phosphosites were set at 0.01. The minimum peptide length was six amino acids, and a minimum Andromeda score was set at 40 for modified peptides. A site localization probability of 0.75 was used as the cutoff for localization of phosphorylation sites. All the peptide spectral matches and MS/MS spectra can be viewed through MaxQuant viewer. All the localized phosphorylation sites and corresponding phosphoproteins were submitted to pLogo software (39) and Panther (40) to determine the phosphorylation motifs and gene ontology, respectively.
Parallel Reaction Monitoring.
Peptide samples were dissolved in 8 μL 0.1% formic acid and injected 6 μL into an easy-nLC 1200 (Thermo Fisher) HPLC system. Eluent was introduced into the mass spectrometer, using 10 cm PicoChip columns filled with 3 μM Reprosil-PUR C18 (New Objective) operated at 2.6 kV. The mobile phase buffer consists of 0.1% formic acid in water with an eluting buffer of 0.1% formic acid (buffer A) in 90% CH3CN (buffer B). The LC flow rate was 300 nL/min. The gradient was set as 0–30% buffer B for 30 min and 30–80% for 10 min. The sample was acquired on QExactive HF (Thermo Fisher). Each sample was analyzed under PRM with an isolation width of ±0.7 Th. In all experiments, a full mass spectrum at 60,000 resolution relative to m/z 200 (AGC target 3E6, 100 ms maximum injection time, m/z 400–1,600) was followed by up to 20 PRM scans at 15,000 resolution (AGC target 1E5, 50 ms maximum injection time), as triggered by a unscheduled inclusion list. Higher-energy collisional dissociation was used with 30 eV normalized collision energy. PRM data were manually curated within Skyline (version 3.5.0.9319) (41).
Quantitative Data Analysis.
All data were analyzed using the Perseus software (version 1.5.4.1) (32). For the quantification of both proteomic and phosphoproteomic data, the intensities of peptides and phosphopeptides were extracted by MaxQuant, and the missing values of intensities were replaced by normal distribution with a downshift of 1.8 SDs and a width of 0.3 SDs. The significantly increased phosphosites or proteins in patient samples were identified by the P value, which is significant based on a two-sample t test with a permutation-based FDR cutoff 0.05 with S0 set on 0.2 for all of data sets. The up-regulated candidate networks were predicted in STRING version 10.0 (21) with the interaction score ≥0.4, and the signal networks were visualized using Cytoscape version 3.4.0 (33) with MCODE plugin version 1.4.2 (34). All of the mass spectrometric data have been deposited to the PRIDE partner repository (www.ebi.ac.uk/pride) with the dataset identifier PXD005214 (31).
Supplementary Material
Acknowledgments
We thank the IU Simon Cancer Center at Indiana University School of Medicine for the use of the Tissue Procurement & Distribution Core, which provided us with the patient plasma samples. Samples from the Susan G. Komen Tissue Bank at the IU Simon Cancer Center were also used in this study. We thank contributors, including Indiana University who collected samples used in this study, as well as donors and their families, whose help and participation made this work possible. This study was supported partially by NIH Grants 5R41GM109626, 1R01GM111788, and 1R41CA210772 and by National Science Foundation Grant 1506752. Additional support was provided by the Purdue University Center for Cancer Research (NIH Grant P30 CA023168).
Footnotes
A.B.I. and W.A.T. are cofounders of Tymora Analytical Operations.
Data deposition: The mass spectrometric data have been deposited in the PRIDE partner repository, www.ebi.ac.uk/pride (accession no. PXD005214).
This article contains supporting information online at www.pnas.org/lookup/suppl/doi:10.1073/pnas.1618088114/-/DCSupplemental.
References
- 1.Hunter T. Signaling--2000 and beyond. Cell. 2000;100(1):113–127. doi: 10.1016/s0092-8674(00)81688-8. [DOI] [PubMed] [Google Scholar]
- 2.Kabuyama Y, Resing KA, Ahn NG. Applying proteomics to signaling networks. Curr Opin Genet Dev. 2004;14(5):492–498. doi: 10.1016/j.gde.2004.07.001. [DOI] [PubMed] [Google Scholar]
- 3.Iliuk AB, Arrington JV, Tao WA. Analytical challenges translating mass spectrometry-based phosphoproteomics from discovery to clinical applications. Electrophoresis. 2014;35(24):3430–3440. doi: 10.1002/elps.201400153. [DOI] [PMC free article] [PubMed] [Google Scholar]
- 4.Melo SA, et al. Glypican-1 identifies cancer exosomes and detects early pancreatic cancer. Nature. 2015;523(7559):177–182. doi: 10.1038/nature14581. [DOI] [PMC free article] [PubMed] [Google Scholar]
- 5.Gonzales PA, et al. Large-scale proteomics and phosphoproteomics of urinary exosomes. J Am Soc Nephrol. 2009;20(2):363–379. doi: 10.1681/ASN.2008040406. [DOI] [PMC free article] [PubMed] [Google Scholar]
- 6.Boukouris S, Mathivanan S. Exosomes in bodily fluids are a highly stable resource of disease biomarkers. Proteomics Clin Appl. 2015;9(3-4):358–367. doi: 10.1002/prca.201400114. [DOI] [PMC free article] [PubMed] [Google Scholar]
- 7.Zhang Y, Wang XF. A niche role for cancer exosomes in metastasis. Nat Cell Biol. 2015;17(6):709–711. doi: 10.1038/ncb3181. [DOI] [PubMed] [Google Scholar]
- 8.Costa-Silva B, et al. Pancreatic cancer exosomes initiate pre-metastatic niche formation in the liver. Nat Cell Biol. 2015;17(6):816–826. doi: 10.1038/ncb3169. [DOI] [PMC free article] [PubMed] [Google Scholar]
- 9.Saraswat M, et al. N-linked (N-) glycoproteomics of urinary exosomes. [Corrected] Mol Cell Proteomics. 2015;14(2):263–276. doi: 10.1074/mcp.M114.040345. [DOI] [PMC free article] [PubMed] [Google Scholar]
- 10.Sokolova V, et al. Characterisation of exosomes derived from human cells by nanoparticle tracking analysis and scanning electron microscopy. Colloids Surf B Biointerfaces. 2011;87(1):146–150. doi: 10.1016/j.colsurfb.2011.05.013. [DOI] [PubMed] [Google Scholar]
- 11.Palmisano G, et al. Characterization of membrane-shed microvesicles from cytokine-stimulated β-cells using proteomics strategies. Mol Cell Proteomics. 2012;11(8):230–243. doi: 10.1074/mcp.M111.012732. [DOI] [PMC free article] [PubMed] [Google Scholar]
- 12.Cocucci E, Meldolesi J. Ectosomes and exosomes: Shedding the confusion between extracellular vesicles. Trends Cell Biol. 2015;25(6):364–372. doi: 10.1016/j.tcb.2015.01.004. [DOI] [PubMed] [Google Scholar]
- 13.Jayachandran M, Miller VM, Heit JA, Owen WG. Methodology for isolation, identification and characterization of microvesicles in peripheral blood. J Immunol Methods. 2012;375(1-2):207–214. doi: 10.1016/j.jim.2011.10.012. [DOI] [PMC free article] [PubMed] [Google Scholar]
- 14.Kowal J, et al. Proteomic comparison defines novel markers to characterize heterogeneous populations of extracellular vesicle subtypes. Proc Natl Acad Sci USA. 2016;113(8):E968–E977. doi: 10.1073/pnas.1521230113. [DOI] [PMC free article] [PubMed] [Google Scholar]
- 15.Kalra H, et al. Comparative proteomics evaluation of plasma exosome isolation techniques and assessment of the stability of exosomes in normal human blood plasma. Proteomics. 2013;13(22):3354–3364. doi: 10.1002/pmic.201300282. [DOI] [PubMed] [Google Scholar]
- 16.Masuda T, Saito N, Tomita M, Ishihama Y. Unbiased quantitation of Escherichia coli membrane proteome using phase transfer surfactants. Mol Cell Proteomics. 2009;8(12):2770–2777. doi: 10.1074/mcp.M900240-MCP200. [DOI] [PMC free article] [PubMed] [Google Scholar]
- 17.Olsen JV, et al. Global, in vivo, and site-specific phosphorylation dynamics in signaling networks. Cell. 2006;127(3):635–648. doi: 10.1016/j.cell.2006.09.026. [DOI] [PubMed] [Google Scholar]
- 18.Bodenmiller B, et al. PhosphoPep--a phosphoproteome resource for systems biology research in Drosophila Kc167 cells. Mol Syst Biol. 2007;3:139. doi: 10.1038/msb4100182. [DOI] [PMC free article] [PubMed] [Google Scholar]
- 19.Sharma K, et al. Ultradeep human phosphoproteome reveals a distinct regulatory nature of Tyr and Ser/Thr-based signaling. Cell Reports. 2014;8(5):1583–1594. doi: 10.1016/j.celrep.2014.07.036. [DOI] [PubMed] [Google Scholar]
- 20.Mertins P, et al. NCI CPTAC Proteogenomics connects somatic mutations to signalling in breast cancer. Nature. 2016;534(7605):55–62. doi: 10.1038/nature18003. [DOI] [PMC free article] [PubMed] [Google Scholar]
- 21.Snel B, Lehmann G, Bork P, Huynen MA. STRING: A web-server to retrieve and display the repeatedly occurring neighbourhood of a gene. Nucleic Acids Res. 2000;28(18):3442–3444. doi: 10.1093/nar/28.18.3442. [DOI] [PMC free article] [PubMed] [Google Scholar]
- 22.Bourmaud A, Gallien S, Domon B. Parallel reaction monitoring using quadrupole-Orbitrap mass spectrometer: Principle and applications. Proteomics. 2016;16(15-16):2146–2159. doi: 10.1002/pmic.201500543. [DOI] [PubMed] [Google Scholar]
- 23.Peri S, et al. Defining the genomic signature of the parous breast. BMC Med Genomics. 2012;5:46. doi: 10.1186/1755-8794-5-46. [DOI] [PMC free article] [PubMed] [Google Scholar]
- 24.Gong Y, et al. Inhibition of phosphodiesterase 5 reduces bone mass by suppression of canonical Wnt signaling. Cell Death Dis. 2014;5:e1544. doi: 10.1038/cddis.2014.510. [DOI] [PMC free article] [PubMed] [Google Scholar]
- 25.Nam S, et al. A pathway-based approach for identifying biomarkers of tumor progression to trastuzumab-resistant breast cancer. Cancer Lett. 2015;356(2 Pt B):880–890. doi: 10.1016/j.canlet.2014.10.038. [DOI] [PubMed] [Google Scholar]
- 26.Yi T, et al. Quantitative phosphoproteomic analysis reveals system-wide signaling pathways downstream of SDF-1/CXCR4 in breast cancer stem cells. Proc Natl Acad Sci USA. 2014;111(21):E2182–E2190. doi: 10.1073/pnas.1404943111. [DOI] [PMC free article] [PubMed] [Google Scholar]
- 27.Jaros JA, et al. Clinical use of phosphorylated proteins in blood serum analysed by immobilised metal ion affinity chromatography and mass spectrometry. J Proteomics. 2012;76(Spec No):36–42. doi: 10.1016/j.jprot.2012.02.015. [DOI] [PubMed] [Google Scholar]
- 28.Hu L, et al. Profiling of endogenous serum phosphorylated peptides by titanium (IV) immobilized mesoporous silica particles enrichment and MALDI-TOFMS detection. Anal Chem. 2009;81(1):94–104. doi: 10.1021/ac801974f. [DOI] [PubMed] [Google Scholar]
- 29.Iliuk A, Liu XS, Xue L, Liu X, Tao WA. Chemical visualization of phosphoproteomes on membrane. Mol Cell Proteomics. 2012;11(9):629–639. doi: 10.1074/mcp.O112.018010. [DOI] [PMC free article] [PubMed] [Google Scholar]
- 30.Pan L, Iliuk A, Yu S, Geahlen RL, Tao WA. Multiplexed quantitation of protein expression and phosphorylation based on functionalized soluble nanopolymers. J Am Chem Soc. 2012;134(44):18201–18204. doi: 10.1021/ja308453m. [DOI] [PMC free article] [PubMed] [Google Scholar]
- 31.Hermjakob H, Apweiler R. The Proteomics Identifications Database (PRIDE) and the ProteomExchange Consortium: Making proteomics data accessible. Expert Rev Proteomics. 2006;3(1):1–3. doi: 10.1586/14789450.3.1.1. [DOI] [PubMed] [Google Scholar]
- 32.Tyanova S, et al. The Perseus computational platform for comprehensive analysis of (prote)omics data. Nat Methods. 2016;13(9):731–740. doi: 10.1038/nmeth.3901. [DOI] [PubMed] [Google Scholar]
- 33.Shannon P, et al. Cytoscape: A software environment for integrated models of biomolecular interaction networks. Genome Res. 2003;13(11):2498–2504. doi: 10.1101/gr.1239303. [DOI] [PMC free article] [PubMed] [Google Scholar]
- 34.Bader GD, Hogue CW. An automated method for finding molecular complexes in large protein interaction networks. BMC Bioinformatics. 2003;4:2. doi: 10.1186/1471-2105-4-2. [DOI] [PMC free article] [PubMed] [Google Scholar]
- 35.Masuda T, Sugiyama N, Tomita M, Ishihama Y. Microscale phosphoproteome analysis of 10,000 cells from human cancer cell lines. Anal Chem. 2011;83(20):7698–7703. doi: 10.1021/ac201093g. [DOI] [PubMed] [Google Scholar]
- 36.Tsai CF, et al. Sequential phosphoproteomic enrichment through complementary metal-directed immobilized metal ion affinity chromatography. Anal Chem. 2014;86(1):685–693. doi: 10.1021/ac4031175. [DOI] [PubMed] [Google Scholar]
- 37.Rappsilber J, Mann M, Ishihama Y. Protocol for micro-purification, enrichment, pre-fractionation and storage of peptides for proteomics using StageTips. Nat Protoc. 2007;2(8):1896–1906. doi: 10.1038/nprot.2007.261. [DOI] [PubMed] [Google Scholar]
- 38.Cox J, Mann M. MaxQuant enables high peptide identification rates, individualized p.p.b.-range mass accuracies and proteome-wide protein quantification. Nat Biotechnol. 2008;26(12):1367–1372. doi: 10.1038/nbt.1511. [DOI] [PubMed] [Google Scholar]
- 39.O’Shea JP, et al. pLogo: A probabilistic approach to visualizing sequence motifs. Nat Methods. 2013;10(12):1211–1212. doi: 10.1038/nmeth.2646. [DOI] [PubMed] [Google Scholar]
- 40.Mi H, Poudel S, Muruganujan A, Casagrande JT, Thomas PD. PANTHER version 10: Expanded protein families and functions, and analysis tools. Nucleic Acids Res. 2016;44(D1):D336–D342. doi: 10.1093/nar/gkv1194. [DOI] [PMC free article] [PubMed] [Google Scholar]
- 41.MacLean B, et al. Skyline: An open source document editor for creating and analyzing targeted proteomics experiments. Bioinformatics. 2010;26(7):966–968. doi: 10.1093/bioinformatics/btq054. [DOI] [PMC free article] [PubMed] [Google Scholar]
Associated Data
This section collects any data citations, data availability statements, or supplementary materials included in this article.


