Significance
Emergence of resistance to targeted therapy constitutes a limitation to long-term clinical benefits in many instances. To anticipate potential mechanisms of resistance to double minute 2 protein (MDM2) inhibitors, we performed a piggyBac insertional mutagenesis screen in a cohort of allografts with an underlying CDKN2A deletion, in the presence and absence of the MDM2 inhibitor HDM201. Among the most frequent events conferring resistance, we found several mechanisms converging on direct or indirect loss-of-function inactivation of tumor protein 53 (TP53), as well as activation of the antiapoptotic B-cell lymphoma-extra large (Bcl-xL) gene. Importantly, our findings were confirmed in patient-derived xenograft models, underlining the benefit of large-scale in vivo forward genetic screening to identify potential resistance mechanisms to targeted therapeutics.
Keywords: drug resistance, MDM2 inhibitor, piggyBac screen, cancer
Abstract
Inhibitors of double minute 2 protein (MDM2)–tumor protein 53 (TP53) interaction are predicted to be effective in tumors in which the TP53 gene is wild type, by preventing TP53 protein degradation. One such setting is represented by the frequent CDKN2A deletion in human cancer that, through inactivation of p14ARF, activates MDM2 protein, which in turn degrades TP53 tumor suppressor. Here we used piggyBac (PB) transposon insertional mutagenesis to anticipate resistance mechanisms occurring during treatment with the MDM2-TP53 inhibitor HDM201. Constitutive PB mutagenesis in Arf−/− mice provided a collection of spontaneous tumors with characterized insertional genetic landscapes. Tumors were allografted in large cohorts of mice to assess the pharmacologic effects of HDM201. Sixteen out of 21 allograft models were sensitive to HDM201 but ultimately relapsed under treatment. A comparison of tumors with acquired resistance to HDM201 and untreated tumors identified 87 genes that were differentially and significantly targeted by the PB transposon. Resistant tumors displayed a complex clonality pattern suggesting the emergence of several resistant subclones. Among the most frequent alterations conferring resistance, we observed somatic and insertional loss-of-function mutations in transformation-related protein 53 (Trp53) in 54% of tumors and transposon-mediated gain-of-function alterations in B-cell lymphoma-extra large (Bcl-xL), Mdm4, and two TP53 family members, resulting in expression of the TP53 dominant negative truncations ΔNTrp63 and ΔNTrp73. Enhanced BCL-xL and MDM4 protein expression was confirmed in resistant tumors, as well as in HDM201-resistant patient-derived tumor xenografts. Interestingly, concomitant inhibition of MDM2 and BCL-xL demonstrated significant synergy in p53 wild-type cell lines in vitro. Collectively, our findings identify several potential mechanisms by which TP53 wild-type tumors may escape MDM2-targeted therapy.
Among the genes most commonly altered in human cancer, regardless of tumor type, are tumor protein 53 (TP53) tumor suppressor (1) and CDKN2A (INK4a/ARF) (2). The latter gene encodes two tumor suppressor proteins: p16INK4a (3), an inhibitor of cyclin D-dependent kinases that, at least in part, regulates the function of the retinoblastoma protein (RB), and p19ARF (4), a negative regulator of double minute 2 protein (MDM2) function that activates TP53, thereby inducing cell cycle arrest or apoptosis. TP53 protein levels are regulated through MDM2-mediated degradation.
Toward the goal of reactivating TP53 in cells harboring inactivating upstream pathway alterations, compounds inhibiting the interaction between MDM2 and TP53, preventing TP53 degradation, have been discovered. Such agents induce TP53 reactivation in tumors in which the TP53 gene is wild type (5–8). Although preclinical studies of such MDM2 inhibitors have demonstrated significant antitumor activity, tumors commonly relapse (9, 10).
Rapid emergence of resistance is a frequent impediment in targeted therapy, and a better understanding of resistance mechanisms could be beneficial to patient survival through the identification of rational combinations and second-line therapies. In this study, we sought to understand which genes might function as key drivers of resistance to MDM2-TP53 inhibition. We chose to study resistance to HDM201, a highly specific, murine-compatible, and potent small-molecule inhibitor of the TP53-MDM2 protein–protein interaction (9, 11), which is structurally similar to a new class of inhibitors based on an imidazopyrrolidinone scaffold (12). HDM201 has recently entered Phase 1 clinical trials in cancer patients.
Transposon-based mutagenesis has been widely used to identify candidate cancer genes in various types of cancers (13–16) and can generate both loss-of-function (LOF) and gain-of-function (GOF) genetic events. In several studies, this method also has been used to characterize resistance mechanisms in vitro (17–19) and in mice (20). Consequently, we conducted a large-scale transposon-based insertional mutagenesis screen to investigate the resistance to HDM201 in mice. Tumor-prone Arf null mice (21), in which TP53 is suppressed by MDM2, were crossed with mice carrying the piggyBac (PB) transposon system (15), composed of the PB DNA transposon ATP2-S1 (ATP2) and a constitutively expressed PB transposase from the Rosa26 locus (RosaPB) (15). The PB transposon system has cut-and-paste properties without leaving undesired footprints, and the ability to integrate randomly throughout the entire genome. Monitoring emerging resistance in spontaneous tumors is technically challenging, and thus the screening was performed after these tumors were transplanted into the flanks of recipient mice and these allografted tumors were expanded in larger cohorts of animals. This approach allowed for the study of a substantially larger number of resistant tumors.
The results from our screen shed light on the diversity of resistance mechanisms encountered on disruption of the TP53-MDM2 interaction. They also support the use of transposon-based mutagenesis as a powerful tool for the identification of novel resistance genes and mechanisms in genetically modified mouse models, and constitute the first in vivo resistance screen for TP53-MDM2 inhibition. Our insights may lead to better combination strategies in patients with TP53 wild-type tumors who experience relapse while being treated with MDM2-TP53 inhibitors.
Results
PB-Induced Spontaneous Tumors in the Arf−/− Background and Derived Allograft Models.
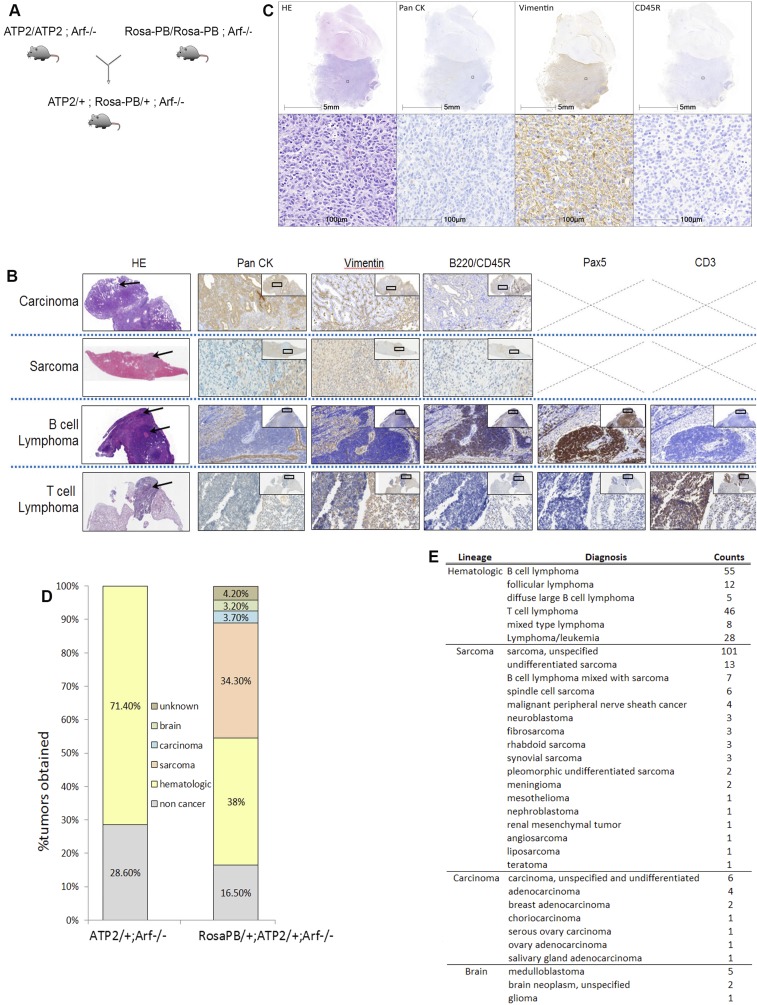
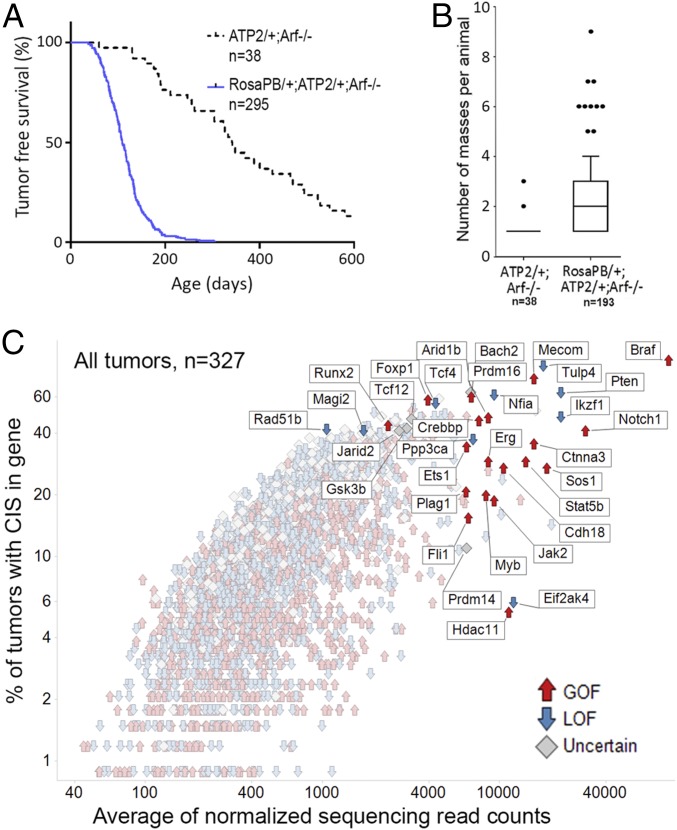
To generate a set of tumors suitable for assessing MDM2 inhibitor sensitivity and the emergence of resistance, we crossed mice to combine genetic components of the constitutive PB system bearing ATP2-S1 (ATP2) and Rosa26-transposase (RosaPB) (15) with an Arf null allele (Fig. S1A) deficient for p19Arf, a tumor suppressor and TP53 regulator (21, 22). Consistent with a previously described Sleeping Beauty mutagenesis in an Arf−/− background (23), PB mutagenesis significantly decreased the time to morbidity in our cohort of 295 Arf−/− mice (Fig. 1A); however, the tumor spectrum in Arf−/− mice with PB mutagenesis was altered compared with that found in Arf−/−-only mice (Fig. S1 B–D). Histopathological analyses of 331 tumors showed that constitutive PB together with Arf deletion, in a mixed genetic background, leads to a broad range of pathologies, including hematologic tumors, sarcomas, and, to a lesser extent, carcinomas and brain tumors (Fig. S1E).
Fig. S1.
Generation of experimental animals used in the Arf−/− transposon screen. (A) Scheme of the genetic cross used to generate the RosaPB/+;ATP2/+;Arf−/− mice. The ATP2-S1 transposon concatamer inserted in mouse chromosome 17 carries approximately 15 transposon copies (15). The donor transposon concatamer is mobilized by PB transposase (RosaPB) expression. PB transposase is inserted in the Rosa26 locus. The Arf knockout component (21, 22) was used to accelerate disease onset and produce tumors sensitive to the HDM201 inhibitor. (B) Staining used to identify the following pathologies: carcinoma, sarcoma, B-cell lymphoma, and T-cell lymphoma. H&E, pan-cytokeratin (CK), vimentin (Vim), and B220 or CD45R were used for all masses harvested. In case of a hematologic tumor, Pax5 and CD3 staining was performed to distinguish between T-cell and B-cell lymphoma. (Magnification, 10× for H&E and 40× for other staining.) Arrows point to the tumor part of the organ. (C) Example of the histopathology characterization for a medulloblastoma tumor. (D) Gross pathology and lineage of masses harvested on necropsy of experimental animals of indicated genotypes. n = 38 ATP2/+;Arf−/− control mice (34 masses) and n = 193 RosaPB/+;ATP2/+;Arf−/− mice (396 masses). Noncancer includes nonmalignant tumors and other nontumoral pathologies. (E) Pathology obtained for all RosaPB/+;ATP2/+;Arf−/− tumors analyzed.
Fig. 1.
Survival of RosaPB/+;ATP2/+;Arf−/− mice and tumoral insertional landscapes. (A) Survival curve (conditional survival) showing significant acceleration of disease onset with activated PB transposon (P > 0.0001, log-rank test). (B) Number of masses harvested from necropsied animals is on average significantly higher for RosaPB/+;ATP2/+;Arf−/− mice than for ATP2/+;Arf−/− mice (P < 0.0001, Mann–Whitney U test). (C) Genetic landscape of PB insertions in the 327 RosaPB/+;ATP2/+;Arf−/− tumors sequenced.
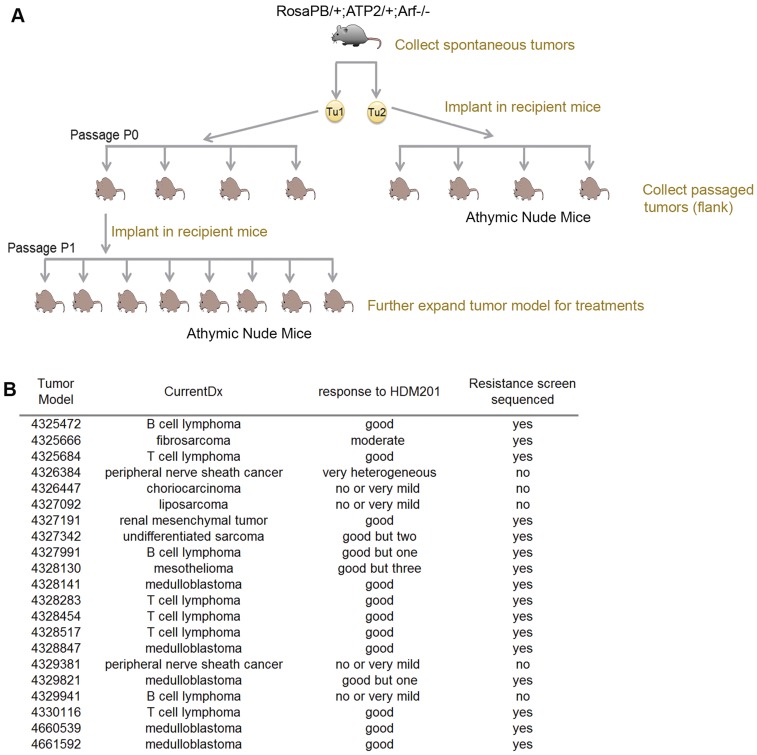
To enable drug testing using the Arf−/− PB model, we serially transplanted tumors as for human patient-derived xenografts (9). To this end, we implanted fragments of spontaneous RosaPB/+;ATP2/+;Arf−/− tumors s.c. in athymic nude mice. Once an allograft tumor grew, it was further expanded in 20–60 immunodeficient mice (Fig. S2A). The overall rate of successful engraftment was 72.4%, and 21 independent allograft models, including 8 lymphomas, 6 sarcomas, and 5 medulloblastomas (Fig. S2B), were used to study resistance to HDM201.
Fig. S2.
Expansion of allograft tumor models bearing the Arf deletion and activated PB transposon for HDM201 treatment. (A) The spontaneous tumors were collected in RosaPB/+;ATP2/+;Arf−/− animals. For each tumor, a fragment was implanted s.c. in the flank in an athymic nude mouse (passage 0). After the tumor grew, it was harvested, cut, and implanted again in an athymic nude mouse (passage 1). (B) List of 21 expanded allograft tumor models bearing the Arf deletion and activated PB transposon. The overall response to HDM201 and sequencing status are indicated for each model.
Insertional Mutagenesis Landscapes in Arf-Deleted PB Tumors.
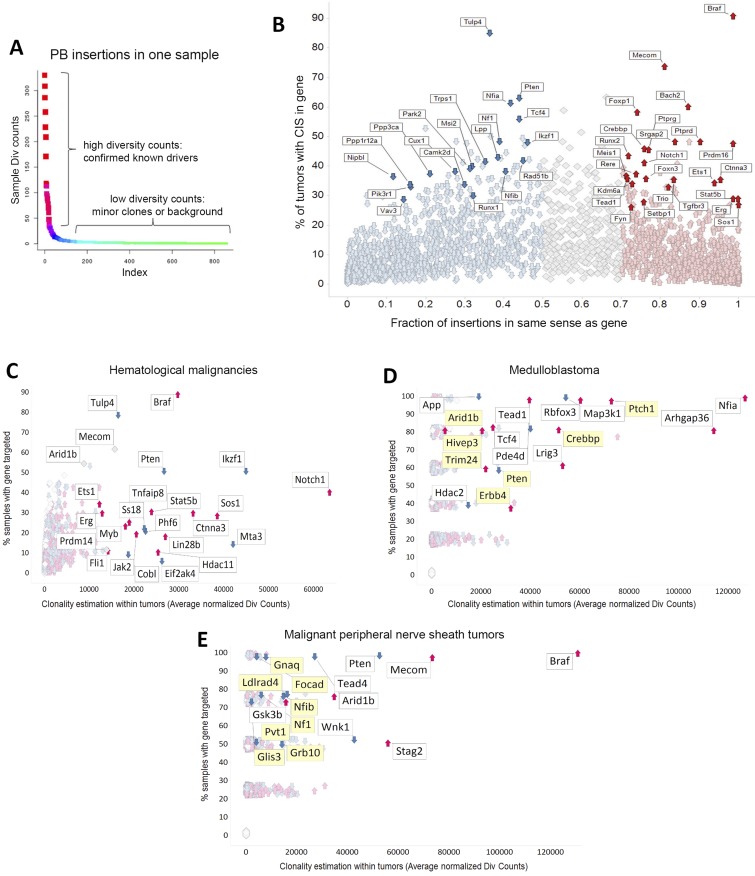
To robustly identify genes recurrently targeted by transposons with good statistical power, we first sequenced the transposon insertion sites of 327 spontaneous tumors obtained from RosaPB/+;ATP2/+;Arf−/− mice. Following DNA shearing, amplicons were derived by a splinkerette PCR and sequenced from both transposon arms (24). This method allowed us to consider only the diversity counts (div counts hereinafter) within each sample; each uniquely sheared end was counted rather than all sequencing counts, thereby minimizing PCR-induced amplification effects. Using a gene-centric common insertion site (gCIS) calling method (25, 26), which identifies densities higher than predicted by chance of transposon insertions within the coding regions plus the 10-kB promoter of all RefSeq genes, we identified 2,444 CISs found in at least two tumors (Fig. 1C and Dataset 1). Two parameters were considered for each CIS: the number of tumor samples in which the CIS gene was targeted and the average of normalized div counts that estimate the frequency of insertion at the CIS within samples. Because each sample was deeply sequenced (at least 105 normalized div counts for each PB arm), CIS genes could be identified in just one sample (Fig. S3A).
Fig. S3.
Characterization of PB insertion sites in RosaPB/+;ATP2/+;Arf−/− primary tumors. (A) Example of PB insertion pattern in one sample. Our methods allow the identification of CISs from one sample. DNA shearing randomly cuts DNA, allowing us to consider div count. There were at least 105 mapped div counts for each PB arm. (B) Thresholds applied for prediction of GOF or LOF transposon insertions. For each gene, the fraction of PB insertions in same sense as gene was calculated. Less than 50% of insertions in the same orientation is considered a predicted tumor-suppressive effect, whereas >70% of insertions in the same orientation is a predicted oncogene. All 327 RosaPB/+;ATP2/+;Arf−/− tumors sequenced are represented. (C–E) PB insertional patterns in specific indications, from RosaPB/+;ATP2/+;Arf−/− spontaneous tumors. (C) Insertional landscape for 154 hematologic tumors. Ikzf1, Notch1, Stat5b, and Jak2 are examples of genes disrupted in human hematologic disorders and also found also targeted by PB;Arf−/− hematologic tumors. (D) Insertional landscape for five medulloblastoma tumors. Mild y-axis jittering was applied; actual values are provided in Dataset S1. The genes highlighted in yellow are also mutated in human medulloblastomas (36–38). (E) Insertional landscape for four MPNSTs. Mild y-axis jittering was applied; actual values are provided in Dataset S1. The genes highlighted in yellow are also mutated in human MPNSTs (35).
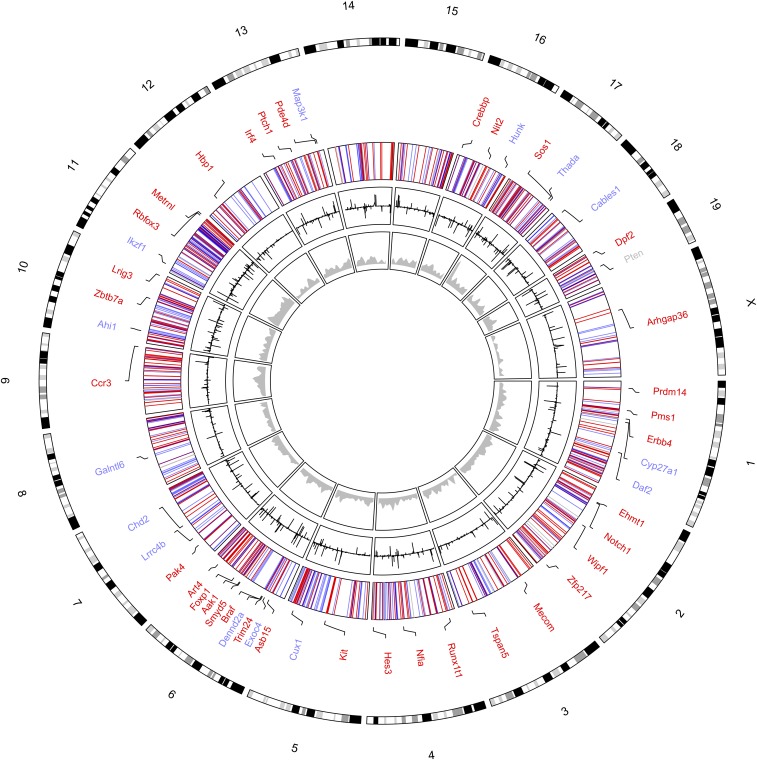
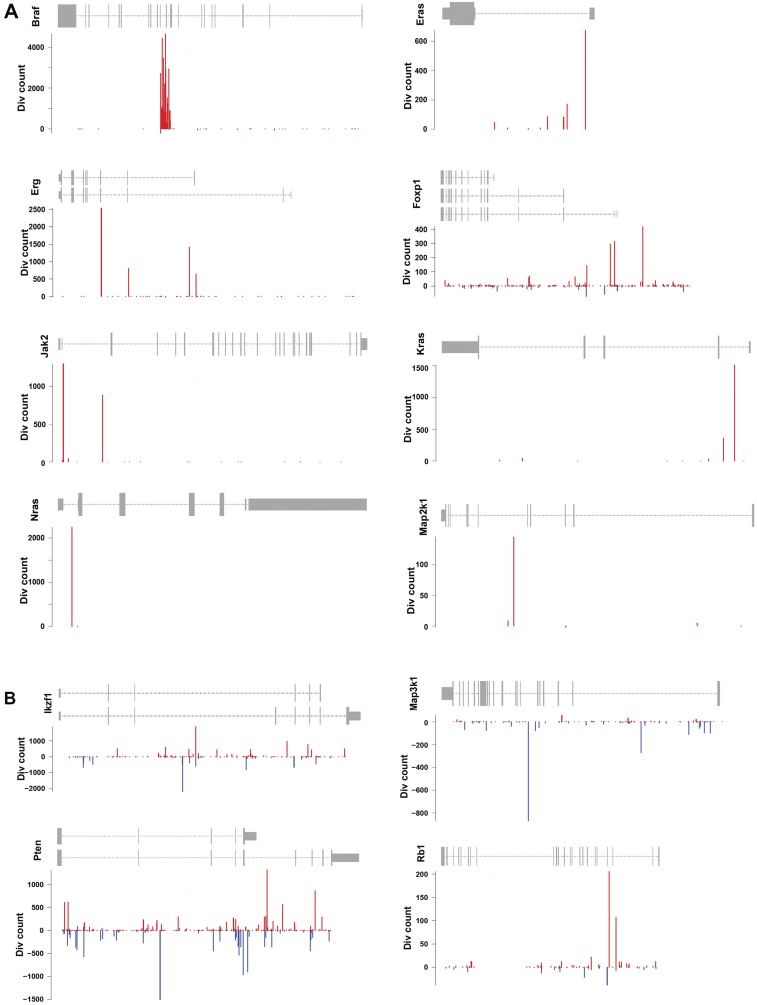
Our data from the PB transposon show negligible local hopping, consistent with a previous report (27). Indeed, although we observed a mild peak of integration at the donor site on chromosome 17, this site retained very low clonality or frequency (Fig. S4). In addition, we detected no local hopping at regions of abundant directional insertion sites, including within the Braf gene (Fig. S5). Consequently, we could define predictive thresholds for which oncogenes or tumor suppressor functions could be estimated (Figs. S3B and S5) by looking at the fraction of PB insertions in same or opposite sense as the gene. Consistent with previous Sleeping Beauty mutagenesis in the Arf−/− background (23), Braf was the most frequent target for transposon insertion. It was found in 90.8% of tumors, indicating that it may constitute a major cooperating pathway with Arf LOF in mice. Indeed, we found no insertions at Braf in PB tumors with no Arf deletion (data not shown). The Braf gene was PB-inserted between exons 8 and 12 in a directional manner (Fig. S5A), presumably leading to the expression of a specific constitutively active truncated protein, as described previously (23, 28). Similar human BRAF gene truncations or fusions have been reported in human brain, pancreatic, and prostate tumors (28–34). In some cases, the insertional landscape exhibited genetic specificities consistent with respective tumor indications (Fig. S3 C–E); for instance, genes commonly mutated in patients with peripheral nerve sheath cancers (MPNSTs) (35) and medulloblastomas (36–38) were also identified in our samples. Ptch1 was among the top-five CIS genes in our medulloblastoma samples (Fig. S3D). Ptch1 disruption in mouse models leads to medulloblastoma development (39).
Fig. S4.
Circos plot representing the distribution of CIS insertions in the 327 RosaPB/+;ATP2/+;Arf−/− tumors sequenced. The innermost ring (gray) represents the genomic density of PB insertions in 10-kb windows. Each inserted position is counted once per sample, regardless of the number of reads at this position. The next ring (black) shows the number of unique reads at each position, illustrating the CIS distribution. Bars facing inward represent reads on the negative strand, whereas bars facing outward represent reads on the positive strand. The third ring represents the functional prediction of CISs: GOF (red), LOF (blue), and unpredictable (gray). Mouse chromosomes are shown at the periphery of the plot.
Fig. S5.
Examples of PB insertional patterns in oncogenes and tumor suppressor genes. (A) Known oncogenes. (B) Known tumor suppressor genes. Data are from all 327 RosaPB/+;ATP2/+;Arf−/− tumors sequenced.
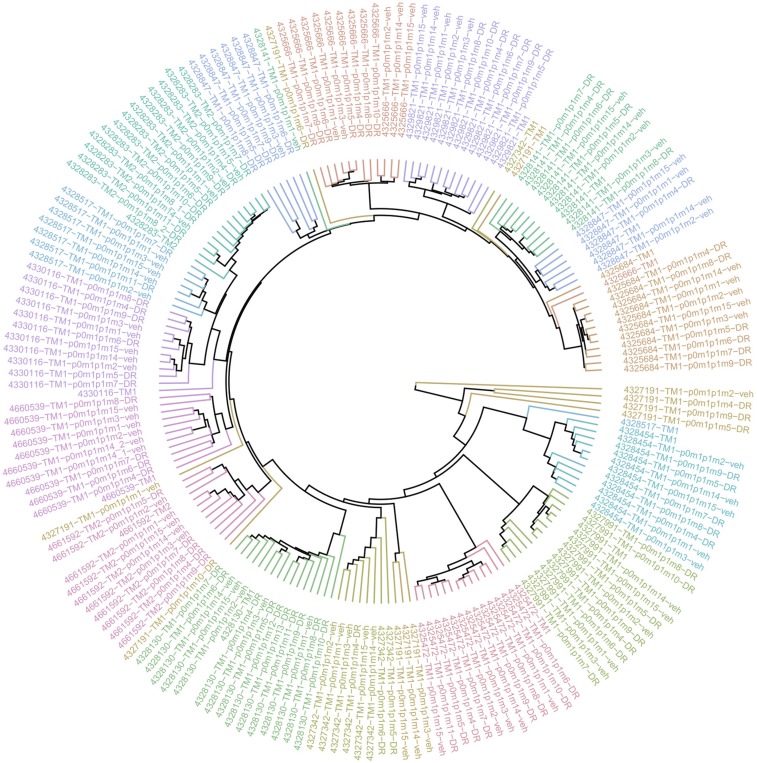
We next sought to understand the extend of genetic drift after tumor fragment transplantation and expansion for RosaPB/+;ATP2/+;Arf−/− allografted tumors. Comparison of insertional patterns in a t-distributed stochastic neighbor embedding analysis, taking the div counts for each CIS into account, revealed mild genetic drifts. All tumors of the same model generally clustered together (Fig. S6).
Fig. S6.
Low genetic drift in RosaPB/+;ATP2/+;Arf−/− allografted tumors. The hierarchical clustering analysis, represented as a circular dendrogram, shows the distribution of insertional landscapes of 16 allografted tumor models. Each model is represented by one color. The spontaneous tumors are indicated with tumor ID-TM1 (TM, tumor). The tumor from the first s.c. implantation is designated p0 (passage 0), and further passages are designated p1, p2, etc. m1, m2, m3, etc. refer to the mouse number in p0, or p1 for precise tracking of tumor expansion. For allografted mice that were treated, the treatment is indicated in the sample name. DR, drug resistant; HDM201, mouse treated with HDM201 twice weekly; veh, mouse treated with vehicle twice weekly; SD, mouse treated with vehicle twice weekly and a single dose of HDM201 just before harvesting tumor. We generally observed short clustering distances between samples of same model, suggesting that resistance did not dramatically change insertional patterns.
Response and Resistance to TP53-MDM2 Inhibition in PB Allografts.
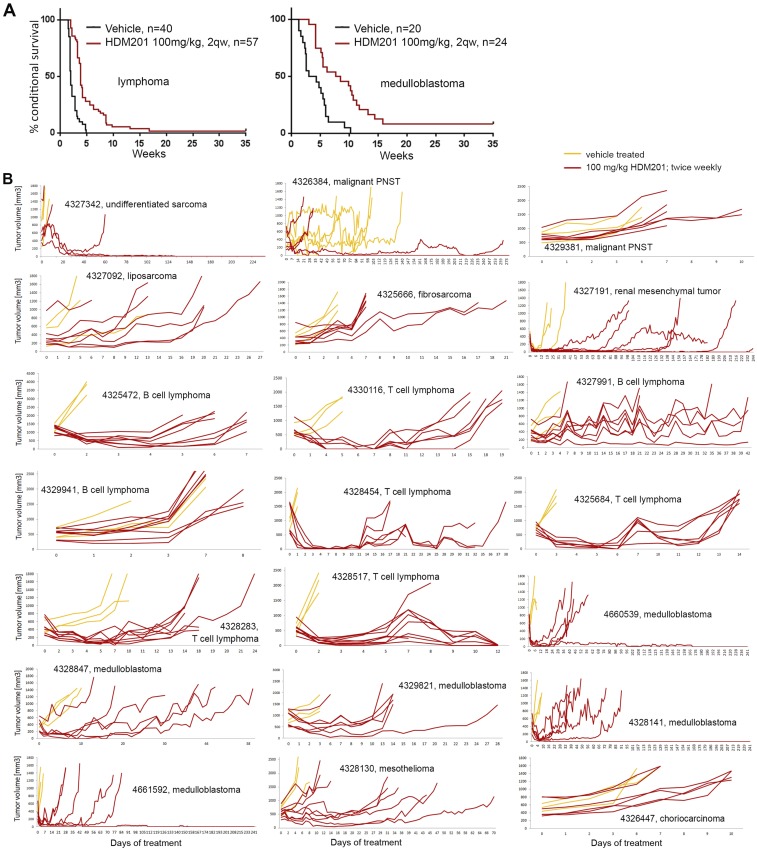
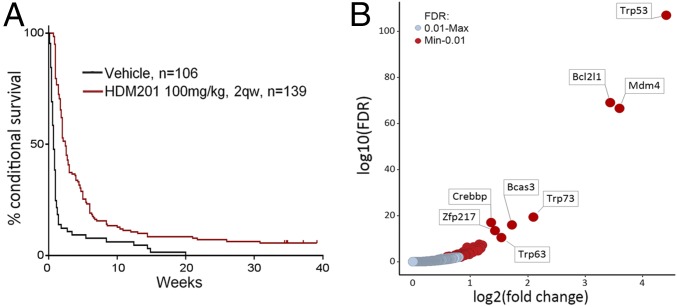
Loss of p14ARF occurs in numerous cancers through deletion of the CDKN2A gene. ARF loss raises the MDM2 level, which in turn degrades TP53. HDM201 disrupts both human and murine TP53-MDM2 interactions, with nanomolar cellular IC50 values, blocking TP53 degradation (11, 12). Because of Arf deletion, we expected RosaPB/+;ATP2/+;Arf−/− transplanted tumors to respond to HDM201; however, the insertional landscapes may alter the dependency by introducing other, eventually dominant, oncogenic events (Fig. 1B). To assess the tumor sensitivity to HDM201, we treated 21 allograft models (Fig. S2B) at passage 1 (Fig. S7). After random enrollment, 139 mice were treated twice weekly with 100 mg/kg of HDM201, and 106 mice were treated with vehicle. We found a significant response rate across the 21 models (Fig. 2A and Fig. S7), suggesting that Arf deletion generally confers tumor dependency to MDM2 inhibitors, as predicted. Overall, only 5 out of 21 models exhibited a poor response to HDM201 and intrinsic resistance. The remaining models responded, but most tumors eventually relapsed (Figs. S2B and S7). In total, 6 out of 139 mice (4.3%) were potentially cured, experiencing no relapse within 60 d after the last dose. The average number of CISs per model from untreated tumors was not significantly different between the responsive and nonresponsive models. We found an average of 195 CISs per individual tumor for the responders and 202 per individual tumor for the nonresponders. This suggests that the insertional heterogeneity is likely not the reason for the lack of response to HDM201. We also could not identify specificities in the genetic patterns between nonresponsive and responsive tumors. In summary, despite a good initial response rate to HDM201 for the RosaPB/+;ATP2/+;Arf−/− implanted tumors, most tumors eventually became resistant.
Fig. S7.
Characterization of response to HDM201 treatment of RosaPB/+;ATP2/+;Arf−/− allografted tumors. (A) Kaplan–Meyer curves for all lymphomas and medulloblastomas. In both cases, the treated animals survived significantly longer (P < 0.0001, log-rank test). The improved overall survival was of 1.85 wk for lymphomas and 4.4 wk for medulloblastomas. One animal with a lymphoma could be cured, and three animals with medulloblastomas could be cured, with no sign of relapse at 60 d after the last dose. (B) Tumor growth curves in response to HDM201 or vehicle. Data from individual RosaPB/+;ATP2/+;Arf−/− allograft-bearing mice are represented. One graph represents one allograft model. A total of 106 mice were treated with vehicle, and 139 mice were treated with HDM201.
Fig. 2.
Response and resistance to HDM201 TP53-MDM2 inhibitor allografted mice. (A) Kaplan–Meier curve representing the conditional survival of mice after the first treatment dose. All 21 RosaPB/+;ATP2/+;Arf−/− tumor models are combined. The median survival was 0.71 wk for vehicle-treated animals (n = 106) and 2.48 wk for the animals treated twice weekly (n = 139) (P < 0.0001, log-rank test). (B) Comparative analysis of insertional patterns between vehicle-treated tumors and tumors that emerged from HDM201-treated and -resistant tumors. The models used are listed in Fig. S2B. A total of 87 genes were found to be significantly differentially inserted in resistant vs. untreated tumors [false discovery rate (FDR) = 0.01].
Identification of Mechanisms of Resistance to TP53-MDM2 Inhibition by Insertional Mutagenesis.
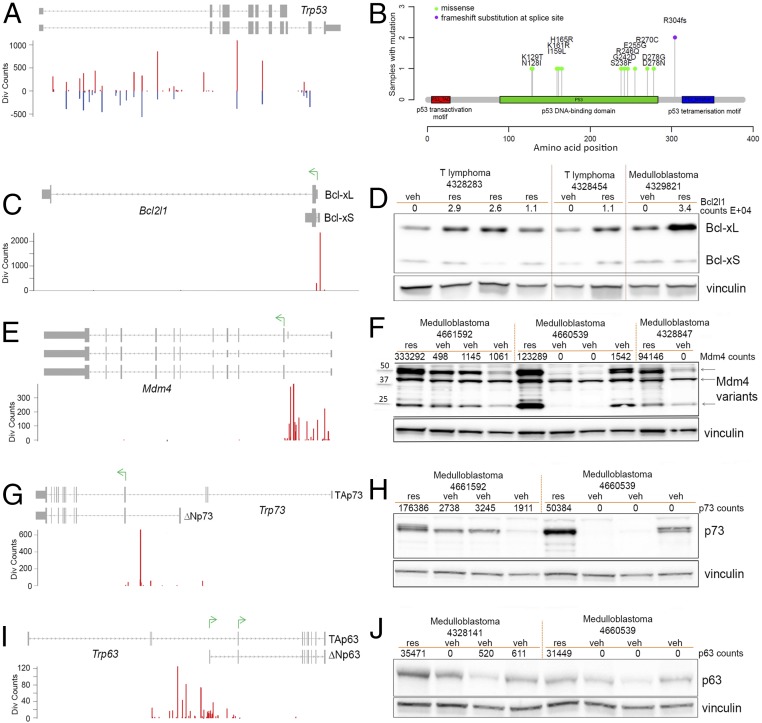
To define insertional events linked to the development of resistance to TP53-MDM2 inhibition, we subjected genomic DNA from resistant and vehicle-treated tumors to splinkerette PCR and deep sequencing to define gCIS landscapes (Dataset S2). Hierarchical clustering analysis revealed that resistant and untreated tumors of the same model had conserved insertional patterns (Fig. S6), and thus resistance did not induce a major genetic drift. A differential integration analysis identified PB target genes that were significantly enriched in 95 resistant tumors compared with 80 vehicle-treated tumors (Fig. 2B and Dataset S2). A total of 87 genes were identified, suggesting diversity and/or heterogeneity of the resistance mechanism; however, gene ontology/pathway analysis for these 87 genes revealed that only the TP53 pathway, including transformation-related protein 53 (Trp53), Trp63, Trp73, and Mdm4, was significantly represented. Trp53 was the most significantly enriched gene in HDM201-resistant tumors. Variable intratumoral clonality, based on the analysis of div counts, suggested homozygous, heterozygous, or subclonal targeting (Fig. 3). The PB bidirectional pattern predicted a LOF (Fig. 4A). This is in line with previously reported data identifying TP53 mutagenesis as a major mechanism of resistance to TP53-MDM2 inhibitors, for either intrinsic resistance (7) or induced resistance (40–42). Trp53 exons sequencing of all our resistant DNA samples also identified Trp53 somatic mutations in 13 out of 95 resistant tumors (Fig. 3), in exons coding for the DNA-binding domain (12 samples), or a splice site (one sample) (Fig. 4B). In total, 53.7% of tumors (51 out of 95) had a Trp53 mutation, either somatic or insertional.
Fig. 3.
Resistance mechanisms identified in HDM201-resistant tumors. Representation of major PB transposon insertions found significantly enriched in RosaPB/+;ATP2/+;Arf−/− HDM201-resistant implanted tumors compared with untreated tumors (n = 95 tumors with differential PB insertions). Predicted GOF or LOF transposon mutations and clonality are represented; transparency is obtained by scaling the normalized div count between 0 and 1. The presence of Trp53 somatic mutations is indicated by a green rectangle.
Fig. 4.
Characterization of genetic modifications in HDM201-resistant tumors. (A, C, E, G, and I) PB insertional patterns in specific genes, from HDM201-resistant tumors. Red bars represent insertions in the same sense as the gene; blue bars, insertions in the opposite sense from the gene. (A) Insertional pattern in Trp53 gene suggesting an LOF. (B) Somatic mutations identified on the mouse Trp53 gene in RosaPB/+;ATP2/+;Arf−/− allografted tumors that are resistant to HDM201. Out of 95 tumors sequenced, 13 were found with a mutation within Trp53 exons or splice sites. (C) Insertional pattern in Bcl2l1 gene suggesting a GOF. (D) Western-blot analysis of tumors shows that BCL-xL is the Bcl2l1 isoform expressed when PB insertion is found in resistant tumors. veh, vehicle-treated tumors; res, HDM201-resistant tumors. (E) Insertional pattern in Mdm4 suggesting a GOF. (F) Western blot analysis of tumors showing that several MDM4 variants are produced when PB insertion is found in resistant tumors. (G) Insertional pattern in Trp73 suggesting a GOF and production of a shorter isoform. (H) Western blot analysis of tumors shows that TRP73 (p73) is overexpressed in resistant tumors bearing PB insertions in Trp73. The protein size difference between isoforms is too small to be distinguishable. (I) Insertional pattern in Trp63 suggesting a GOF and production of a shorter isoform. (J) Western blot analysis of tumors showing TRP63 (p63) protein levels in resistant tumors bearing PB insertions in Trp63. The protein size difference between isoforms is too small to be detectable.
Bcl2l1 was identified as the second major enriched target in HDM201-resistant tumors, with a GOF insertional pattern that did not allow distinction between expression of B-cell lymphoma-extra large (Bcl-xL) or Bcl-xS transcripts (Fig. 4C). However, our immunoblotting experiment demonstrated that BCL-xL protein, but not BCL-xS, was expressed in resistant tumors with transposon insertion in the Bcl2l1 promoter (Fig. 4D). BCL-xL acts in the mitochondrial apoptotic pathway (43, 44), and our data suggest that the TP53-mediated proapoptotic response may be efficiently counteracted by BCL-xL expression in resistant tumors. Mdm4 was targeted with a high-clonality GOF pattern in eight resistant tumors (Fig. 4E). MDM4 (also known as MDMX) is another regulator of TP53 that is structurally related to MDM2 but acts differently on TP53 by regulating its transcriptional activity independently of MDM2 or its protein level coordinately with MDM2 (45, 46). Our results thus provide evidence that Mdm4 overexpression (Fig. 4F) confers resistance to selective TP53-MDM2 inhibition.
Two Trp53 family members, Trp63 and Trp73, were targeted in several HDM201-resistant tumors. Each gene of the TP53/Trp53 family produces several isoforms owing to alternative transcription start or splicing. P2 alternative promoters produce transactivation domain-deficient proteins (ΔN) with dominant-negative functions. Heterocomplexes with ΔN forms compete off long-TA (entire transactivation domain) isoforms from their target gene promoters, thereby preventing efficient transcription (47). Our data reveal a number of HDM201-resistant tumors with unidirectional insertions in Trp63 and Trp73 and consistent protein overexpression (Fig. 4 G–J). Transposon insertions were located specifically near P2 promoters, suggesting the expression of truncated variants similar to ΔNTrp73 and ΔNTrp63, consistent with a dominant negative function on TRP53 (47).
Overall, four genes known to regulate TRP53 activity directly or indirectly were identified as major GOF hits. TRP53 stability, transcriptional regulation, and mitochondrial apoptosis activities were targeted through MDM4, BCL-xL, ΔNTRP63, and ΔNTRP73 in 63% of tumors.
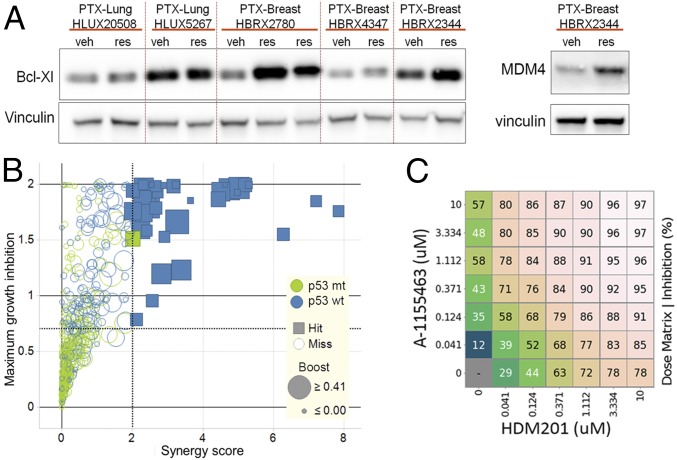
Because both MDM4 (48) and BCL-xL are known druggable targets, we next investigated whether their enhanced expression was observed in patient-derived tumor xenograft models (PDX) models. To this end, we took advantage of a cohort of previously tested breast and lung patient tumor xenograft that acquired resistance to HDM201 (9). MDM4 protein was overexpressed only in one PDX-resistant model out of 24 assessed, whereas BCL-xL overexpression was detected in five resistant human tumors (Fig. 5A).
Fig. 5.
Bcl-xL expression confers resistance to HDM201. (A) Western blot analysis showing BCL-xL and MDM4 protein expression in PDX models that acquired resistance to HDM201 or CGM097 (res) or were matched vehicle-treated (veh) (9). (B) Score plots for the combination of CGM097 and ABT-263 from an in vitro combination screen on 485 cancer cell lines treated with ranges of concentrations for CGM097 and ABT-263. Cell lines with no TP53 mutation are shown in blue (p53 wt), and cell lines with TP53 modification are shown in green (p53 mt). Boost describes the maximal growth inhibition for any combination vs. the highest single agent activity. (C) Synergistic effect of combinations of HDM201 TP53-MDM2 inhibitor and A-1155463 Bcl-xL inhibitor in the SNG-M cell line. Percent inhibition is shown, each number representing the average of three replicates. Gradient of colors was used for better visualization.
BCL-xL Reduces Activity of MDM2 Inhibitors in Human TP53 Wild-Type Tumor Models.
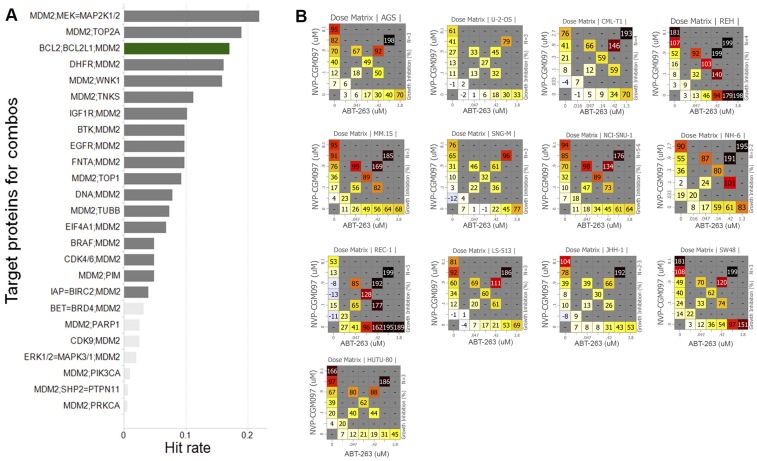
BCL-xL can be pharmacologically inhibited by the dual BCL-2/BCL-xL inhibitor ABT-263 (49) or by a BCL-xL– selective inhibitor, such as A-1155463 (50). To understand whether dual inhibition of BCL-xL and MDM2 might be beneficial across a broad spectrum of cancers, we evaluated the synergistic effects of 51 compounds with CGM097 in an in vitro viability screen on 485 cancer cell lines (9, 51). Interestingly, ABT-263 was among the best combination partners with CGM097 in the 138 of these cell lines that were wild type for TP53 (Fig. S8A). Exposing the 485 cancer cell lines to a dose matrix of ABT-263 and CGM097, an earlier TP53-MDM2 inhibitor (5–7), revealed significant synergy in 35 out of the 138 TP53 wild-type cell lines, and no significant synergy in TP53 mutant cell lines (Fig. 5B and Fig. S8B). Collectively, these data suggest that a fraction of patients with TP53 wild-type tumors might benefit from a dual treatment with BCL-2/BCL-xL inhibitor and MDM2 inhibitor, consistent with previous observations in leukemia that combination treatment of MDM2 inhibitor and ABT-263 could achieve longer-term tumor regression (41).
Fig. S8.
The best combinations identified with the TP53-MDM2 inhibitor CGM097. (A) A total of 51 compounds were screened in combination with CGM097 (5) in 138 TP53 wild-type cell lines. The CGM097 + ABT-263 combination exhibited the third-best combination activity (green bar). Only the 25 best combinations are represented; light-gray bars indicate a lack of statistical significance. A hit is defined as a combination with a synergy score >2 and a maximum growth inhibition >0.7 in individual cell lines over all assayed cell lines. (B) Representative examples of CGM097/ABT-263 combination responses. The percent of growth inhibition is represented in the visualization matrix. The cell line name is indicated at the top of each matrix, and the number of replicates is indicated on the right side of each matrix.
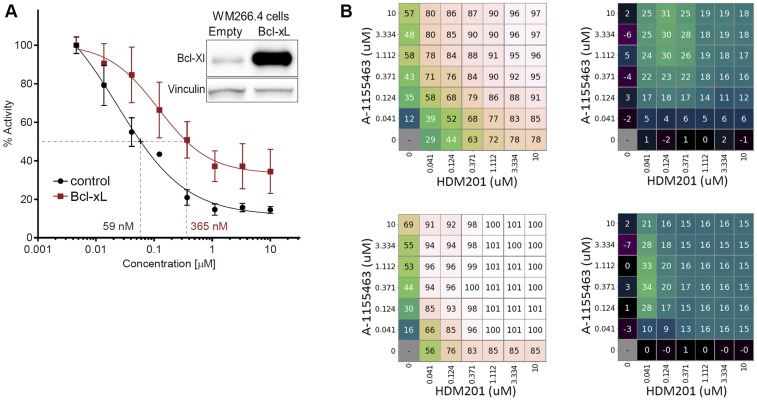
To confirm that the combination effects were mediated by BCL-xL and not BCL-2 inhibition, we performed dose-matrix combination experiments with HDM201 and the BCL-xL–selective inhibitor A-1155463 (50) in two of the cell lines (SNG-M and LS-513) with relatively high BCL-xL baseline expression that responded well to a combination of CGM097 and ABT-263. As expected, we found strong synergy between HDM201 and A-1155463 in both lines (Fig. 5C and Fig. S9). Conversely, induced overexpression of BCL-xL in a metastatic melanoma TP53 wild-type cell line (WM266.4) with relatively low baseline expression of BCL-xL led to a markedly reduced sensitivity to HDM201, with a sixfold higher GI50 when BCL-xL was overexpressed (Fig. S9).
Fig. S9.
Bcl-xL modulates the sensitivity of cell lines to TP53-MDM2 inhibition. (A) Shift of sensitivity to HDM201 treatment in WM226.4, a p53 wild-type melanoma cell line, transiently transfected with Bcl-xL, compared with cells transfected with a control plasmid. The curve is representative of two independent experiments of a 3-d cell viability assay. The IC50 was sixfold higher on average on Bcl-xL expression. The Western blot shows expression of Bcl-xL after transient transfection in WM226.4 cells. (B) Synergistic effect of combinations of HDM201 TP53-MDM2 inhibitor and A-1155463 Bcl-xL inhibitor in two cell lines. SNG-M cells (Upper) and LS-513 cells (Lower) were treated for 3 d with a 7 × 7 dose matrix of HDM201 and A-1155463. (Left) Percent inhibition, with each field representing the average of three replicates. (Right) The additional (or reduced) effect level, in percent, relative to drug self-combinations based on the Loewe model.
Discussion
Here we used the PB transposon system in an Arf-deleted mouse model to identify genes that accelerate tumorigenesis and mediate resistance to the TP53-MDM2 inhibitor HDM201. We used DNA shearing followed by splinkerette PCR and deep sequencing to allow quantification of the amplicon diversity based on the sheared end and estimation of the clonality of each tumor sample. From the 327 PB tumors in the Arf null background, we identified 2,444 candidate cancer genes. On average, 284 ± 145 CIS genes were identified per tumor, much more than the 15 copies carried in the ATP2 transposon (15). These results reveal the existence of substantial intertumoral and intratumoral heterogeneity; however, only 7.9% of these genes were frequently altered, with more than 20,000 normalized div counts on average per tumor, whereas the majority (92.1%) displayed low-frequency insertions and thus may be less impactful (Fig. S3A). Overall, the average number of CISs with high clonality was only 17.7 ± 6.6 per tumor, more consistent with Darwinian theories of evolution in tumors, where certain subclones containing a selective growth or survival advantage in comparison with others are likely to proliferate and eventually form the majority of the tumor population.
In the RosaPB/+;ATP2/+;Arf−/− models, no significant local transposon hopping effect was observed. The low number of background insertions allowed us to define a method to permit the prediction of GOF or LOF transposon insertions. Known oncogenes and tumor suppressor genes can be successfully predicted with our methods. In total, 952 of the CISs were predicted as GOF and 1,153 as LOF, whereas 339 could not be predicted. The most frequently targeted oncogene was a specific truncated version of the Braf gene that leads to constitutive activation of the protein. This is consistent with a previous report also using transposon-based mutagenesis in the Arf−/− background (23). The fact that Braf insertions were not identified in PB tumors with no Arf deletion (data not shown) suggests that truncated Braf and Arf LOF may cooperate in mice. Other frequently activated oncogenes were Mecom, Foxp1, and Bach2, whereas the major tumor suppressor genes identified included Pten, Ikzf1, Tulp4, and Tcf4, among others (Fig. S5).
We performed a screen to identify genes involved in the resistance to TP53-MDM2 inhibition. To this end, we used allografted tumors from 16 RosaPB/+;ATP2/+;Arf−/− tumor models sensitive to HDM201, and found 87 CIS genes significantly targeted in resistant tumors but not (or not much) in vehicle-treated tumors. Our work represents an important example of how in vivo transposon-mediated mutagenesis can be used to elucidate genetic mechanisms of cancer drug resistance. Our allograft approach facilitates sample generation used to identify novel genes and mechanisms, and the PB transposon provides a powerful tool for identifying GOF or LOF resistance mechanisms to TP53-MDM2 targeted inhibition. The general stability of PB genetic landscapes, revealed by the absence of major genetic drift across passaging or on HDM201 resistance acquisition, permits the identification of genes specifically targeted in HDM201-resistant tumors compared with vehicle-treated tumors.
Inhibition of the TP53 gene itself by mutagenesis is a known major mechanism of resistance to TP53-MDM2 inhibitors for either intrinsic resistance (7) or induced resistance (40, 42). We consistently identified not only PB mutation in the Trp53 gene, but also somatic mutations in 13 out of 95 Trp53 sequenced tumors (13.8%). In total, 53.7% of tumors carried a Trp53 mutation, either somatic or transposon. The somatic mutations were likely inhibitory, found mainly in the DNA-binding domain, whereas the PB mutation pattern was consistent with an LOF. The presence of TP53 inhibitory somatic mutations revealed that PB transposon was not the sole mutagen acting in these tumors. Indeed, the ATP2-S1 PB model used here is known to carry 15 transposon copies; however, tumors generally carry larger numbers of genetic alterations (52), and succession of genetic alterations is likely required to achieve cancer progression into a resistant state. Therefore, it is plausible that PB insertions are not the only functional somatic modifications. The nature of CIS genes targeted by PB (Dataset S1) suggests that diverse genetic and epigenetic posttranslational alterations likely occur in these tumors. For instance, a number of genes known to be altered in cancer and to generate genomic instability were found to be mutated by PB, including Rad51b, Rad51d, Atm, Wrn, Nbn, Mlh1, Msh5, and Pms1, known to promote somatic mutations in human cancers (53, 54). In addition, alterations of known chromatin remodeling factors, including Arid1b, four different Hdac genes, Brd4, and Eed, may trigger epigenetic changes in these tumors.
Among the 87 CIS genes specifically identified in HDM201-resistant tumors, the most significant transposon-altered genes included those directly regulating the TP53 pathway, including Trp53 (50%), Mdm4 (31.9%), ΔN isoform of Trp63 (18.1%), and ΔN isoform of Trp73 (16%). Whereas Trp53 PB mutations were consistent with an inhibitory pattern of transposon insertions, the other genes displayed an insertional pattern consistent with gene overexpression that was confirmed on additional analyses. Although there is previous evidence that MDM4 expression reduces sensitivity to nutlin-3 MDM2 inhibitor (55), our present unbiased genetic screen has identified MDM4 overexpression as a mechanism of resistance to an MDM2 inhibitor. Thus, specific MDM4 antagonists may provide therapeutic benefits in cases where resistance occurs by MDM4 overexpression in wild-type TP53 tumors. ΔN isoforms of Trp73 and Trp63 are produced by an alternative promoter and lack the transactivation domain (47). They are suspected to exhibit proto-oncogenic function and TP53 dominant-negative functions. Our findings corroborate the latter hypothesis and suggest that resistance to TP53-MDM2 inhibition may occur in some cases through TP53 inhibition by these truncated isoforms. Interestingly, Bcl2l1 was the second most significant CIS gene enriched in HDM201-resistant tumors, after Trp53. Activating transposon insertions in these resistant samples led to enhanced BCL-xL protein expression. Further in vitro experiments demonstrated that BCL-xL increased expression conferred reduced sensitivity to TP53-MDM2 inhibition, whereas BCL-xL inactivation increased the response to TP53-MDM2 inhibition.
Overall, the identification of major resistant mechanisms, where the five most significant PB-targeted genes accounted for 63% of tumors, may help predict the future clinical course of patients treated with TP53-MDM2 inhibitors. In the majority of cases, in our present models, intertumor and intratumor heterogeneity of resistance mechanisms was observed. Although we cannot assess whether insertional intratumor heterogeneity arose from independent subclones, the results from independent allografted tumors passaged from the same original tumor model suggest that subclonal heterogeneity occurs. Heterogeneity of resistance mechanisms is consistent with a clonal adaptation that occurred in the course of an evolutionary process. Subclonal heterogeneity allows dynamic tumor adaption and is generally a key cause of treatment failure (56). To our knowledge, no therapy is available to counteract TP53 mutations or expression of ΔNTP63 and ΔNTP73; currently, only MDM4 (48) and BCL-xL (49, 50) can be targeted pharmacologically. Our in vitro assays demonstrate that BCL-xL inhibition sensitized cells to HDM201 inhibition. Upfront combination therapies with such agents (57) may provide a more promising therapeutic strategy for achieving complete killing of cancers.
Materials and Methods
Detailed information on the animal experiments, tumor sequencing, mapping of insertion sequences to the mouse genome and identification of common integration sites, Western blot analyses, and cell line combination synergy testing is provided in SI Materials and Methods. All animal studies were conducted in accordance with the Kantonales Veterinäramt Basel-Stadt (licenses BS-2604 and BS-1763) and in strict adherence to guidelines of the Eidgenössisches Tierschutzgesetz and the Eidgenössische Tierschutzverordnung, Switzerland.
SI Materials and Methods
Experimental Animals.
All animal studies were conducted in accordance with ethics and procedures covered by permit nos. BS-2604 and BS-1763 issued by the Kantonales Veterinäramt Basel-Stadt and in strict adherence to guidelines of the Eidgenössisches Tierschutzgesetz and the Eidgenössische Tierschutzverordnung, Switzerland. All mice had access to food and water ad libitum and were identified with transponders. The mice were housed in a specific pathogen-free facility with a 12-h light/12-h dark cycle. Conditional survival was defined as maximum estimated tumor diameter of 1.5 cm or when mice showed symptoms of morbidity/moribundity or body weight loss of >15%.
Generation of PiggyBac Tumors in Arf−/− Background.
The following genetic components were combined by crossing mice to obtain experimental animals heterozygous for RosaPB and ATP2-S1 and homozygous for Arf-deficient allele: RosaPB: CALB/SV129-Gt(ROSA)26Liutm1(ipb)Ww; ATP2-S1: CALB/FVB-TgTn(pb/sb-ATP2)S1Brd (15); Arf-deficient allele: FVB-Cdkn2atm1Nesh (21, 22). The ATP2-S1 mouse line carries 15 transposon copies inserted in chromosome 17 and contains a unidirectional MSCV (murine stem cell virus) promoter and gene traps (splice acceptors and PolyA) effective in both orientations. The PB transposase knock-in mouse, RosaPB [CALB/SV129-Gt(ROSA)26Liutm1(ipb)Ww], carried the PB transposase in the RosaPB locus (15). Animals were aged until tumors developed, after which masses were collected for pathology, DNA extraction, and/or s.c. reimplantation in athymic nude mice.
Generation of Allograft Tumor Models in Nude Mice.
Approximately 1–2 mm3 tissue fragments were implanted s.c. with 50% (vol/vol) Matrigel (354234; Corning) into the flank region of athymic nude (nu/nu) females (Harlan or Charles River Laboratories) mice using a trocar. Successfully engrafted tumor models were then passaged once and banked. Tumor material on flank was collected in PBS and kept on wet ice for engraftment within 3 h after resection, or slow-frozen. Necrotic and supporting tissues were carefully removed using a surgical blade. Immunodeficient models were used to prevent the tumor graft rejection because the experimental mice (RosaPB/+;ATP2/+;Arf−/−) were in a mixed genetic background.
Animal Treatments.
Treatment was initiated when the tumors engrafted in the flank were at least 150 mm3. Random enrollment was applied. Efficacy studies, tumor response, and relapse were reported with the measures of tumor volumes at the start of treatment. HDM201 was administered at 100 mg/kg in 0.5% methylcellulose and 0.1% Tween 80 orally twice a week, with alternating intervals of 3 d and 4 d. Vehicle was generated according to the formulation. Treatments were administered in the morning.
Collection of Spontaneous Tumors.
Full necropsy was performed after euthanasia, and all masses were collected. For each mass, a piece of tissue was flash-frozen and stored at −80 °C for PB profiling, another tissue fragment was fixed in 10% (vol/vol) neutral-buffered formalin and paraffin- embedded for histopathological analysis, and another fragment was slow-frozen in 50% (vol/vol) DMEM, 40% (vol/vol) tetracycline-free FCS, and 10% (vol/vol) DMSO and kept in liquid nitrogen as a viable fragment for reimplantation.
Histopathology and Immunohistochemistry.
Immediately after dissection, tumors were fixed in 10% (vol/vol) neutral buffered formalin for 24 h at room temperature, then rinsed in PBS, processed for dehydration, cleared, and embedded in paraffin. Then 3-µm sections were prepared and processed for H&E staining and immunohistochemistry. Immunohistochemical staining was performed in formalin-fixed, paraffin-embedded tissue sections using a BOND-MAX fully automated system (Leica Biosystems) for anti-CD45R (clone RA3-6B2; Serotec) and anti-vimentin (clone EPR3776; Epitomics) staining, and a Discovery XT fully automated system (Ventana Medical Systems) for anti-cytokeratin (clone AE1/AE3; Dako), anti-PAX5 (clone EP3730; Abcam), and anti-CD3 (clone SP7; Neomarkers) staining.
Splinkerette PCR for the Amplification of Transposon Integration Sites.
For PB sequencing, we adapted the splinkerette PCR protocol described previously (16). In brief, genomic DNA was isolated, sheared to fragment length of 200–600 bp on a Covaris sonicator. After end repair and A-tailing, purified DNA fragments were ligated to a splinkerette adaptor (obtained after annealing of 5′-gttcccatggtactactcatataatacgactcactataggtgacagcgagcgct-3′ and 5′-/5Phos/gcgctcgctgtcacctatagtgagtcgtattataatttttttttcaaaaaaa-3′). Transposon-containing fragments were enriched with 18 cycles of transposon-specific PCR for both the 5′ and 3′ transposon ends in separate libraries (5′-gatatacagaccgataaaacacatgcgtca-3′ for the 3′ arm of PB, 5′-gacggattcgcgctatttagaaagagag-3′ for the 5′ arm of PB, and common splinkerette primer 5′-gttcccatggtactactcata-3′). Bar coding of individual samples and completion of Illumina adaptor sequences were achieved with an additional 12 cycles of transposon-specific PCR and a custom array of 96 unique bar-coding primers. For the 3′ arm, we used 5′-XXXXXXXXacgcatgattatctttaacgtacgtcac-3′; for the 5′ arm, we used 5′-XXXXXXXXatgcgtcaattttacgcagactatc-3′; and for the splinkerette side, we used 5′-ACTGAATCtaatacgactcactatagg-3′ primers. The Xs represent the bar code made of 8 nucleotides. After size selection via magnetic bead purification (Beckman Ampure XP), libraries were pooled in two separate 5′ and 3′ pools and sequenced on the HiSeq Desktop Sequencer (Illumina).
Mapping of Insertion Sequences to the Mouse Genome and Identification of Common Integration Sites.
We aligned integration reads to the mm10 version of the mouse reference genome using bowtie2. We performed stringent query sequence filtering, requiring paired reads to start with the exact splinkerette primer sequence on the one side and the exact transposon primer sequence on the other side. We filtered the aligned reads for PCR duplicates by removing reads with the same start and end positions. Because the PB transposon requires a TTAA motif to insert itself in the genome, we also filtered out the reads that did not align to a TTAA motif in the mouse genome. Finally, we required reads from the 3′ and 5′ arms of PB to align exactly 4 bp (i.e., one TTAA) apart. The result of this stringent alignment procedure is a list of counts per sample and genomic position. Div counts were then normalized to account for unequal library sizes.
To identify genes that are commonly integrated, we adapted the gCIS strategy first described for Sleeping Beauty (26). In brief, we defined a gene-associated region as the gene transcription unit extended upstream by 10 kb of promoter sequence. For each gene-associated region, we counted the number of insertions (normalized div counts) and the number of TTAA motifs that fell inside and outside the region. We then performed a Fisher exact test on the resulting 2 × 2 contingency table. The gCIS method allows for the identification of genes in aggregates by adding normalized div counts for a pool of samples, as well as for a single sample, enabling the analysis of rare/difficult to obtain indications. Indeed, thanks to the stringent alignment procedure and the high number of PB integration sites identified in single samples, the gCIS method was verified to recover known cancer genes even in single-sample analyses. Our gCIS method allowed us to identify genes in aggregates by adding normalized div counts for a pool of samples, as well as for a single sample, enabling the analysis in single samples or a few samples.
Ontology and pathway analyses were performed with DAVID bioinformatics.
Clustering Analysis.
We performed hierarchical clustering on a (sample × gene) matrix of normalized div counts, using the hclust method in R statistical analysis software (https://www.R-project.org/) with the McQuitty linkage method and Euclidian distances. Among all linkage methods proposed by hclust, McQuitty had the greatest cophenetic correlation with the div count matrix, indicating a better fit to the data.
Differential Integration Analysis.
We performed differential integration analysis using the Bioconductor R package edgeR to identify integration sites likely to confer resistance to HDM201. To account for the fact that tumors were passaged from 16 primary tumors, we adopted an experimental design in which we blocked for the primary tumor. The div counts were normalized using edgeR’s TMM normalization method.
Pathway analysis was performed with DAVID bioinformatics.
Trp53 Gene Sequencing and Mutation Identification.
Trp53 mouse gene exons were amplified with Platinum PCR SuperMix High Fidelity (Life Technologies), using the following primers: exons 2 and 3: CCCTTTCCTATAAGCCATAGGGG and CAACACCAAAGCCCAAGTCC; exon 4: CTGAGGGTTCTTCTTTGTCCCA and AAGAGAGTTCCACGTCCCCT; exons 5 and 6: TAGTTCCCCACCTTGACACCT and CTGTCTCTAAGACGCACAAACC; exon 7: TGTAGTGAGGTAGGGAGCGA and CTGTTCCCAACCCCTCTTGT; exons 8 and 9: ACAAGAGGGGTTGGGAACAG and TGAGAACCACTGTCGGAGGA; exon 10: TGGTTGTGTGACCTTGTCCA and GGCTTCAAACTTCCCCAAATCC; exon 11: AGAAGTATTCCAGTGTGTTCTGTGA and TTGGGCCAGGAACCACTACT. These primers were tagged so that samples could be run in a multiplex manner on the Illumina MiSeq platform. Pooled samples were purified with AMPure XP beads (Beckman Coulter).
Western Blot Analysis.
Proteins were extracted from tumor powder using cold Giordano buffer containing phosphatase inhibitors (100×, P-0044 and P-5726; Sigma-Aldrich) and protease inhibitors (100×, P-8340; Sigma-Aldrich). Protein concentration was determined following the protocol of the Qubit Protein Assay Kit (Thermo Fisher Scientific). Here 50 μg of protein extract was separated by SDS/PAGE (Criterion XT Precast Gel, 4–12% Bis-Tris, 345-0124; Bio-Rad and XT MOPS blotting buffer, 161-0788; Bio-Rad) and transferred onto PVDF membranes (Immobilon-P, IPVH00010; EMD Millipore) using a wet transfer system (Trans-Blot Electrophoretic Transfer Cell, 1703930; Bio-Rad). Membranes were probed with antibodies [diluted in 5% (wt/vol) skim milk powder in PBS/Tween 20 plus 0.05% sodium azide] against vinculin (V91131; Sigma-Aldrich), p73 (Ab17230; Abcam), p63 (Ab63881; Abcam), Bcl-xL (54H6; Cell Signaling Technology), and Mdm4 (M0445; Sigma-Aldrich) overnight. The secondary antibody was HRP-conjugated anti-mouse IgG antibody (7076; Cell Signaling Technology) or HRP-conjugated anti-rabbit IgG antibody (7074; Cell Signaling Technology). Blots were revealed with ECL substrate (WesternBright ECL, K-12045-D20; Advansta) on a Fusion FX7 imager (Vilber).
Transfection of WWM226.4 Cells with Bcl-xL and HDM201 Treatments.
Human Bcl-xL cDNA was cloned into pcDNA-DEST40, and cells were transfected with FuGENE HD transfection reagent (Promega) with this construct or the corresponding control plasmid. The next day, cells were dispensed in 96-well plates, and 12–24 h later, the compound was added at indicated concentrations. The cell-compound mixtures were incubated for 72 h, after which a WST-1 cell proliferation assay (Roche) was performed.
Cell Line Combination Synergy Testing.
The in vitro combination screen was performed at Horizon Discovery (Cambridge, MA) on cancer cell lines, and data analysis was performed as described previously (9). Here we focused the data analysis on combinations with CGM097, a previous class of selective TP53-MDM2 inhibitors. A total of 485 cancer cell lines were treated with varying concentrations of CGM097 and for 25 other compounds. We integrated the information on TP53 mutation status and differentiated cell lines with no TP53 mutation from cell lines with TP53 alteration. We assessed the synergistic effect of combinations of HDM201 and A-1155463 as described previously (51).
Supplementary Material
Acknowledgments
We thank Allan Bradley for sharing the piggyBac mice and advice; Melanie Heinlein, Lea Buehler, Baptiste Gouyou, Heidi Poulet, and Fritz Wenger for helping with the mouse and histology experiments; Daniel Breustedt and team for breeding mice; Edward Oakeley, Ulrike Naumann, Moriko Ito, Sabine Zumstein-Mecker, and David Ruddy for optimizing and running the sequencing experiments; Pedro Marques Ramos and Michael Stadler for discussions and bioinformatics analyses; and Mark Stump for his contribution to the combination screen.
Footnotes
Conflict of interest statement: This research was funded by Novartis, Inc., which employed most of the authors at the time when the study was performed. A patent has been filed on “combinations of MDM2 and BCL-XL inhibitors.” The authors declare no other competing financial interests.
This article is a PNAS Direct Submission.
This article contains supporting information online at www.pnas.org/lookup/suppl/doi:10.1073/pnas.1620262114/-/DCSupplemental.
References
- 1.Hollstein M, et al. Database of p53 gene somatic mutations in human tumors and cell lines. Nucleic Acids Res. 1994;22(17):3551–3555. [PMC free article] [PubMed] [Google Scholar]
- 2.Ruas M, Peters G. The p16INK4a/CDKN2A tumor suppressor and its relatives. Biochim Biophys Acta. 1998;1378(2):F115–F177. doi: 10.1016/s0304-419x(98)00017-1. [DOI] [PubMed] [Google Scholar]
- 3.Serrano M, Hannon GJ, Beach D. A new regulatory motif in cell-cycle control causing specific inhibition of cyclin D/CDK4. Nature. 1993;366(6456):704–707. doi: 10.1038/366704a0. [DOI] [PubMed] [Google Scholar]
- 4.Sherr CJ. Divorcing ARF and p53: An unsettled case. Nat Rev Cancer. 2006;6(9):663–673. doi: 10.1038/nrc1954. [DOI] [PubMed] [Google Scholar]
- 5.Holzer P, et al. Discovery of a dihydroisoquinolinone derivative (NVP-CGM097): A highly potent and selective MDM2 inhibitor undergoing phase 1 clinical trials in p53wt tumors. J Med Chem. 2015;58(16):6348–6358. doi: 10.1021/acs.jmedchem.5b00810. [DOI] [PubMed] [Google Scholar]
- 6.Jeay S, et al. A distinct p53 target gene set predicts for response to the selective p53-HDM2 inhibitor NVP-CGM097. eLife. 2015;4:4. doi: 10.7554/eLife.06498. [DOI] [PMC free article] [PubMed] [Google Scholar]
- 7.Weisberg E, et al. Inhibition of wild-type p53-Expressing AML by the novel small molecule HDM2 inhibitor CGM097. Mol Cancer Ther. 2015;14(10):2249–2259. doi: 10.1158/1535-7163.MCT-15-0429. [DOI] [PMC free article] [PubMed] [Google Scholar]
- 8.Zhao Y, Aguilar A, Bernard D, Wang S. Small-molecule inhibitors of the MDM2-p53 protein–protein interaction (MDM2 inhibitors) in clinical trials for cancer treatment. J Med Chem. 2015;58(3):1038–1052. doi: 10.1021/jm501092z. [DOI] [PMC free article] [PubMed] [Google Scholar]
- 9.Gao H, et al. High-throughput screening using patient-derived tumor xenografts to predict clinical trial drug response. Nat Med. 2015;21(11):1318–1325. doi: 10.1038/nm.3954. [DOI] [PubMed] [Google Scholar]
- 10.Townsend EC, et al. The public repository of xenografts enables discovery and randomized phase ii-like trials in mice. Cancer Cell. 2016;29(4):574–586. doi: 10.1016/j.ccell.2016.03.008. [DOI] [PMC free article] [PubMed] [Google Scholar]
- 11.Hofmann F. Small molecule HDM2 inhibitor HDM201. Proceedings of the 107th Annual Meeting of the American Association for Cancer Research. Cancer Res. 2016;76(14) Suppl:6291. [Google Scholar]
- 12.Furet P, et al. Discovery of a novel class of highly potent inhibitors of the p53-MDM2 interaction by structure-based design starting from a conformational argument. Bioorg Med Chem Lett. 2016;26(19):4837–4841. doi: 10.1016/j.bmcl.2016.08.010. [DOI] [PubMed] [Google Scholar]
- 13.Copeland NG, Jenkins NA. Harnessing transposons for cancer gene discovery. Nat Rev Cancer. 2010;10(10):696–706. doi: 10.1038/nrc2916. [DOI] [PubMed] [Google Scholar]
- 14.Moriarity BS, Largaespada DA. Sleeping Beauty transposon insertional mutagenesis based mouse models for cancer gene discovery. Curr Opin Genet Dev. 2015;30:66–72. doi: 10.1016/j.gde.2015.04.007. [DOI] [PMC free article] [PubMed] [Google Scholar]
- 15.Rad R, et al. PiggyBac transposon mutagenesis: A tool for cancer gene discovery in mice. Science. 2010;330(6007):1104–1107. doi: 10.1126/science.1193004. [DOI] [PMC free article] [PubMed] [Google Scholar]
- 16.Rad R, et al. A conditional piggyBac transposition system for genetic screening in mice identifies oncogenic networks in pancreatic cancer. Nat Genet. 2015;47(1):47–56. doi: 10.1038/ng.3164. [DOI] [PubMed] [Google Scholar]
- 17.Chen L, et al. Transposon activation mutagenesis as a screening tool for identifying resistance to cancer therapeutics. BMC Cancer. 2013;13:93. doi: 10.1186/1471-2407-13-93. [DOI] [PMC free article] [PubMed] [Google Scholar]
- 18.Pandzic T, et al. Transposon mutagenesis reveals fludarabine-resistance mechanisms in chronic lymphocytic leukemia. Clin Cancer Res. 2016;22(24):6217–6227. doi: 10.1158/1078-0432.CCR-15-2903. [DOI] [PubMed] [Google Scholar]
- 19.Tsutsui M, et al. Comprehensive screening of genes resistant to an anticancer drug in esophageal squamous cell carcinoma. Int J Oncol. 2015;47(3):867–874. doi: 10.3892/ijo.2015.3085. [DOI] [PMC free article] [PubMed] [Google Scholar]
- 20.Perna D, et al. BRAF inhibitor resistance mediated by the AKT pathway in an oncogenic BRAF mouse melanoma model. Proc Natl Acad Sci USA. 2015;112(6):E536–E545. doi: 10.1073/pnas.1418163112. [DOI] [PMC free article] [PubMed] [Google Scholar]
- 21.Kamijo T, et al. Tumor suppression at the mouse INK4a locus mediated by the alternative reading frame product p19ARF. Cell. 1997;91(5):649–659. doi: 10.1016/s0092-8674(00)80452-3. [DOI] [PubMed] [Google Scholar]
- 22.Kamijo T, Bodner S, van de Kamp E, Randle DH, Sherr CJ. Tumor spectrum in ARF-deficient mice. Cancer Res. 1999;59(9):2217–2222. [PubMed] [Google Scholar]
- 23.Collier LS, Carlson CM, Ravimohan S, Dupuy AJ, Largaespada DA. Cancer gene discovery in solid tumours using transposon-based somatic mutagenesis in the mouse. Nature. 2005;436(7048):272–276. doi: 10.1038/nature03681. [DOI] [PubMed] [Google Scholar]
- 24.Friedrich MJ, et al. Genome-wide transposon screening and quantitative insertion site sequencing for cancer gene discovery in mice. Nat Protoc. 2017;12(2):289–309. doi: 10.1038/nprot.2016.164. [DOI] [PubMed] [Google Scholar]
- 25.Bard-Chapeau EA, et al. Transposon mutagenesis identifies genes driving hepatocellular carcinoma in a chronic hepatitis B mouse model. Nat Genet. 2014;46(1):24–32. doi: 10.1038/ng.2847. [DOI] [PMC free article] [PubMed] [Google Scholar]
- 26.Brett BT, et al. Novel molecular and computational methods improve the accuracy of insertion site analysis in Sleeping Beauty-induced tumors. PLoS One. 2011;6(9):e24668. doi: 10.1371/journal.pone.0024668. [DOI] [PMC free article] [PubMed] [Google Scholar]
- 27.Liang Q, Kong J, Stalker J, Bradley A. Chromosomal mobilization and reintegration of Sleeping Beauty and piggyBac transposons. Genesis. 2009;47(6):404–408. doi: 10.1002/dvg.20508. [DOI] [PubMed] [Google Scholar]
- 28.Jones DT, et al. Tandem duplication producing a novel oncogenic BRAF fusion gene defines the majority of pilocytic astrocytomas. Cancer Res. 2008;68(21):8673–8677. doi: 10.1158/0008-5472.CAN-08-2097. [DOI] [PMC free article] [PubMed] [Google Scholar]
- 29.Chen SH, et al. Oncogenic BRAF deletions that function as homodimers and are sensitive to inhibition by RAF dimer inhibitor LY3009120. Cancer Discov. 2016;6(3):300–15. doi: 10.1158/2159-8290.CD-15-0896. [DOI] [PubMed] [Google Scholar]
- 30.Lin A, et al. BRAF alterations in primary glial and glioneuronal neoplasms of the central nervous system with identification of 2 novel KIAA1549:BRAF fusion variants. J Neuropathol Exp Neurol. 2012;71(1):66–72. doi: 10.1097/NEN.0b013e31823f2cb0. [DOI] [PMC free article] [PubMed] [Google Scholar]
- 31.Palanisamy N, et al. Rearrangements of the RAF kinase pathway in prostate cancer, gastric cancer and melanoma. Nat Med. 2010;16(7):793–798. doi: 10.1038/nm.2166. [DOI] [PMC free article] [PubMed] [Google Scholar]
- 32.Ramkissoon LA, et al. Genomic analysis of diffuse pediatric low-grade gliomas identifies recurrent oncogenic truncating rearrangements in the transcription factor MYBL1. Proc Natl Acad Sci USA. 2013;110(20):8188–8193. doi: 10.1073/pnas.1300252110. [DOI] [PMC free article] [PubMed] [Google Scholar]
- 33.Ren G, et al. Identification of frequent BRAF copy number gain and alterations of RAF genes in Chinese prostate cancer. Genes Chromosomes Cancer. 2012;51(11):1014–1023. doi: 10.1002/gcc.21984. [DOI] [PubMed] [Google Scholar]
- 34.Schindler G, et al. Analysis of BRAF V600E mutation in 1,320 nervous system tumors reveals high mutation frequencies in pleomorphic xanthoastrocytoma, ganglioglioma and extra-cerebellar pilocytic astrocytoma. Acta Neuropathol. 2011;121(3):397–405. doi: 10.1007/s00401-011-0802-6. [DOI] [PubMed] [Google Scholar]
- 35.Lee W, et al. PRC2 is recurrently inactivated through EED or SUZ12 loss in malignant peripheral nerve sheath tumors. Nat Genet. 2014;46(11):1227–1232. doi: 10.1038/ng.3095. [DOI] [PMC free article] [PubMed] [Google Scholar]
- 36.Jones DT, et al. Dissecting the genomic complexity underlying medulloblastoma. Nature. 2012;488(7409):100–105. doi: 10.1038/nature11284. [DOI] [PMC free article] [PubMed] [Google Scholar]
- 37.Pugh TJ, et al. Medulloblastoma exome sequencing uncovers subtype-specific somatic mutations. Nature. 2012;488(7409):106–110. doi: 10.1038/nature11329. [DOI] [PMC free article] [PubMed] [Google Scholar]
- 38.Robinson G, et al. Novel mutations target distinct subgroups of medulloblastoma. Nature. 2012;488(7409):43–48. doi: 10.1038/nature11213. [DOI] [PMC free article] [PubMed] [Google Scholar]
- 39.Genovesi LA, et al. Sleeping Beauty mutagenesis in a mouse medulloblastoma model defines networks that discriminate between human molecular subgroups. Proc Natl Acad Sci USA. 2013;110(46):E4325–E4334. doi: 10.1073/pnas.1318639110. [DOI] [PMC free article] [PubMed] [Google Scholar]
- 40.Hoffman-Luca CG, et al. Significant differences in the development of acquired resistance to the MDM2 inhibitor SAR405838 between in vitro and in vivo drug treatment. PLoS One. 2015;10(6):e0128807. doi: 10.1371/journal.pone.0128807. [DOI] [PMC free article] [PubMed] [Google Scholar]
- 41.Hoffman-Luca CG, et al. Elucidation of acquired resistance to Bcl-2 and MDM2 inhibitors in acute leukemia in vitro and in vivo. Clin Cancer Res. 2015;21(11):2558–2568. doi: 10.1158/1078-0432.CCR-14-2506. [DOI] [PMC free article] [PubMed] [Google Scholar]
- 42.Wanzel M, et al. CRISPR-Cas9-based target validation for p53-reactivating model compounds. Nat Chem Biol. 2016;12(1):22–28. doi: 10.1038/nchembio.1965. [DOI] [PMC free article] [PubMed] [Google Scholar]
- 43.Amaral JD, Xavier JM, Steer CJ, Rodrigues CM. The role of p53 in apoptosis. Discov Med. 2010;9(45):145–152. [PubMed] [Google Scholar]
- 44.Green DR, Kroemer G. Cytoplasmic functions of the tumour suppressor p53. Nature. 2009;458(7242):1127–1130. doi: 10.1038/nature07986. [DOI] [PMC free article] [PubMed] [Google Scholar]
- 45.Pant V, Lozano G. Limiting the power of p53 through the ubiquitin proteasome pathway. Genes Dev. 2014;28(16):1739–1751. doi: 10.1101/gad.247452.114. [DOI] [PMC free article] [PubMed] [Google Scholar]
- 46.Wade M, Li YC, Wahl GM. MDM2, MDMX and p53 in oncogenesis and cancer therapy. Nat Rev Cancer. 2013;13(2):83–96. doi: 10.1038/nrc3430. [DOI] [PMC free article] [PubMed] [Google Scholar]
- 47.Wei J, Zaika E, Zaika A. p53 Family: Role of protein isoforms in human cancer. J Nucleic Acids. 2012;2012:687359. doi: 10.1155/2012/687359. [DOI] [PMC free article] [PubMed] [Google Scholar]
- 48.Zak K, et al. Mdm2 and MdmX inhibitors for the treatment of cancer: A patent review (2011-present) Expert Opin Ther Pat. 2013;23(4):425–448. doi: 10.1517/13543776.2013.765405. [DOI] [PubMed] [Google Scholar]
- 49.Tse C, et al. ABT-263: A potent and orally bioavailable Bcl-2 family inhibitor. Cancer Res. 2008;68(9):3421–3428. doi: 10.1158/0008-5472.CAN-07-5836. [DOI] [PubMed] [Google Scholar]
- 50.Leverson JD, et al. Exploiting selective BCL-2 family inhibitors to dissect cell survival dependencies and define improved strategies for cancer therapy. Sci Transl Med. 2015;7(279):279ra40. doi: 10.1126/scitranslmed.aaa4642. [DOI] [PubMed] [Google Scholar]
- 51.Lehár J, et al. Synergistic drug combinations tend to improve therapeutically relevant selectivity. Nat Biotechnol. 2009;27(7):659–666. doi: 10.1038/nbt.1549. [DOI] [PMC free article] [PubMed] [Google Scholar]
- 52.Alexandrov LB, et al. Australian Pancreatic Cancer Genome Initiative; ICGC Breast Cancer Consortium; ICGC MMML-Seq Consortium; ICGC PedBrain Signatures of mutational processes in human cancer. Nature. 2013;500(7463):415–421. doi: 10.1038/nature12477. [DOI] [PMC free article] [PubMed] [Google Scholar]
- 53.Lange SS, Takata K, Wood RD. DNA polymerases and cancer. Nat Rev Cancer. 2011;11(2):96–110. doi: 10.1038/nrc2998. [DOI] [PMC free article] [PubMed] [Google Scholar]
- 54.Wood RD, Mitchell M, Lindahl T. Human DNA repair genes, 2005. Mutat Res. 2005;577(1-2):275–283. doi: 10.1016/j.mrfmmm.2005.03.007. [DOI] [PubMed] [Google Scholar]
- 55.Patton JT, et al. Levels of HdmX expression dictate the sensitivity of normal and transformed cells to Nutlin-3. Cancer Res. 2006;66(6):3169–3176. doi: 10.1158/0008-5472.CAN-05-3832. [DOI] [PubMed] [Google Scholar]
- 56.Lipinski KA, et al. Cancer evolution and the limits of predictability in precision cancer medicine. Trends Cancer. 2016;2(1):49–63. doi: 10.1016/j.trecan.2015.11.003. [DOI] [PMC free article] [PubMed] [Google Scholar]
- 57.Horn T, et al. High-order drug combinations are required to effectively kill colorectal cancer cells. Cancer Res. 2016;76(23):6950–6963. doi: 10.1158/0008-5472.CAN-15-3425. [DOI] [PubMed] [Google Scholar]
Associated Data
This section collects any data citations, data availability statements, or supplementary materials included in this article.


