Significance
Human γδ T lymphocytes have innate-like and adaptive-like functions and can circulate in blood or reside in tissues. They are activated by specific antigens recognized by their T-cell receptor and recognize infected and transformed cells, suggesting that cellular stress is involved in specific antigen expression. However, molecular characterization of stress-induced antigens remains elusive, hampering our understanding of the role of γδ T cells in cancer and infections. In the present study we identify annexin A2 as such stress-induced antigen known as a phospholipid-binding protein involved in tumorigenesis, redox potential regulation, and wound healing. Stress-mediated membrane exposure of annexin A2 could thus constitute a danger signal for γδ T cells to recognize various cell dysregulations and protect the host against cancer and infections.
Keywords: gamma-delta T cells, innate-like lymphocytes, cell stress surveillance, tumor immunology, cytomegalovirus
Abstract
Human γδ T cells comprise a first line of defense through T-cell receptor (TCR) recognition of stressed cells. However, the molecular determinants and stress pathways involved in this recognition are largely unknown. Here we show that exposure of tumor cells to various stress situations led to tumor cell recognition by a Vγ8Vδ3 TCR. Using a strategy that we previously developed to identify antigenic ligands of γδ TCRs, annexin A2 was identified as the direct ligand of Vγ8Vδ3 TCR, and was found to be expressed on tumor cells upon the stress situations tested in a reactive oxygen species-dependent manner. Moreover, purified annexin A2 was able to stimulate the proliferation of a Vδ2neg γδ T-cell subset within peripheral blood mononuclear cells and other annexin A2-specific Vδ2neg γδ T-cell clones could be derived from peripheral blood mononuclear cells. We thus propose membrane exposure of annexin A2 as an oxidative stress signal for some Vδ2neg γδ T cells that could be involved in an adaptive stress surveillance.
It is well established that one of the major roles of conventional αβ-T lymphocytes is to protect the host against microorganisms. The molecular cornerstone of this function is the recognition by their antigen receptor of microbial moieties presented in the context of classic MHC molecules (1). In contrast, γδ T lymphocytes do not recognize peptides presented by classic MHC molecules and are biased against self-reactive recognition. Consistent with the Ig-like structure of γδ T-cell receptors (TCRs) (2) and the diversity of their repertoire, the self-antigens so far described to be directly recognized by γδ TCRs are structurally highly diverse, including MHC-related or unrelated molecules (for recent reviews, see refs. 3 and 4). Intriguingly, most of those self-antigens are constitutively expressed on cells and healthy tissues, implying mechanisms to control the γδ T-cell response in appropriate situations and avoid autoimmunity. Some of these mechanisms have been described, such as increased self-antigen expression upon cell activation (e.g., T10/T22 in mice) (5), dependence of recognition on a multimolecular stress signature in CMV-infected cells and tumor cells [endothelial protein C receptor (EPCR)] (6), presentation of—or conformational modification by—metabolites [CD1d (7, 8) and BTN3A1 (9–11)], and ectopic localization in tumor cells (F1-ATPase/ApoI) (12).
Although the pathophysiological contexts associated with the expression of these self-antigens in the appropriate environment or conformation leading to γδ T-cell response remains elusive for most of them, the contribution of γδ T cells to host protection is thought to rely on recognition of cell dysregulation. The so-called lymphoid stress surveillance response has been described as rapid, weakly specific, and resulting from activation of large numbers of preactivated or preprogrammed γδ T cells without necessary clonal expansion (13). Stress surveillance by γδ T cells is considered important for tissue repair (14), rapid local containment of microbes or tumors (15–17), and activation of downstream conventional immune responses (18).
Given their implication in the control of tumors and infections, understanding the molecular basis of stress surveillance by γδ T cells could have important impacts on their use in immunotherapy. Such understanding has been hindered by the limited characterization of bona fide stress-induced antigens recognized by γδ TCRs and of the stress pathways leading to the expression of these antigens. The objective of the present study was to provide novel insights into these issues. We focused on Vδ2neg γδ T-cell clones isolated from healthy donors previously shown to react against a broad panel of B-cell lymphoma in an Ig-like transcript (ILT)-2–dependent pathway (19). We elucidate herein the antigenic specificity of one of these clones as being annexin A2, a molecule expressed on the cell surface in response to oxidative stress and able to activate a subset of Vδ2neg γδ T cells.
Results
Expression of 73R9 Ligand by U373MG Glioblastoma Cell Line.
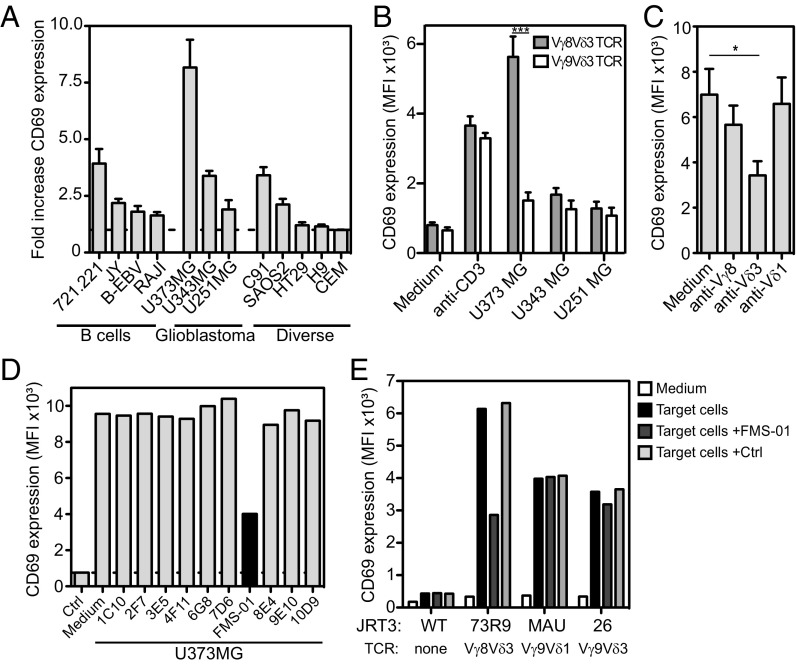
We focused on the Vγ8Vδ3 T-cell clone (73R9) that was reactive against transformed B cells (19). HLA-I engagement on 73R9 by ILT-2 expressed on B cells was previously shown to stimulate clone cytolytic function (19). However, the role of the TCR in 73R9 recognition of B cells remained unclear. To address this issue we transduced the 73R9 TCR into the TCR-deficient human JRT3 T-cell, producing the JRT3-73R9 reporter cell line. Unexpectedly, when assayed against transformed B-cell lines the activation of JRT3-73R9 was markedly low (Fig. 1A), except against the 721.221 cell line. Among 42 other tumor cell lines tested, only the U373MG glioblastoma cell line induced a strong JRT3-73R9 cell activation, which was TCR-specific because it was not observed with other Vδ3 TCRs and inhibited by blocking anti-Vδ3 chain mAb (Fig. 1 A–C). Two other glioblastoma cell lines (U343MG and U251MG) also weakly induced JRT3-73R9 cell activation (Fig. 1A). Taken together, our results suggested that, by contrast to transformed B cells, the U373MG cell line expressed an antigen specifically recognized by the 73R9 TCR.
Fig. 1.
FMS-01 mAb inhibits 73R9 TCR-mediated recognition of U373MG. (A) CD69 expression by JRT3-73R9 cocultured 4 h with different target cells. Results shown are fold-increase of CD69 mean fluourescence intensity (MFI) in the presence of target cells versus in medium alone (horizontal dotted line). CEM, cell line donor’s initials. (B) CD69 expression by JRT3-73R9 (Vγ8Vδ3 TCR) and JRT3-26 (Vγ9Vδ3 TCR) cocultured 4 h with glioblastoma cells or with anti-CD3 mAb. (C) CD69 expression by JRT3-73R9 incubated with U373MG and with or without anti-Vγ8, anti-Vδ3, or anti-Vδ1 mAbs. In A–C bars represent the mean ± SEM of at least three independent experiments and Mann–Whitney test was used to compare conditions (*P < 0.05, ***P < 0.001). (D) CD69 expression by JRT3-73R9 incubated alone (Ctrl) or with U373MG cells in the presence or absence of a selection of hybridoma supernatants. (E) CD69 expression by JRT3 reporter cells expressing no TCR (JRT3 WT) or indicated Vδ2neg γδ TCRs, cultured in medium alone or with their own target cells (U373MG, HT29, SKW6.4). Supernatant of FMS-01 or control hybridoma (25% of culture volume) were added in indicated conditions. Data are representative of at least three independent experiments.
Generation of a mAb Specifically Blocking 73R9 TCR Reactivity.
To characterize 73R9 TCR antigenic ligand, we generated a specific blocking monoclonal antibody using the strategy we previously described (6). Mice were immunized with U373MG and B-cell hybridoma supernatants screened for their ability to decrease JRT3-73R9 reactivity against U373MG. Such a hybridoma was selected and cloned to produce a mAb called FMS-01 (Fig. 1D). Inhibition by FMS-01 was not observed for other γδ TCRs (Fig. 1E). Among glioblastoma, U373MG was the cell line constitutively expressing the most important level of antigen labeled by FMS-01 mAb (Fig. S1A) in accordance with JRT3-73R9 reactivity (Fig. 1A). We concluded that FMS-01 competed with 73R9 TCR and most likely recognized the same antigen.
Fig. S1.
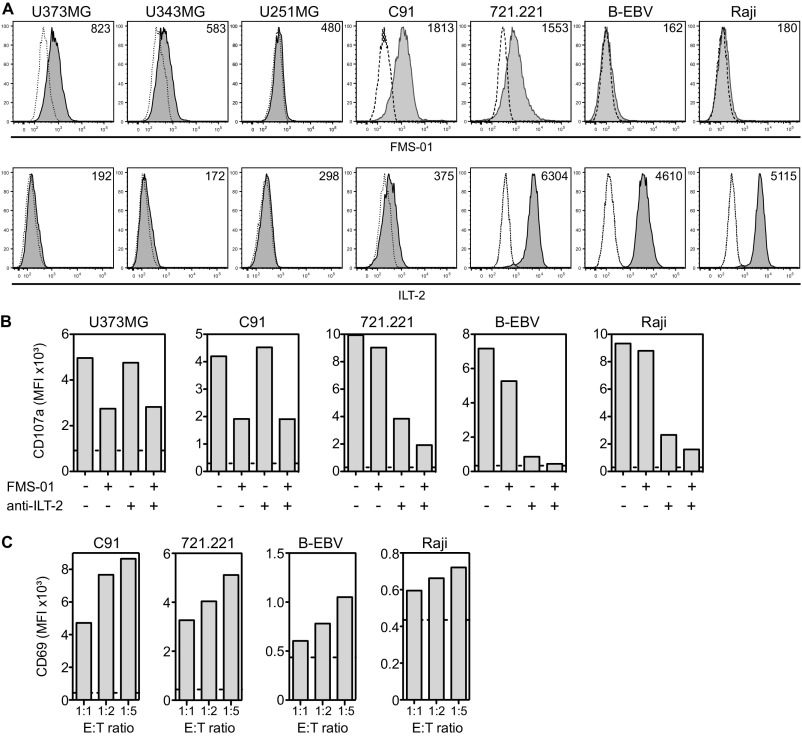
Comparative expression and contribution to clone 73R9 reactivity of FMS-01 antigen and anti–ILT-2. (A) Cell surface expression of FMS-01 antigen and ILT-2 on different tumor cell lines analyzed by flow cytometry (gray histograms). PE-conjugated goat anti-mouse IgM stained cells were used as negative controls (dotted-line histograms). MFI values are indicated. (B) CD107a expression on clone 73R9 after 4 h of culture with indicated tumor cell lines in the presence or not of FMS-01 hybridoma supernatant (25% of culture volume) or anti–ILT-2 mAb (10 µg/mL). Value of CD107a expression by the clone incubated in medium alone is represented as horizontal dotted line. (C) CD69 expression by JRT3-73R9 incubated with C91, 721.221, B-EBV, and Raji cell lines at the indicated E:T ratio. Value of CD69 expression by the JRT3-73R9 incubated in medium alone is represented as horizontal dotted line. Data are representative of at least three independent experiments.
In agreement with the discrepancy between the results obtained with JRT3-73R9 versus clone 73R9 on B-cell recognition, B lymphoma cells were found to express very low levels of FMS-01 antigen, except for 721.221 cells, compared with glioblastoma and C91 T-lymphoma cells (Fig. S1A). Conversely, B-cell lines expressed a high level of ILT-2, whereas C91 and glioblastoma cells did not (Fig. S1A). Accordingly, anti–ILT-2 mAb, but not FMS-01 mAb, inhibited activation of 73R9 by B cells, and inversed results were obtained when using C91 or U373MG cells (Fig. S1B). A slight additive effect of combining both mAbs on B-cell recognition suggested a low-grade 73R9 TCR engagement by B cells (Fig. S1B), which was consistent with up-regulated B-cell–mediated activation of JRT3-73R9 when increasing the B-cell:JRT3-73R9 ratio (Fig. S1C). Taken together, these results indicated that the same γδ T-cell clone can use TCR-dependent or -independent pathways to respond to different target cells.
CMV-Induced 73R9 TCR Activation Through Up-Regulation of FMS-01 Ligand Expression.
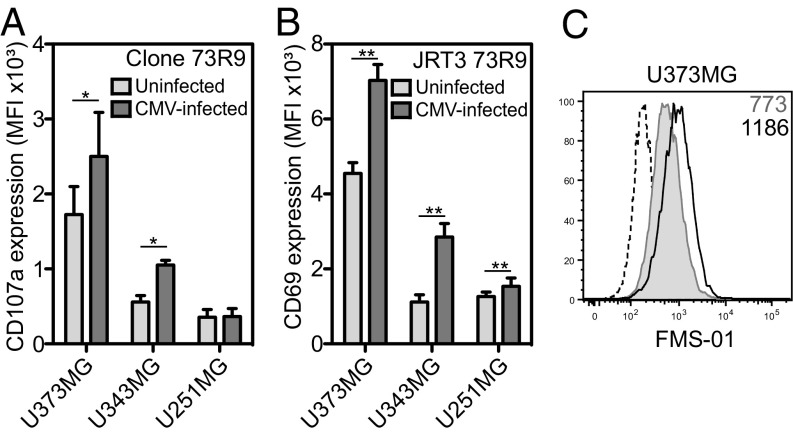
Our previous studies demonstrated that some Vδ2neg γδ T cells exhibit dual TCR-dependent reactivity against tumor cell lines and CMV-infected cells (20). In accordance with this finding, CMV infection of U373MG and U343MG—but not that of U251MG—significantly up-regulated 73R9 activation (Fig. 2A). This effect of CMV was TCR-dependent because it was also observed when using JRT3-73R9 (Fig. 2B), because it was inhibited by FMS-01 mAb (Fig. S2A) and associated to increased FMS-01 ligand expression on U373MG (Fig. 2C). These results supported the hypothesis that CMV-induced stress in host cells increased antigenic ligand expression and subsequent TCR-mediated activation of γδ T cells.
Fig. 2.
CMV infection of glioblastoma cells enhances 73R9 TCR reactivity and FMS-01 expression. Activation of clone 73R9 (A) or JRT3-73R9 (B) by coculture with CMV-infected or uninfected glioblastoma cells. (C) Cell surface staining of CMV-infected (black line) and uninfected (gray histogram) U373MG with FMS-01, or with GAM IgM (dotted line). Results are mean ± SEM (A and B) or representative (C) of at least three experiments. Statistical significance was tested using the Willcoxon test, *P < 0.05 and **P < 0.005.
Fig. S2.
CMV infection, high confluence, and heat shock enhance FMS-01 expression and 73R9 TCR reactivity. (A) JRT3-73R9 activation by CMV-infected or uninfected U373MG with or without FMS-01 and/or control IgM. (B and C) U343MG monolayers were harvested at 60% (low) or 100% (high) of confluence before counting and incubation with JRT3-73R9. (D and E) U343MG monolayers were harvested and exposed to 42 °C heat-shock stress from 5 to 120 min before incubation with JRT3-73R9. (B and D) CD107a expression by clone 73R9 was evaluated after coculture at 1:1 ratio for 4 h with pretreated U343MG cells, in the absence or presence of FMS-01 mAb. (C and E) Staining of stressed cells with FMS-01 mAb. PE-conjugated goat anti-mouse IgM-stained cells were used as controls (dotted line). Results are representative of at least three independent experiments.
Different Cell Stress Conditions Trigger 73R9 TCR Reactivity.
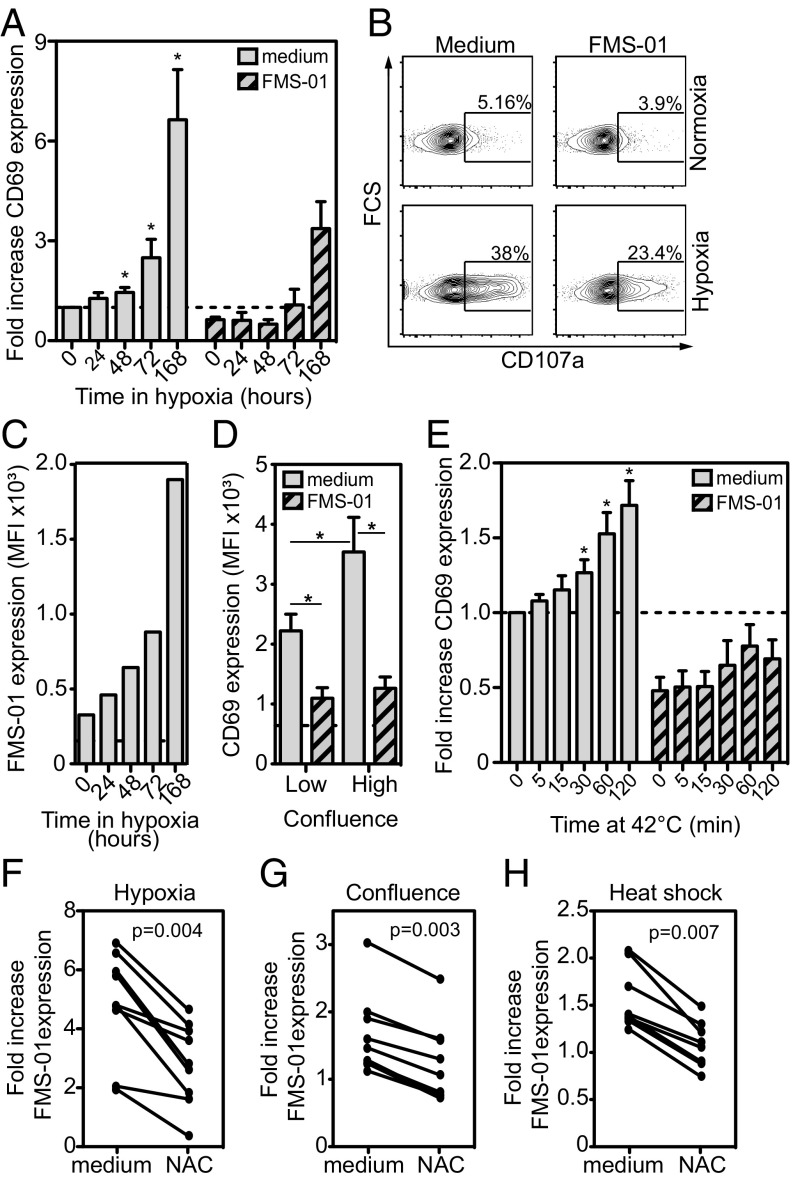
We then investigated other conditions of cellular stress that could modulate target cell recognition by γδ T cells. First, preincubation of U343MG in hypoxia (0.1% O2) induced both JRT3-73R9 and 73R9 clone reactivity compared with preincubation in normoxia (Fig. 3 A and B) (all activation assays were done at 21% O2, 37 °C, and with the same number of target cells). JRT3 transduced with other γδ TCRs did not respond to hypoxia-treated glioblastoma cells. Hypoxia-induced JRT3-73R9 and 73R9 clone activation was inhibited by FMS-01 mAb (Fig. 3 A and B) and associated to increased FMS-01 ligand expression on U373MG cells (Fig. 3C), suggesting γδ TCR-mediated stress sensing. Similar results were obtained when U343MG were pre-exposed to high confluence (Fig. 3D and Fig. S2 B and C) or to heat shock (Fig. 3E and Fig. S2 D and E), and when using U373MG or U251MG. TCR 73R9 activation always consistently correlated with FMS-01 staining on the target cell surface for each of these stress conditions (Table S1). Oxydative burst could be a common trigger to induce FMS-01 ligand expression because treating glioblastoma cells with the free radical scavenger N-acetyl-l-cysteine (NAC) during stress exposure partially inhibited the increased FMS-01 ligand expression by all stress conditions tested on the three glioblastoma cell lines (Fig. 3 F–H). In conclusion, different cell-stress conditions enhance γδ TCR-mediated sensing of target cells through an increased expression of membrane ligand, which is at least partially dependent on reactive oxygen species (ROS) production.
Fig. 3.
Stress stimulation of glioblastoma cells increases FMS-01 expression and 73R9 TCR reactivity. (A–C) U343MG monolayers were cultured from 24 h to 168 h in 0.1% O2 atmosphere, then detached, counted, and stained or incubated with T cells in normoxia. (D) U343MG monolayers were harvested at 60% (low confluence) or 100% (high confluence) of confluence before counting and incubation with JRT3-73R9. (E) U343MG cells were exposed to 42 °C from 5 to 120 min before incubation with JRT3-73R9. CD69 expression by JRT3-73R9 (A, D, E) or CD107a expression by clone 73R9 (B) were evaluated after coculture at 1:1 ratio for 4 h with pretreated U343MG cells, in the absence or presence of FMS-01 mAb. In A and E results are shown as fold-increase of CD69 MFI compared with negative control MFI (JRT3 in medium alone, horizontal dotted line). In B numbers indicate the percentage of cells in the gate. (C) Staining of stressed cells with FMS-01. Goat anti-mouse IgM-stained cells were used as controls (dotted line). Results represent the mean ± SEM (A and E) or are representative (B) of at least three independent experiments (*P < 0.05). (F–H) U373MG, U343MG, and U251MG cells were incubated for 5 d in hypoxia (F), at high confluence (G) or for 120 min at 42 °C heat (H). Cells were preincubated or not with 10 mM of NAC prior stress induction or cell detachment and FMS-01 surface expression was evaluated. Results of different experiments are shown as FMS-01 MFI fold-increase upon stress.
Table S1.
JRT3-73R9 activation is correlated with FMS-01 expression during glioblastoma cellular stress
| Spearman coefficient and P value | High confluence | Heat shock | Hypoxia |
| Spearman correlation coefficient | 0.701 | 0.423 | 0.709 |
| P value | <0.0001 | 0.0002 | <0.0001 |
Identification of Annexin A2 as the Ligand for FMS-01 mAb.
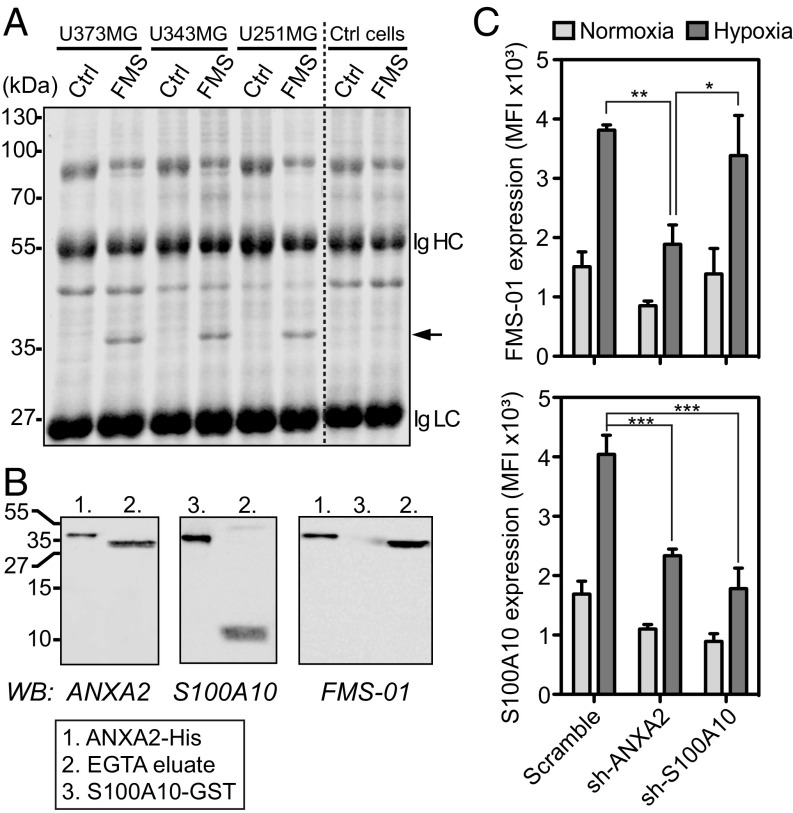
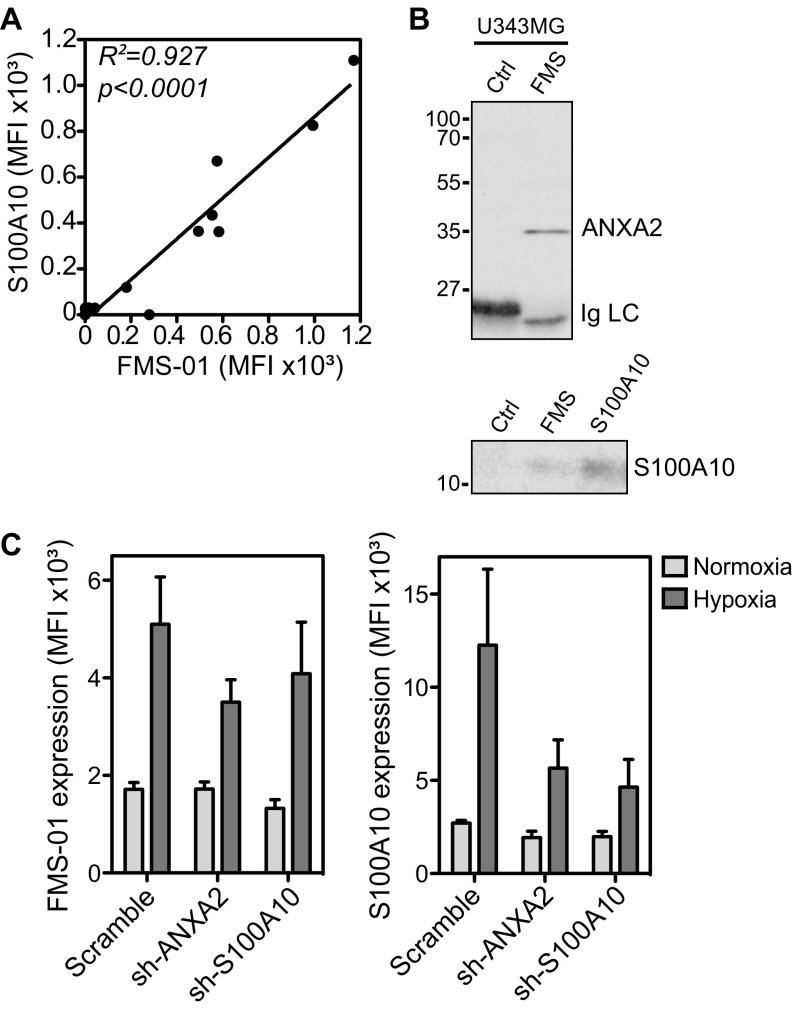
The nature of the membrane moiety bound by FMS-01 was then identified through immunoprecipitation. FMS-01 specifically immunoprecipitated a protein of ∼35 kDa from all glioblastoma cell lysates but not from a FMS-01− control cell line (Fig. 4A). Proteins contained within the specific ∼35-kDa band were digested with trypsin and analyzed by Fourier transform-ion-cyclotron resonance mass spectrometry. This process identified annexin A2, a 35-kDa intracellular protein known to bind anionic phospholipids in a Ca2+-dependent manner, and to translocate to the cell surface as a heterotetrameric complex with the 11-kDa protein S100A10 (21). In line with this finding, FMS-01 staining strongly correlated with S100A10 expression in different cell types (Fig. S3A). Moreover, proteins immunoprecipitated with FMS-01 mAb were also detected with anti-annexin A2 and anti-S100A10 mAbs by Western blots (Fig. S3B). Western blots using recombinant forms of both proteins, or U373MG EGTA eluates containing annexin A2/S100A10 complex from the cell surface, as previously shown (21), demonstrated that FMS-01 bound annexin A2 only (Fig. 4B). Finally, down-regulation of annexin A2 or S100A10 expression in glioblastoma cell lines using specific sh-RNA showed that surface staining by FMS-01 was dependent on annexin A2 expression but independent of S100A10 expression (Fig. 4C and Fig. S3C).
Fig. 4.
FMS-01 recognizes annexin A2. (A) Colloidal blue-stained SDS/PAGE of proteins immunoprecipitated with control IgM (Ctrl) or FMS-01 mAb (FMS) from glioblastoma or FMS-01− cells (Ctrl cells). Black arrow indicates the specific band. Heavy (Ig HC) and light chains (Ig LC) of antibodies used for immunoprecipitation are indicated. (B) Immunoblot analysis of EGTA eluates from U373MG, recombinant annexin 2 (His-tagged), and recombinant S100A10 (GST-tagged), detected with anti-annexin 2 mAb (Left), anti-S100A10 mAb (Center), or FMS-01 mAb (Right). Data are representative of at least two independent experiments. (C) Expression of FMS-01 ligand (Upper) and S100A10 (Lower) by U373MG transduced with scramble, annexin A2 (ANXA2), or S100A10 sh-RNAs and treated in normoxia or hypoxia. Data are represented as mean ± SEM of three independent experiments and two-way ANOVA test was used to compare conditions (*P < 0.05, **P < 0.005, ***P < 0.001).
Fig. S3.
FMS-01 mAb recognizes annexin A2 on U343MG cells. (A) Linear regression analysis of S100A10 surface staining according to FMS-01 surface staining on different cell lines individually represented as dots. (B) Immunoblot analysis of U343MG cell proteins immunoprecipitated with control IgM (Ctrl), FMS-01 (FMS), or anti-S100A10 mAb, and detected with a commercial mAb to annexin A2 (Upper) or to S100A10 (Lower). Data are representative of at least two independent experiments. (C) Expression of FMS-01 ligand (Left) and S100A10 (Right) by U343MG cells transduced with scramble, annexin A2 (ANXA2), or S100A10 sh-RNAs and treated in normoxia or hypoxia. Data are represented as mean ± SEM of three independent experiments.
Annexin A2 Is Recognized by the 73R9 TCR.
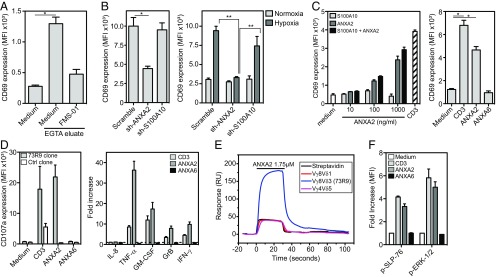
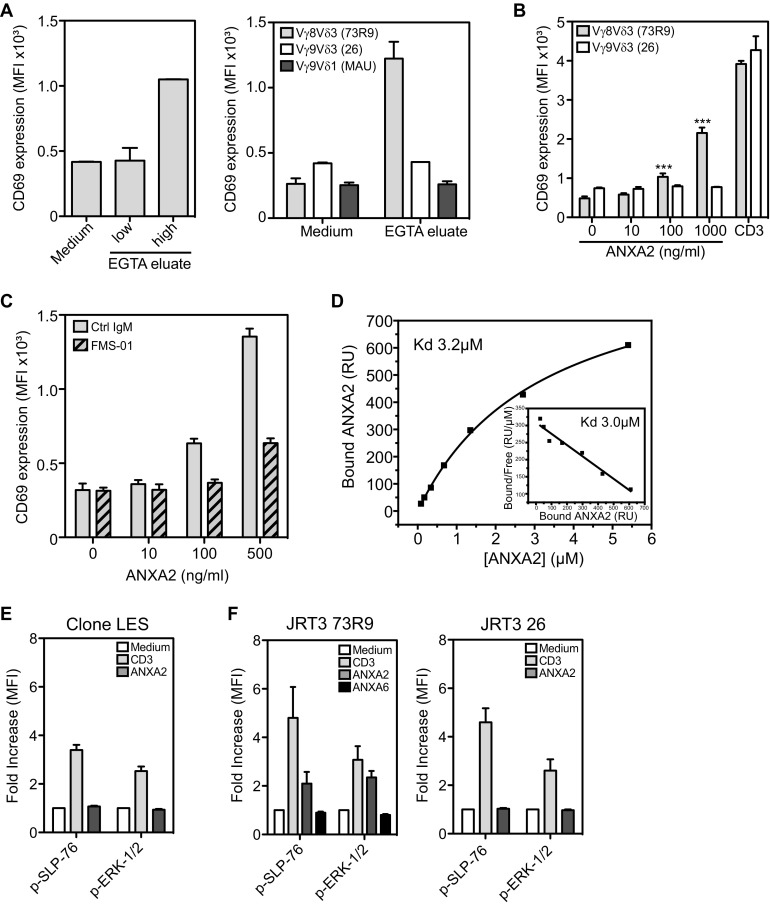
FMS-01 ligand was expected to be 73R9 TCR ligand, it was then important to ensure that 73R9 TCR recognized annexin A2. EGTA membrane eluates from U373MG cells cultured at high confluence were able to activate JRT3-73R9, but not other TCR-transductants, in an annexin A2-dependent manner, in contrast to eluates generated from cells cultured at low confluence (Fig. 5A and Fig. S4A). Annexin A2 was mandatory for recognition of glioblastoma cells by JRT3-73R9 because down-regulation of its expression by RNA interference abrogated JRT3-73R9 activation, whereas down-regulation of S100A10 had no effect (Fig. 5B). Remarkably, recombinant soluble annexin A2 alone, but not recombinant S100A10, was able to activate very efficiently JRT3-73R9 (Fig. 5C, Left). Activation was not observed when using annexin A6 (Fig. 5C, Right) or another TCR-transductant (Fig. S4B), and was inhibited in the presence of the FMS-01 mAb (Fig. S4C). Moreover, soluble annexin A2 was at least as efficient as anti-CD3 mAb to activate the 73R9 clone (Fig. 5D). Finally, annexin A2 but not A6 was able to induce multiple functions on the clone such as cytotoxicity (assessed by CD107a expression and granzyme B production) but also TNF-α, IFN-γ, and GM-CSF secretion (Fig. 5D).
Fig. 5.
73R9 TCR recognizes annexin A2 CD69 expression by JRT3-73R9 incubated: (A) with or without EGTA eluates from highly confluent U373MG cells with or without FMS-01 mAb; (B) with U373 (Left) or U343 (Right) transduced with scramble, annexin A2 (ANXA2), or S100A10 sh-RNAs and pretreated in normoxia or hypoxia; (C) with or without increasing doses of recombinant soluble annexin A2 and/or S100A10 (Left), with anti-CD3 mAb, or with soluble annexin A6 (Right). (D) Clone 73R9 was activated with anti-CD3 mAb, soluble annexin A2 or A6, and CD107a membrane expression after 4 h (Left) or indicated cytokine secretion after 24 h (Right) were evaluated by flow cytometry. (E) Binding of annexin A2 (1.75 µM) to biotinylated 73R9 TCR or two control TCRs immobilized on streptavidin-coated flow cells at 2,153 RU, 2,175 RU, and 2,748 RU, respectively, or streptavidin alone, assessed by SPR and presented as resonance units (RU). (F) Detection of phosphorylated SLP-76 and ERK-1/2 in clone 73R9 incubated in the indicated conditions. All of the results are from at least three independent experiments and are shown as mean ± SEM (*P < 0.05, **P < 0.005).
Fig. S4.
Annexin A2, but not S100A10, is recognized by TCR 73R9. (A, Left) JRT3-73R9 was incubated with or without EGTA eluates from U373MG cells grown at low or high confluence. (Right) JRT3-73R9 (Vγ8Vδ3 TCR), JRT3 26 (Vγ9Vδ3 TCR), and JRT3 MAU (Vγ9Vδ1 TCR) were incubated with or without EGTA eluates from highly confluent U373MG cells. (B) JRT3-73R9 and JRT3 26 were incubated or not with increasing doses of recombinant annexin A2 or with anti-CD3. (C) JRT3-73R9 was incubated with or without increasing doses of annexin A2 in the presence or not of FMS-01 mAb. (D) Equilibrium affinity analysis of annexin A2 binding to the 73R9 TCR (Kd = 3.2 µM). (Inset) Scatchard plot of the same data (Kd = 3.0 µM). (E and F) Detection of phosphorylated SLP-76 and ERK-1/2 in clone LES (E), JRT3 73R9 (F, Left) and JRT3 26 (Right) incubated for 1 min in the indicated conditions. All of the results are shown as mean ± SEM of at least two independent experiments.
Molecular interaction between annexin A2 and the 73R9 TCR was then confirmed by surface plasmon resonance (SPR). We observed greater responses when recombinant annexin A2 was injected over immobilized 73R9 TCR compared with control TCRs or streptavidin alone, indicating specific binding (Fig. 5E). Equilibrium binding analyses yielded an apparent dissociation constant (Kd) of ∼3 μM (Fig. S4D). No specific binding of annexin A6 was observed to 73R9 TCR compared with control TCR. Annexin A2 was not only binding but also signaling through the TCR because ERK 1/2 and SLP76 phosphorylation was induced in the 73R9 clone (Fig. 5F)—but not control clone (Fig. S4E)—as well as in the JRT3-73R9, but not in a control transductant (Fig. S4F). Taken together, these results provide evidence that the 73R9 TCR directly recognizes annexin A2 independently of S100A10. Annexin A2 translocation to the cell surface represents a unified stress signal recognized by this TCR.
Annexin A2 Induces the Proliferation of a Vδ2neg γδ T-cell Subset.
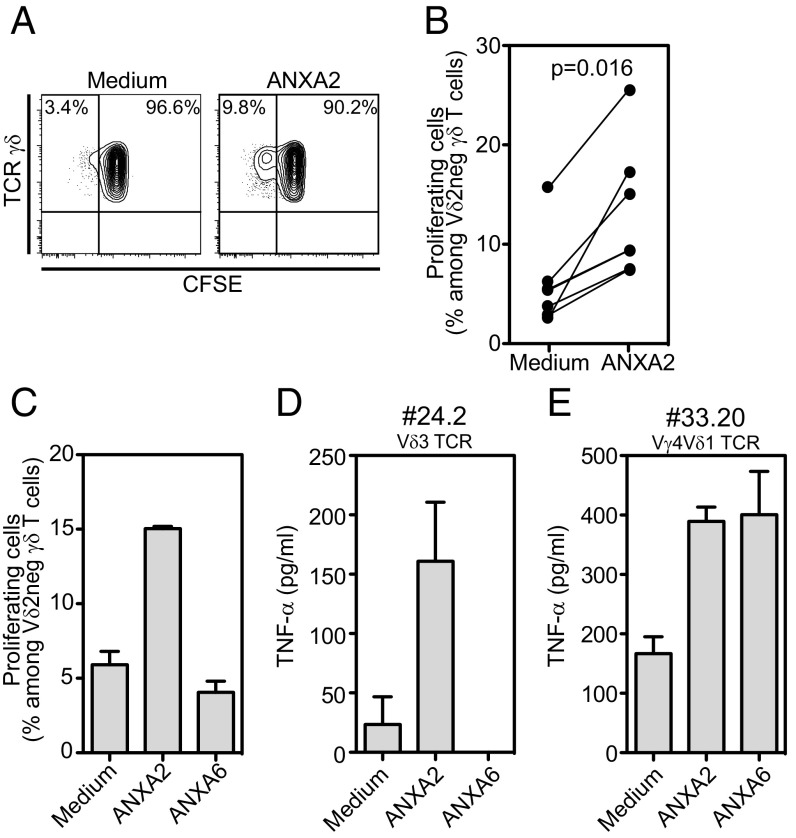
Finally, we tested the effect of annexin A2 on Vδ2neg γδ T cells isolated from the blood of healthy donors. When cocultured with autologous peripheral blood mononuclear cells (PBMC), a small population of proliferating Vδ2neg γδ T cells appeared in the presence of annexin A2 plus IL-2 compared with IL-2 alone (Fig. 6A). Results obtained from seven different donors are shown in Fig. 6B, indicating statistically significant increase of proliferating Vδ2neg γδ T cells with annexin A2. Annexin A6 had no effect (Fig. 6C), in agreement with the results obtained with JRT3 73R9 activation and SPR. This finding prompted us to try to derive new annexin A2-specific Vδ2neg γδ T-cell clones. From 72 Vδ2neg γδ T-cell clones expanded polyclonally from three different healthy donors, two clones were able to react to annexin A2. Interestingly, one of them also reacted to annexin A6, suggesting the recognition by this clone of a region shared by both annexins. One clone (no. 24.2) expressed a Vδ3 TCR (and neither Vγ4, Vγ8, nor Vγ9), and the other one (no. 33.20) expressed a Vγ4Vδ1 TCR. These results indicate that annexin A2 specificity is not restricted to the 73R9 TCR or to Vγ8Vδ3 TCRs.
Fig. 6.
Annexin A2 stimulates Vδ2neg γδ T-cell proliferation. (A–C) CFSE [5-(and 6)-carboxyfluorescein diacetate succinimidyl ester] labeled Vδ2neg γδ T cells were cocultured with autologous PBMC in the presence of recombinant IL-2 with or without annexin A2 for 5 d. Results are presented as percentages of CFSE-low cells among Vδ2neg γδ T cells. (A) Representative dot-plot of flow cytometry staining, (B) percentages of proliferating Vδ2neg γδ T cells from independent donors (n = 7), and (C) comparison of annexin A2 and annexin A6 effects. (D) TNF-α production by two T-cell clones isolated from healthy donors and incubated for 24 h with soluble annexins A2 or A6. Results from C–E are mean ± SEM of at least two independent experiments.
Discussion
Because they are able to react to infected, activated, or transformed cells, and are involved in host response to diverse situations of stress, γδ T cells are considered to be important players in lymphoid stress surveillance. However, the nature of the cellular dysregulation events that they respond to and the specific molecular stress stimuli that trigger their activation remain poorly understood. In particular, identification of the molecular signals associated with these dysregulations and specifically recognized by the γδ TCR is still limited. As a contribution to this knowledge, we characterized annexin A2 translocation to the cell surface as a common molecular stress signal recognized by a Vγ8Vδ3 TCR.
The Vγ8Vδ3 γδ T-cell clone 73R9 used in this study is representative of a panel of Vδ2neg γδ T cells previously described to recognize a large panel of B-lymphoma cell lines through an atypical ILT-2/HLA axis (19). We show here that stressed glioblastoma cells can also activate clone 73R9. Interestingly, different molecular mechanisms mediated recognition of distinct target cells. γδ T-cell HLA molecules recognize ILT-2 on B-lymphoma cells and the Vγ8Vδ3 TCR is not (or weakly) involved in this process. In contrast, the TCR recognizes annexin A2 on glioblastoma cells and ILT-2 is not involved. The same γδ T cells can thus recognize different types of cellular dysregulation through distinct molecular pathways, making them able to integrate several and potentially separate contextual signals in order for them to enlarge their functional diversity and responses to different situations.
Here, we identify annexin A2 as the antigen targeted by FMS-01 mAb that specifically inhibited Vγ8Vδ3 TCR-mediated recognition of glioblastoma cells. Together with the observation that purified annexin A2 was able to activate the Vγ8Vδ3 TCR specifically, this result demonstrates that annexin A2 is critical for Vγ8Vδ3 TCR-dependent recognition of target cells. Annexin A2 belongs to the evolutionary ancient family of Ca2+-regulated phospholipid-binding annexin proteins (22). Annexin A2 is present in the cytoplasm, and is associated with intracellular membranes of different organelles and with the internal or extracellular face of plasma membrane. It participates in a variety of membrane-related functions (endocytosis, exocytosis, membrane repair) in response to diverse cellular fluctuations, including Ca2+ influx, pH variation, membrane phospholipid composition, and its own posttranslational modification. It can exist as a monomer or as heterotetrameric complexes with the S100A10 protein, which enhances its membrane phospholipid binding affinity. In our hands, the highest expression of annexin A2 observed at the cell surface was achieved by placing cells under hypoxia, probably because it combines both membrane translocation and an increase in annexin A2 gene expression, which has been shown to be dependent on HIF-1 (23). Cellular reoxygenation after hypoxia is followed by ROS burst, and inhibiting ROS production using antioxidant NAC decreased stress-induced annexin A2 surface expression. Oxidative stress could thus be a common pathway leading to annexin A2 membrane translocation and γδ T-cell activation because NAC also decreased heat shock and high confluence-induced annexin A2 expression.
Several features of annexin A2 fulfill what we can expect from a canonical ligand of a Vδ2neg γδ TCR. First, annexin A2 is overexpressed in many cancer cells, including glioblastoma, where it correlates positively with histologic grade and central nervous system dissemination (24). Second, despite the absence of a transmembrane domain, intracellular annexin A2 can swiftly translocate to cell surface upon stress signals (25) in agreement with the increase of FMS-01 binding on glioblastoma cells treated for only 30 min at 42 °C. In endothelial cells, annexin A2 translocation is obtained, in vitro but also in vivo, within minutes in response to heat stress, thrombin exposure, or hypoxia and relies on annexin A2 phosphorylation (21–23). Third, consistent with γδ T-cell responses to tissue injury (26) annexin A2 plays a role in membrane repair and wound healing (27), which is supposedly because of an intracellular rise in Ca2+ upon membrane damage (28). Fourth, in agreement with 73R9 TCR recognition of CMV-infected cells, CMV-infection has been shown to induce annexin A2 phosphorylation, which is necessary for translocation to cell surface, for binding to CMV and to further enhance CMV infection (29).
Annexin A2 appears to represent a bona fide stress antigen expressed on the cell surface only upon cellular dysregulation, and able to alert γδ T cells, such as 73R9, 24.2, or 33.20 γδ T cells. Annexin A2-specific γδ T cells could thus contribute to lymphoid stress surveillance, a property that has rather been so far attributed to innate-like invariant γδ T cells (13). The diversity and low frequency of annexin A2-specific γδ T cells that we describe in this study suggest that response to annexin A2 may rather represent an adaptive response requiring clonal expansion in specific situations. This “adaptive stress surveillance” would probably be less immediately efficient than the massive response of invariant subsets but could be more rapid than a conventional αβ–T-cell response because of conceivably taking place within stressed tissues.
Annexins and S100 molecules have been previously classified among alarmins (30) because of their ability to induce inflammatory patterns in endothelial cells and macrophages. Annexin A2 could be considered as a γδ T-cell alarmin, acting either through cell–cell contact or as soluble form because annexin A2 can be released in the extracellular microenvironment (31). It is tempting to imagine that soluble annexin A2 could alert distant specific γδ T cells and stimulate their proliferation. However, the affinity of annexins for membrane phospholipids suggests that even when produced in soluble form, annexin A2 probably rapidly binds to proximal cell membranes and act in a membrane-bound fashion. Our results showing an induction of Vδ2neg γδ T-cell proliferation by soluble annexin A2 should foster further investigations to evaluate the interest of this antigen in immunotherapeutic settings aiming at stimulating γδ T-cell control of cancer or infections.
Materials and Methods
For further details, SI Materials and Methods.
Generation of Effector Cells.
Human γδ T clone 73R9 (expressing a TCR Vγ8Vδ3) was obtained as previously described in ref. 19. Reporter cells expressing TCR 73R9 (JRT3-73R9) were generated as previously described (6) by cotransduction with viral particles expressing a Vγ8 TCR chain and particles expressing Vδ3 TCR chain. Amino acid sequences of the Vδ3-Dδ3-Jδ1 and Vγ8-Jγ2 junctional regions of 73R9 TCR are CAFTGLGDTSHADKLIF and CATWDSSKLFGSGTTLVVT, respectively.
Functional Assays with Stressed Cells.
Activation of JRT3 transduced with γδ TCRs by tumor cell lines at 1:1 [effector cell:tumor cell (E:T)] ratio was measured by expression of CD69 by flow cytometry. Activation of clone 73R9 was analyzed using CD107a mobilization assay or cytokine production. TCR signaling was also analyzed by flow cytometry. In some experiments, tumor cells were infected with CMV clinical strain TB40/E for 4 d. Correct infection of the cells was confirmed by cytopathic effect observation. For hypoxic stress, tumor cells were grown in 21% or 0.1% oxygen atmosphere and were released, counted, and stained in normoxia. For heat-shock assay, cell lines were grown for 48 h, then detached and incubated at 42 °C or 37 °C for the indicated times. For all assays, target cells were washed twice before incubation with effector cells in a 1:1 ratio, or before staining with specific mAbs. In some experiments, glioblastoma cell lines were preincubated for 1 h with 10 mM NAC pH-adjusted solution, before stress induction (heat-shock) or cell detachment.
Generation of FMS-01 mAb.
BALB/c mice were immunized with U373MG and hybridomas generated as previously described (6). Hybridomas that secreted antibody able to inhibit JRT3-73R9 reactivity against U373MG were cloned by limiting dilution, ending with selection of FMS-01 mAb because of its robust neutralizing activity. The experimental protocol was approved by Animal Care and Use Committee Board of Bordeaux (No. 50120124-A).
SI Materials and Methods
Generation of γδ T Clone 73R9.
Human γδ T clone 73R9 (expressing a TCR Vγ8Vδ3) was obtained as previously described in Harly et al. (19). Clone 73R9 was expanded in culture in complete RPMI medium [2 mM l-glutamine, 10 µg/mL streptomycin, and 100 IU/mL penicillin (Gibco)] supplemented with 10% (vol/vol) human serum, 1,000 U/mL rIL-2 (Chiron), 1 µg/mL purified leuco-agglutinin (Sigma-Aldrich), and irradiated allogeneic feeder cells (35 Gy).
Generation of Reporter Cells Expressing TCR 73R9 (JRT3-73R9).
JRT3-73R9 was generated as previously described (6). Briefly, cDNA encoding Vγ8 and Vδ9 TCR chains of clone 73R9 was amplified by RT-PCR and cloned into the lentiviral vector TEEW in which cDNA was under the control of the promoter EF1a. Lentivrial particles were produced by transient transfection of packaging 293 T HEK cells, as described previously (32). Viral titers were determined by ELISA of viral protein p24. All this was done in the lentiviral vector production facility of TBM Core (CNRS UMS 3427, INSERM US5, Bordeaux University). J.RT3-T3.5 cells (American Type Culture Collection), called JRT3 elsewhere in the paper, were cotransduced with lentiviral particles expressing the Vγ8 TCR chain and particles expressing the Vδ3 TCR chain. After 24 h of viral infection, cells were washed and productively transduced cells were sorted by flow cytometry (FACSAria). JRT3 was similarly transduced with other γδ TCRs which were used as controls in experiments.
JRT3 Functional Assays.
JRT3 transduced with γδ TCRs (JRT3-TCR, 5 × 10⁴ cells per well) were stained with Cell Trace CFSE (1 µM; ThermoFisher) and incubated with tumor cell lines at 1:1 (E:T) ratio. In some experiments unlabeled JRT3-TCR were incubated with EGTA eluates from glioblastoma cells (see below), or with several recombinant proteins [recombinant human S100A10, annexin A2, and annexin A6 (ProSpec)].
After 4-h incubation at 37 °C, activation of JRT3 cells was measured by expression of CD69. Cells were stained with PE-conjugated anti-CD69 mAb (Beckman Coulter). FACS data were acquired using a LSR Fortessa (BD Biosciences). Flow cytometry analyses were performed using Diva (BD Biosciences) and FlowJo 9.3.2 (TreeStar) softwares (flow cytometry facility of TBM Core).
Generation of FMS-01 mAb.
The experimental protocol was approved by the Animal Care and Use Committee board of Bordeaux (no. 50120124-A). For the generation of FMS-01 mAb, U373MG cells (12 × 106 cells in 50 μL PBS) were injected without adjuvant into each footpad of the back legs of BALB/c mice (n = 4). Then, 10 d later, mice were boosted in the same conditions, and at day 14, popliteal lymph nodes were collected and B cells were extracted and fused with the mouse myeloma partner P3U1 at 1:1 ratio. To this purpose hybridomas were grown until confluent and their supernatants assessed for neutralization of JRT3-73R9 reactivity. Hybridoma supernatants (50 μL) were added to 96-well U-bottomed plates containing U373MG cells (5 × 10⁴ cells per well). After 30 min of incubation at room temperature, CFSE+ JRT3-73R9 cells were added (5 × 10⁴ cells per well) and plates were incubated for 4 h at 37 °C. Cells were then stained by PE-conjugated anti-CD69 mAb and analyses were carried out by flow cytometry. Hybridomas that secreted antibody able to decrease or abrogate the reactivity of the JRT3-73R9 cells were cloned by limiting dilution, ending with selection of FMS-01 mAb because of his robust neutralizing activity.
Clone 73R9 Functional Assay.
Cytotoxic activity of clone 73R9 was analyzed using CD107a mobilization assay. T cells were cocultured with tumor cell lines at a 1:1 (E:T) ratio, in the presence of PE-conjugated anti-CD107a mAb (BD Biosciences) and monensin (5 nM; Sigma). In some experiments clone 73R9 was stimulated with recombinant protein annexin A2 or annexin A6, both at a final concentration of 1 µg/mL (ProSpec). The expression of CD107a marker at the cell surface was analyzed by flow cytometry after 6 h of coculture. In some experiments, the following antibodies were added to the culture: anti-Vγ9, anti-Vδ3, anti-Vδ1 mAbs (all from Beckman Coulter), anti–ILT-2 mAb (Biolegend), FMS-01 mAb, all used at a final concentration of 10 μg/mL. Secretion of IL-8, TNF-α, GM-CSF, Granzyme B, and IFN-γ was assessed by Cytometric Bead Array (BD Bioscience) following the manufacturer’s instructions.
Immunoprecipitation.
U373MG, U343MG, and U251MG cells and control cells negative for FMS-01 staining were washed twice with PBS before lysis for 30 min on ice in lysis buffer [50 mM Tris, pH 7.4, 150 mM NaCl, 0.5% Triton X-100 and complete protease inhibitor “mixture” (Roche)]. Insoluble materials were removed by centrifugation at 24,500 × g for 15 min. Soluble lysates have been precleared twice for 1 h then once for 15 h at 4 °C with anti-IgM beads (Sigma). FMS-01 or control mAbs were complexed overnight with anti-IgM beads, then precleared lysates were immunoprecipitated for 12 h with FMS-01 coupled to anti-IgM beads. Immunoprecipitates were washed three times in lysis buffer, and once in 500 mM NaCl buffer; then were separated by SDS/PAGE on 15% (wt/vol) gels under reducing condition before detection with Colloidal Blue staining.
Sample Preparation and Protein Digestion.
After Colloidal Blue staining, bands of interest were cut in 1-mm × 1-mm gel pieces. Gel pieces were destained in 25 mM ammonium bicarbonate 50% (vol/vol) acetonitrile (ACN), rinsed twice in ultrapure water and shrunk in ACN for 10 min. Proteins were first reduced in 10 mM DTT, 100 mM NH4HCO3 for 30 min at 56 °C, then alkylated in 100 mM iodoacetamide, 100 mM NH4HCO3 for 30 min at room temperature and shrunk in ACN for 10 min. After ACN removal, gel pieces were rehydrated with 100 mM NH4HCO3 for 10 min at room temperature and shrunk again in ACN. After ACN removal, gel pieces were dried at room temperature, covered with the trypsin solution [10 ng/µL in 40 mM NH4HCO3 and 10% (vol/vol) ACN], rehydrated at 4 °C for 10 min, and finally incubated overnight at 37 °C. Gel pieces were incubated for 15 min in 40 mM NH4HCO3 and 10% (vol/vol) ACN at room temperature. The supernatant was collected, and an H2O/ACN/HCOOH (47.5:47.5:5) extraction solution was added onto gel slices for 15 min. The extraction step was repeated twice. Supernatants were pooled and dried in a vacuum centrifuge. Finally, the samples were suspended in 30 µL H2O/HCOOH (100:0.1).
nLC-MS/MS Analysis.
Peptide mixture was analyzed on an Ultimate 3000 nanoLC system (Dionex) coupled to a nanospray LTQ-Orbitrap XL mass spectrometer (ThermoFinnigan). Ten microliters of peptide digests were loaded onto a 300-µm inner diameter × 5-mm C18 PepMap trap column (LC Packings) at a flow rate of 20 µL/min. The peptides were eluted from the trap column onto an analytical 75-mm id × 15-cm C18 Pep-Map column (LC Packings) with a 2–40% linear gradient of solvent B in 48 min [solvent A was 0.1% formic acid in 5% (vol/vol) ACN, and solvent B was 0.1% formic acid in 80% (vol/vol) ACN]. The separation flow rate was set at 200 nL/min. The mass spectrometer operated in positive ion mode at a 1.8-kV needle voltage and a 36-V capillary voltage. Data were acquired in a data-dependent mode. MS scans (m/z 300–1700) were recorded at a resolution of R = 60 000 (at m/z 400) and an AGC target of 5 × 10⁵ ions collected within 500 ms. Dynamic exclusion was set to 30 s and the top six ions were selected from fragmentation in CID mode. MS/MS scans with a target value of 1 × 10⁴ ions were collected with a maximum fill time of 200 ms.
Database Search and Results Processing.
Data were searched by SEQUEST through Proteome Discoverer 1.4 (Thermo Fisher Scientific) against a subset of the 2013.08 version of UniProt database restricted to the Human Reference Proteome Set (69,135 entries). Spectra from peptides higher than 5,000 Da or lower than 350 Da were rejected. The search parameters were as follows: mass accuracy of the monoisotopic peptide precursor and peptide fragments was set to 10 ppm and 0.6 Da, respectively. Only b- and y-ions were considered for mass calculation. Oxidation of methionines (+16 Da) and carbamidomethylation of cysteines (+57 Da) were considered as variable modifications. Two missed trypsin cleavages were allowed. Peptide validation was performed using the Percolator algorithm (33) and only “high-confidence” peptides were retained corresponding to a 1% false-positive rate at the peptide level.
Label-Free Quantitative Data Analysis.
Raw LC-MS/MS data were imported in Progenesis LC-MS 4.1 (Nonlinear Dynamics). Data processing includes the following steps: (i) features detection, (ii) features alignment across the six samples, (iii) volume integration for two to six charge-state ions, (iv) normalization on total protein abundance, (v) import of sequence information, (vi) ANOVA test at peptide level and filtering for features P < 0.05, (vii) calculation of protein abundance (sum of the volume of corresponding peptides), (viii) ANOVA test at protein level and filtering for features P < 0.05. Noticeably, only nonconflicting features and unique peptides were considered for calculation at protein level. Quantitative data were considered for proteins quantified by a minimum of two peptides.
EGTA Eluates and Western Blots.
Confluent U373MG cells were washed twice with ice-cold HBS buffer (11 mM Hepes, 137 mM NaCl, 4 mM KCl, 3 mM CaCl2, 1 mM MgCl2, 1 mM glucose) pH = 7.4, then treated with HBS 10 mM EGTA for 30 min at 4 °C (2 mL/75cm2 flask). Eluates were collected and centrifuged 20 min at 2,000 × g. Supernatants were concentrated with Centricon filter devices with 10-kDa membrane cut-off. Eluates were kept at −80 °C before used for Western blots or functional assays.
For the immunoblot experiments, either immunoprecipitated proteins or EGTA eluates were electrophoretically separated by SDS/PAGE on 15% (wt/vol) gels in reducing conditions, and transferred onto nitrocellulose membrane (Biotrace NT) by semidry transfer. The membranes were stained with Ponceau red and saturated with 5% BSA in TBS-T buffer (192 mM glycine, 25 mM Tris, 0.1% SDS, 0.005% Tween 20, pH 7.9). Immunoblots were performed with anti-annexin A2, anti-S100A10 (both purchased from BD transduction) (1/5,000 dilution) or FMS-01 (hybridoma supernatant), and with an IRDye 800CW labeled anti-mouse IgG or IgM antibodies (Licor Science Tech) at a 1/10,000 dilution in TBS-T. Then, the luminescence signal was visualized with the Odyssey Infrared Imaging system (Licor).
Down-Regulation of Annexin A2 and S100A10 Expression Using shRNA.
Lentiviral particles expressing three different shRNA against annexin A2 or against S100A10 and one scramble shRNA were obtained from Santa-Cruz. U373MG and U343MG cells were transduced with each of these seven different shRNA separately. Transduced cells were selected with puromycin and checked for down-regulation of annexin A2 or S100A10 intracellular expression by flow cytometry. The cells displaying the lowest expression for each protein were used to assess ability to translocate annexin A2 or S100A10 at cell surface or to activate JRT3-73R9.
Expression of Soluble TCR and Binding Studies.
Soluble TCRs were generated by fusion of cDNA encoding the 73R9 Vγ8- or Vδ 3-chains to acid or base zipper sequences in pMT-BiP-V5-HisB (Life Technologies) and cotransfection in Drosophila melanogaster S2 cells. Heterodimeric γδ TCRs were purified with nickel–nitrilotriacetic acid agarose (Qiagen) and biotinylated with BirA for binding studies. SPR binding studies were carried out as described previously (6) using a BIAcore 3000 and streptavidin-coated CM5 chips in HBS-P (10 mM Hepes, pH 7.4, 150 mM NaCl, and 0.005% surfactant P20; GE Healthcare) including 5 mM CaCl2. Equilibrium affinity measurements involved injection of annexin A2 [ProSpec; supplied by the manufacturer at 0.5 mg/mL in 20 mM Tris pH 8, 100 mM NaCl, 20% (vol/vol) glycerol], annexin A6 [ProSpec; supplied at 0.5 mg/mL in 20 mM Tris pH 8.0, 100 mM NaCl, 10% (vol/vol) glycerol], or serial dilutions of these stocks in HBS-P/5mM CaCl2. For Fig. S4D, annexin A2 protein was dialyzed into HBS-P to reduce the background signal resulting from glycerol.
TCR Signaling Pathway Analysis.
Phosphorylation of TCR signaling pathway proteins was assessed by intracellular flow cytometry, using BD Phosflow reagents (BD Biosciences). Briefly, clones 73R9 or LES and JRT3 73R9 or 26 were stimulated with recombinant annexin A2 or annexin A6 (ProsPec) at 5 µg/mL, or anti-CD3 (clone UCHT1) at 10 µg/mL for 1 min at 37 °C. Cells were immediately fixed with prewarmed BD Cytofix Fixation Buffer (BD Biosciences) for 10 min at 37 °C. Cells were washed in staining buffer (PBS–1% BSA) and permeabilized with cold BD Phosflow Perm Buffer III (BD Biosciences) for 30 min at 4 °C. After extensive washes, cells were incubated for 1 h at room temperature with the following antibodies: Alexa-Fluor 488 mouse anti-ERK 1/2 (pT202/pY204) and Alexa Fluor 647 mouse anti-SLP-76 (pY128) (all from BD Biosciences). Data were acquired by flow cytometry using a LSR Fortessa (BD Bioscience) instrument.
Vδ2neg γδ T-cell Isolation.
PBMC were isolated from leukocyte-reduced blood filters obtained from healthy donors by density gradient separation using Lymphocytes separation medium (Eurobio). Leukocyte-reduced blood filters were provided by the Etablissement Français du Sang, Bordeaux. Vδ2neg γδ T cells were isolated by magnetic-activated cell sorting (MACS) using a TCR γδ+ T-cell negative isolation kit, anti-FITC Microbeads (Miltenyi Biotec), and anti-Vδ2 FITC (Beckman Coulter), following the manufacturer’s instructions.
Proliferation Assay.
Vδ2neg γδ T cells (5 × 10⁴) were labeled with Cell Trace CFSE (1.5 µM) before their coculture with autologous PBMC (25 × 104) in a 48-well plate for 5 d, in the presence or absence of recombinant human IL-2 (40 U/mL) (Sigma Aldrich) or recombinant annexin A2 or annexin A6 (1 µg/mL). Following this period, the cells were harvested and Vδ2neg γδ T-cell proliferation was quantified as CFSE fluorescence using a LSR Fortessa flow cytometer. Proliferating Vδ2neg γδ T cells were gated using anti–CD3-BV421/450 and anti-γδ TCR APC antibodies (both from BD Biosciences).
Generation of Annexin A2-Specific Vδ2neg γδ T-cell Clones.
Immuno-magnetically sorted Vδ2neg γδ T cells were cloned by limiting dilution and activated in the presence of PHA, irradiated PBMC feeders, and IL-2 for 2 wk. Clones reactive to soluble recombinant annexin A2 were further subcloned by limiting dilution and expanded as above. Reactivity to soluble recombinant annexin A2 (1 µg/mL final concentration) was assessed by TNF-α secretion using an ELISA kit assay (Mabtech) and following the manufacturer’s instructions.
Data Analysis.
Experiments were carried out at least three times independently. A Mann–Whitney test was used to compare unpaired conditions, A Willcoxon test was used to compare paired conditions and two-way ANOVA test was used in multiple comparisons in shRNA experiments. Correlations between FMS-01 expression level on glioblastoma cell lines (U373MG, U343MG, and U251MG) and CD69 expression by JRT3 73R9 were estimated using the Spearman coefficient. In all tests the threshold of significance was fixed at P < 0.05. Prism V5 Software (GraphPad) was used for all analyses.
Acknowledgments
We thank J. Visentin, J. L. Taupin, M. Capone, R. Carmeille, A. Bouter, and A. Brisson for helpful discussions; S. Daburon and S. Gonzalez for technical assistance; and the vectorology facility (TBM Core, CNRS UMS 3427, INSERM US 005, Bordeaux University). This work was supported in part by grants from the Centre National de la Recherche Scientifique, the Institut National du Cancer (PLBIO10-189 TUMOSTRESS; TRANSLA-14 GDSTRESS), Fondation pour la Recherche Médicale (DEQ20110421287), the Agence National de la Recherche (ANR-12-BSV3-0024-02), the Ligue Nationale contre le Cancer (Comités Départementaux d’Aquitaine), and the SIRIC Brio (FAC 2014 DECAMET). B.F. and A.P. were supported by the Conseil Régional d’Aquitaine.
Footnotes
The authors declare no conflict of interest.
This article is a PNAS Direct Submission.
This article contains supporting information online at www.pnas.org/lookup/suppl/doi:10.1073/pnas.1621052114/-/DCSupplemental.
References
- 1.Zinkernagel RM, Doherty PC. The discovery of MHC restriction. Immunol Today. 1997;18(1):14–17. doi: 10.1016/s0167-5699(97)80008-4. [DOI] [PubMed] [Google Scholar]
- 2.Rock EP, Sibbald PR, Davis MM, Chien YH. CDR3 length in antigen-specific immune receptors. J Exp Med. 1994;179(1):323–328. doi: 10.1084/jem.179.1.323. [DOI] [PMC free article] [PubMed] [Google Scholar]
- 3.Chien YH, Meyer C, Bonneville M. γδ T cells: First line of defense and beyond. Annu Rev Immunol. 2014;32:121–155. doi: 10.1146/annurev-immunol-032713-120216. [DOI] [PubMed] [Google Scholar]
- 4.Born WK, Kemal Aydintug M, O’Brien RL. Diversity of γδ T-cell antigens. Cell Mol Immunol. 2013;10(1):13–20. doi: 10.1038/cmi.2012.45. [DOI] [PMC free article] [PubMed] [Google Scholar]
- 5.Crowley MP, et al. A population of murine gammadelta T cells that recognize an inducible MHC class Ib molecule. Science. 2000;287(5451):314–316. doi: 10.1126/science.287.5451.314. [DOI] [PubMed] [Google Scholar]
- 6.Willcox CR, et al. Cytomegalovirus and tumor stress surveillance by binding of a human γδ T cell antigen receptor to endothelial protein C receptor. Nat Immunol. 2012;13(9):872–879. doi: 10.1038/ni.2394. [DOI] [PubMed] [Google Scholar]
- 7.Luoma AM, et al. Crystal structure of Vδ1 T cell receptor in complex with CD1d-sulfatide shows MHC-like recognition of a self-lipid by human γδ T cells. Immunity. 2013;39(6):1032–1042. doi: 10.1016/j.immuni.2013.11.001. [DOI] [PMC free article] [PubMed] [Google Scholar]
- 8.Uldrich AP, et al. CD1d-lipid antigen recognition by the γδ TCR. Nat Immunol. 2013;14(11):1137–1145. doi: 10.1038/ni.2713. [DOI] [PubMed] [Google Scholar]
- 9.Harly C, et al. Key implication of CD277/butyrophilin-3 (BTN3A) in cellular stress sensing by a major human γδ T-cell subset. Blood. 2012;120(11):2269–2279. doi: 10.1182/blood-2012-05-430470. [DOI] [PMC free article] [PubMed] [Google Scholar]
- 10.Sandstrom A, et al. The intracellular B30.2 domain of butyrophilin 3A1 binds phosphoantigens to mediate activation of human Vγ9Vδ2 T cells. Immunity. 2014;40(4):490–500. doi: 10.1016/j.immuni.2014.03.003. [DOI] [PMC free article] [PubMed] [Google Scholar]
- 11.Vavassori S, et al. Butyrophilin 3A1 binds phosphorylated antigens and stimulates human γδ T cells. Nat Immunol. 2013;14(9):908–916. doi: 10.1038/ni.2665. [DOI] [PubMed] [Google Scholar]
- 12.Scotet E, et al. Tumor recognition following Vgamma9Vdelta2 T cell receptor interactions with a surface F1-ATPase-related structure and apolipoprotein A-I. Immunity. 2005;22(1):71–80. doi: 10.1016/j.immuni.2004.11.012. [DOI] [PubMed] [Google Scholar]
- 13.Hayday AC. Gammadelta T cells and the lymphoid stress-surveillance response. Immunity. 2009;31(2):184–196. doi: 10.1016/j.immuni.2009.08.006. [DOI] [PubMed] [Google Scholar]
- 14.Toulon A, et al. A role for human skin-resident T cells in wound healing. J Exp Med. 2009;206(4):743–750. doi: 10.1084/jem.20081787. [DOI] [PMC free article] [PubMed] [Google Scholar]
- 15.D’Ombrain MC, Hansen DS, Simpson KM, Schofield L. gammadelta-T cells expressing NK receptors predominate over NK cells and conventional T cells in the innate IFN-gamma response to Plasmodium falciparum malaria. Eur J Immunol. 2007;37(7):1864–1873. doi: 10.1002/eji.200636889. [DOI] [PubMed] [Google Scholar]
- 16.Girardi M, et al. Regulation of cutaneous malignancy by gammadelta T cells. Science. 2001;294(5542):605–609. doi: 10.1126/science.1063916. [DOI] [PubMed] [Google Scholar]
- 17.Martin B, Hirota K, Cua DJ, Stockinger B, Veldhoen M. Interleukin-17-producing gammadelta T cells selectively expand in response to pathogen products and environmental signals. Immunity. 2009;31(2):321–330. doi: 10.1016/j.immuni.2009.06.020. [DOI] [PubMed] [Google Scholar]
- 18.Strid J, et al. Acute upregulation of an NKG2D ligand promotes rapid reorganization of a local immune compartment with pleiotropic effects on carcinogenesis. Nat Immunol. 2008;9(2):146–154. doi: 10.1038/ni1556. [DOI] [PubMed] [Google Scholar]
- 19.Harly C, et al. Up-regulation of cytolytic functions of human Vδ2-γ T lymphocytes through engagement of ILT2 expressed by tumor target cells. Blood. 2011;117(10):2864–2873. doi: 10.1182/blood-2010-09-309781. [DOI] [PubMed] [Google Scholar]
- 20.Halary F, et al. Shared reactivity of Vdelta2(neg) gammadelta T cells against cytomegalovirus-infected cells and tumor intestinal epithelial cells. J Exp Med. 2005;201(10):1567–1578. doi: 10.1084/jem.20041851. [DOI] [PMC free article] [PubMed] [Google Scholar]
- 21.Deora AB, Kreitzer G, Jacovina AT, Hajjar KA. An annexin 2 phosphorylation switch mediates p11-dependent translocation of annexin 2 to the cell surface. J Biol Chem. 2004;279(42):43411–43418. doi: 10.1074/jbc.M408078200. [DOI] [PubMed] [Google Scholar]
- 22.Gerke V, Creutz CE, Moss SE. Annexins: Linking Ca2+ signalling to membrane dynamics. Nat Rev Mol Cell Biol. 2005;6(6):449–461. doi: 10.1038/nrm1661. [DOI] [PubMed] [Google Scholar]
- 23.Huang B, et al. Hypoxia-inducible factor-1 drives annexin A2 system-mediated perivascular fibrin clearance in oxygen-induced retinopathy in mice. Blood. 2011;118(10):2918–2929. doi: 10.1182/blood-2011-03-341214. [DOI] [PMC free article] [PubMed] [Google Scholar]
- 24.Reeves SA, Chavez-Kappel C, Davis R, Rosenblum M, Israel MA. Developmental regulation of annexin II (Lipocortin 2) in human brain and expression in high grade glioma. Cancer Res. 1992;52(24):6871–6876. [PubMed] [Google Scholar]
- 25.Luo M, Hajjar KA. Annexin A2 system in human biology: Cell surface and beyond. Semin Thromb Hemost. 2013;39(4):338–346. doi: 10.1055/s-0033-1334143. [DOI] [PMC free article] [PubMed] [Google Scholar]
- 26.Ramirez K, Witherden DA, Havran WL. All hands on DE(T)C: Epithelial-resident γδ T cells respond to tissue injury. Cell Immunol. 2015;296(1):57–61. doi: 10.1016/j.cellimm.2015.04.003. [DOI] [PMC free article] [PubMed] [Google Scholar]
- 27.Lennon NJ, et al. Dysferlin interacts with annexins A1 and A2 and mediates sarcolemmal wound-healing. J Biol Chem. 2003;278(50):50466–50473. doi: 10.1074/jbc.M307247200. [DOI] [PubMed] [Google Scholar]
- 28.Skrahina T, Piljić A, Schultz C. Heterogeneity and timing of translocation and membrane-mediated assembly of different annexins. Exp Cell Res. 2008;314(5):1039–1047. doi: 10.1016/j.yexcr.2007.11.015. [DOI] [PubMed] [Google Scholar]
- 29.Derry MC, Sutherland MR, Restall CM, Waisman DM, Pryzdial EL. Annexin 2-mediated enhancement of cytomegalovirus infection opposes inhibition by annexin 1 or annexin 5. J Gen Virol. 2007;88(Pt 1):19–27. doi: 10.1099/vir.0.82294-0. [DOI] [PubMed] [Google Scholar]
- 30.Bianchi ME. DAMPs, PAMPs and alarmins: All we need to know about danger. J Leukoc Biol. 2007;81(1):1–5. doi: 10.1189/jlb.0306164. [DOI] [PubMed] [Google Scholar]
- 31.Danielsen EM, van Deurs B, Hansen GH. “Nonclassical” secretion of annexin A2 to the lumenal side of the enterocyte brush border membrane. Biochemistry. 2003;42(49):14670–14676. doi: 10.1021/bi0355239. [DOI] [PubMed] [Google Scholar]
- 32.Geronimi F, et al. Highly efficient lentiviral gene transfer in CD34+ and CD34+/38-/lin- cells from mobilized peripheral blood after cytokine prestimulation. Stem Cells. 2003;21(4):472–480. doi: 10.1634/stemcells.21-4-472. [DOI] [PubMed] [Google Scholar]
- 33.Kall L, Canterbury JD, Weston J, Noble WS, MacCoss MJ. Semi-supervised learning for peptide identification from shotgun proteomics datasets. Nat Methods. 2007;4(11):923–925. doi: 10.1038/nmeth1113. [DOI] [PubMed] [Google Scholar]


