Significance
Transcription factor GATA3 has emerged as one of top three altered genes in mammary tumors. In breast cancer, GATA3 expression has been associated with an estrogen receptor (ER)-positive (ER+/luminal) phenotype. ER+ tumor cells resemble more differentiated cells, and affected patients are more responsive to therapy and have overall better survival outcomes. Loss of GATA3 correlates with ER−, less differentiated, and more aggressive tumors with poorer prognosis. We have identified zinc-finger elbow-related proline domain protein 2 (ZPO2) as a transcriptional repressor that down-regulates GATA3 and promotes aggressive breast cancer. Thus, ZPO2 could be an important oncogenic target for prediction of aggressive breast cancer.
Keywords: breast cancer, GATA3, ZNF503/ZPO2, ZBTB32, tumor metastasis
Abstract
The transcription factor GATA3 is the master regulator that drives mammary luminal epithelial cell differentiation and maintains mammary gland homeostasis. Loss of GATA3 is associated with aggressive breast cancer development. We have identified ZNF503/ZEPPO2 zinc-finger elbow-related proline domain protein 2 (ZPO2) as a transcriptional repressor of GATA3 expression and transcriptional activity that induces mammary epithelial cell proliferation and breast cancer development. We show that ZPO2 is recruited to GATA3 promoter in association with ZBTB32 (Repressor of GATA, ROG) and that ZBTB32 is essential for down-regulation of GATA3 via ZPO2. Through this modulation of GATA3 activity, ZPO2 promotes aggressive breast cancer development. Our data provide insight into a mechanism of GATA3 regulation, and identify ZPO2 as a possible candidate gene for future diagnostic and therapeutic strategies.
The transcription factor GATA3 is a key mediator of luminal cell fate determination and homeostasis in adult mammary gland (1–3). GATA3 is one of top three altered genes during breast cancer progression (4). GATA3 expression is detected in estrogen receptor (ER)-positive mammary tumors (5–12). ER+ tumor cells morphologically resemble more differentiated luminal cells, and affected patients generally have a promising survival outcome. Mammary tumor cells that exhibit diminished levels of GATA3 expression have less differentiated cellular morphology and give rise to more aggressive breast cancers characterized by larger tumor size, higher histological grade, and enhanced metastasis (7, 13–16).
DNA mutations are one cause of GATA3 deregulation. Frame-shift mutations or sequence alteration near the highly conserved second zinc finger, which is required for DNA binding in the GATA3 gene, may play a role in diminishing GATA3 functionality, leading to breast cancer progression (4, 17–19). Other regulatory pathways or transcriptional inhibitors may influence GATA3 expression and transcriptional activity as well.
The NET subfamily of zinc finger proteins that are related to the Sp family of transcription factors plays a prominent role during development (20). We have identified ZNF703/Zeppo1 (zinc finger elbow-related proline domain protein 2; Zpo2/Nolz2/Zfp703) and ZNF503/Zeppo2 (zinc finger elbow-related proline domain protein-2; Zpo2/Nolz1/Zfp503) expression in mammary epithelial cells (21). Zpo1 and Zpo2 are closely related and have 54% protein sequence identity. Our work and that of others have shown that deregulation of Zpo1 can lead to breast cancer (21–24); however, unlike Zpo1, our understanding of Zpo2 involvement in mammary tumor development is minimal. Previous studies have indicated that Zpo2 is critical for proper development in several species (25–27). We have shown that Zpo2 is a transcriptional repressor expressed in both embryonic and adult mammary epithelial cells, with significantly higher expression levels in the basal cell compartment than in luminal epithelial cells (28). Zpo2 promotes mammary epithelial cell proliferation and enhances cellular migration and invasion. Elevated ZPO2/ZNF503 levels correlate with breast cancer progression and increased metastasis (28). The underlying mechanism of ZPO2-induced breast cancer remains elusive, however. Moreover, whether Zpo1 and Zpo2 function redundantly or exert different cellular effects during mammary tumorigenesis is unclear.
Here we report an interplay among Zpo2, ZBTB32, and GATA3 in mammary epithelial cells. We show that ZBTB32 facilitates Zpo2 targeting to the GATA3 promoter, leading to down-regulation of GATA3 expression and activity. Modulation of GATA3 by Zpo2 in turn results in the development of aggressive breast cancers.
Results
In Silico Analysis of Breast Cancer Databases Suggests Interplay Between ZPO2 and GATA3.
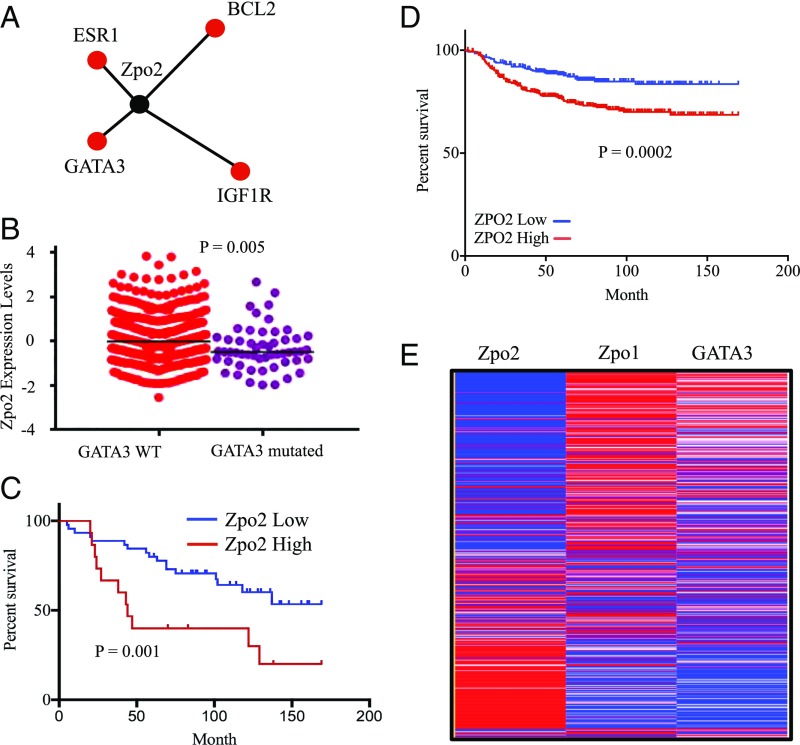
Deregulation of GATA3 is one of the most prominent associations with breast cancer. Analysis of 823 patient samples from the TCGA database via cBioportal (cbioportal.org/) indicated that GATA3 expression is altered in 14.2% of cases (Fig. S1A). These alterations are due to amplification, mutation, mRNA down-regulation, and changes in protein levels. Of these, roughly 7% are due solely to down-regulation of GATA3 independent of any mutations (Fig. S1B). These data suggest that unknown regulatory mechanisms may down-regulate wild-type (WT) GATA3 expression, resulting in the development of breast cancer. Analysis of TCGA database via Regulome Explorer (explorer.cancerregulome.org) for protein network association indicated a pairwise association between Zpo2 and several key mammary epithelial cell regulators including GATA3 (Fig. 1A). Intriguingly, ZPO2/ZNF503 levels were higher in breast cancer samples with WT GATA3 than in those with mutated GATA3 (Fig. 1B).
Fig. S1.
TCGA analysis for GATA3 expression via cBioPortal. (A) 14% of analyzed breast cancer samples show GATA3 alterations, including mutation and amplification. (B) 7% of analyzed breast cancer samples indicate mRNA down-regulation without the presence of mutations.
Fig. 1.
In silico analysis of ZPO2 expression using a breast cancer database. (A) Protein network analysis indicating pairwise association between ZPO2 and GATA3. The analysis was performed with Regulome Explorer using the TCGA database. (B) TCGA database analysis of ZPO2 expression in breast cancer samples with either WT or mutated GATA3. WT GATA3: mean ± SD, 0.093 ± 1.056; SEM, ± 0.049. Mutated GATA3: mean ± SD, −0.328 ± 0.982; SEM, ± 0.134. (C) Patient survival analysis based on high or low ZPO2 expression. The GSE1378 breast cancer dataset was downloaded from the National Center for Biotechnology Information’s Gene Expression Omnibus database. We divided the patients into two groups with different survival curves using ZPO2 gene expression (quartile cutoff was set at 25% high and 75% low ZPO2 expression). Higher ZPO2 expression was associated with poor prognosis. (D) Kaplan–Meier analysis of distant metastasis free survival using the DMFS database. HR, 1.99; 95% CI, 1.38–2.86; P = 0.0002. (E) Heat map of the TCGA database analysis for ZPO2, ZPO1, and GATA3 expression in breast cancer patients.
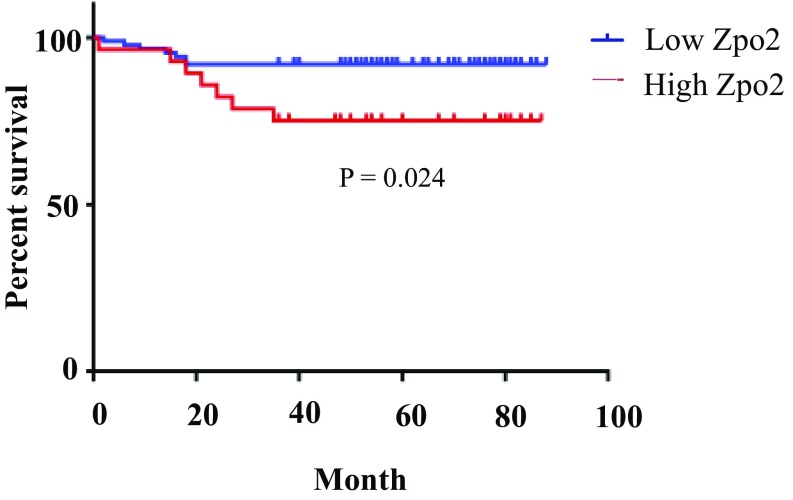
Analysis of the GSE1378 database (29, 30) indicated a correlation between higher ZPO2 levels and poorer survival in breast cancer patients (Fig. 1C). In addition, we analyzed distant metastasis-free survival (DMFS) using patient samples from the DMFS database expressing high and low ZPO2. Again, higher ZPO2 levels correlated with poor patient survival (Fig. 1D). We also observed poor prognosis in patients with higher ZPO2 when analyzed from GSE19615 (31) (Fig. S2). Analysis of a TCGA dataset composed of 825 patient samples for GATA3, ZPO1/ZNF703, and ZPO2 expression levels revealed an inverse correlation between ZPO2 expression and GATA3 or ZPO1 level. In the tumor samples, where ZPO2 levels were the highest, GATA3 and ZPO1 expressions were the lowest (Fig. 1E).
Fig. S2.
ZPO2 expression analysis using the GSE19615 dataset. Overexpression of ZPO2 correlates with low patient survival.
Collectively, our in silico analyses indicate that ZPO2 and GATA3 reside within the same protein network, and that there is an inverse relationship of their expression in breast cancer samples. Thus, ZPO2 is a candidate gene that may play a potential role in mammary tumor induction via down-regulation of GATA3.
Zpo2 Down-Regulates GATA3 Expression in Mammary Epithelial Cells.
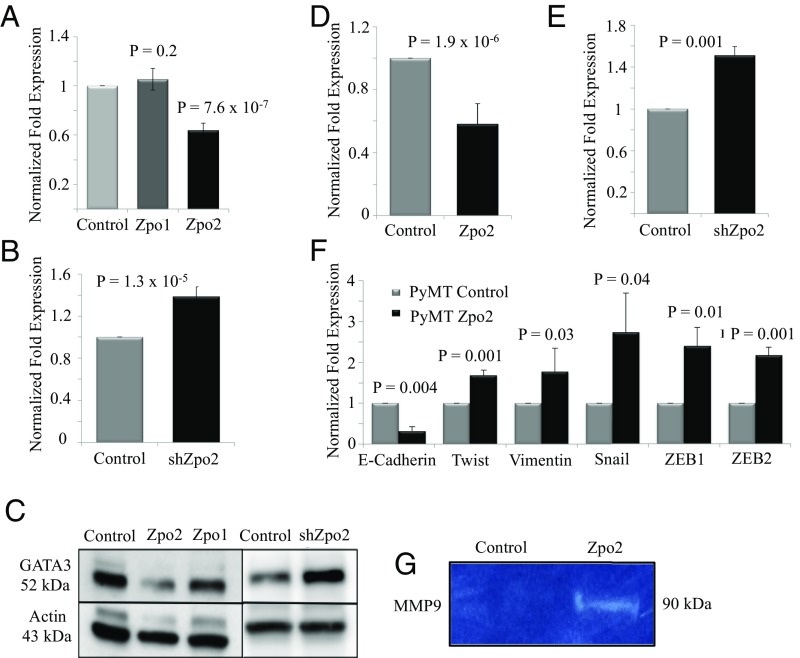
We next examined the effect of Zpo2 overexpression or Zpo2 knockdown on GATA3 levels in murine mammary cell lines. We used EpH4.9 and MMTV-PyMT (PyMT) mammary stable cell lines that either overexpressed full-length V5-tagged Zpo1 or Zpo2 constructs or expressed Zpo2-shRNA (shZpo2) (21, 28). Both cell lines had detectable levels of endogenous GATA3. We found that Zpo2 down-regulated GATA3 levels, whereas shRNA-mediated Zpo2 knockdown enhanced GATA3 expression (Fig. 2 A–E). Modulation of GATA3 levels was specific to Zpo2 activity; Zpo1 overexpression did not alter GATA3 RNA and protein levels (Fig. 2 A and C). Furthermore, transient transfection of full-length V5-tagged Zpo2 construct in MCF7, NMuMG, and EpH4.9 cells, which have detectable levels of endogenous GATA3, also revealed reduced GATA3 protein levels (Fig. S3).
Fig. 2.
Effect of elevated Zpo2 levels on Zpo1-, GATA3-, and EMT-associated genes. (A) qRT-PCR analysis indicating GATA3 levels in EpH4.9 cells overexpressing Zpo1 and Zpo2. (B) qRT-PCR analysis indicating that shRNA-mediated down-regulation of Zpo2 increases Gata3 levels. (C) Western blot analysis in EpH4.9 mammary epithelial cell extracts. Zpo2 overexpression lowers GATA3 levels. Zpo1 overexpression does not alter GATA3 levels. Down-regulation of Zpo2 elevates GATA3 levels. (D) qRT-PCR analysis of Gata3 expression in PyMT cells overexpressing Zpo2. Zpo2 down-regulates Gata3 levels. (E) qRT-PCR analysis in PyMT cells. Down-regulation of Zpo2 results in increased Gata3 levels. (F) qRT-PCR analysis of EMT-associated genes in PyMT cells. Overexpression of Zpo2 alters EMT-associated gene expression (G) Zymogram analysis indicating increased MMP9 levels in EpH4.9 mammary epithelial cells overexpressing Zpo2.
Fig. S3.
Zpo2 down-regulates GATA3. Control plasmid or full-length Zpo2 constructs were transiently transfected in EpH4.9, NMuMg, and MCF7 mammary cells. At 2 d posttransfection, the cells were lysed, and the cell lysate was analyzed for GATA3 and Zpo2 via Western blot analysis. Overexpression of Zpo2 resulted in down-regulation of GATA3 in all cell lines.
GATA3 functions as a tumor suppressor in part by blocking epithelial-mesenchymal transition (EMT)-associated gene expression and interfering with cellular invasiveness (13, 15, 32–34). In contrast, Zpo2 promotes mammary cell proliferation and invasiveness (28). We found that Zpo2 overexpression resulted in significant up-regulation of Twist, Vimentin, Snail, ZEB1, and ZEB2 and lowered E-cadherin mRNA levels (Fig. 2F). In addition, Zpo2 overexpression increased matrix metalloproteinase-9 (MMP9) expression levels and activity (Fig. 2G). Thus, our data indicate that Zpo2 blocks GATA3 and interferes with its transcriptional activity as a tumor suppressor.
Zpo2 Forms a Complex with ZBTB32 to Target and Repress GATA3 Expression.
Zpo2 is a transcriptional repressor targeted to the nucleus (28). Because Zpo2 is in the same protein network as GATA3 and inhibits GATA3 expression and transcriptional activity, we investigated the underlying mechanism of Zpo2-mediated GATA3 modulation. We performed yeast two-hybrid experiments to uncover potential Zpo2 interacting partners that might link Zpo2 to GATA3 pathway. We used full-length Zpo2 as bait and screened against an expression library generated from MMTV-PyMT mouse tumors. We found 14 candidate molecules that indicated strong interactions with Zpo2. These candidate molecules were classified into three groups: transcriptional regulators consisting of DP103, HDGF, Zpo1, and ZBTB32; sumoylation pathway-specific macromolecules; and a third group comprising a mix of proteins, such as Aha1, Dor1, PK2, SPK-2, and GSN (Table S1).
Table S1.
Yeast two-hybrid results: 14 candidate genes with the potential ability to interact with Zpo2
| Gene | Description |
| Transcriptional regulators | |
| DP103 | DEAD Box protein |
| HDGF | Hepatoma-derived growth factor family |
| ZBTB32 | Zinc finger and BTB domain containing 32 |
| Zeppo1 | Zinc finger protein 703 |
| Sumolyation pathway specific | |
| Miz1 | Zinc finger and BTB domain containing 17 |
| PIAS1 | Protein inhibitor of activated STAT-1 |
| PIAS4 | Protein inhibitor of activated STAT-4 |
| SUMO | Small ubiquitin-like modifier |
| Ubc9 | Ubiquitin-conjugating enzyme E21 |
| Others | |
| Aha1 | Activator of heat shock 90kDa protein ATPase homolog 1 |
| Dor1 | Component of oligomeric Golgi complex 8 |
| GSN | Gelsolin |
| PK2 | Pyruvate kinase 2 |
| SPK-2 | Sphingosine kinase 2 |
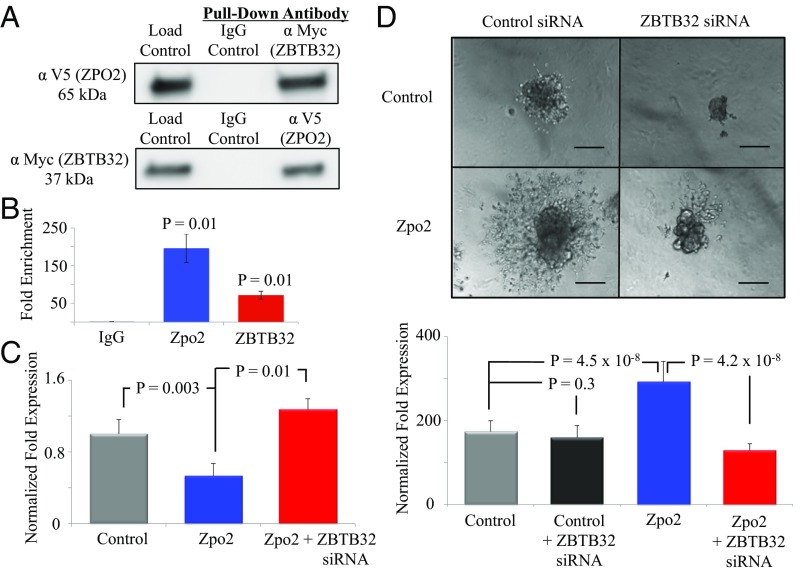
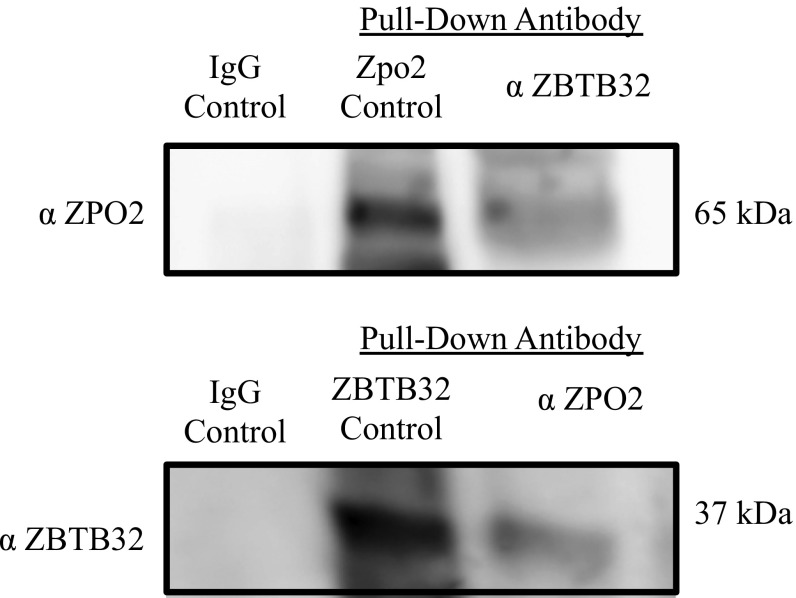
Among the potential candidate genes, ZBTB32 provides a plausible link between Zpo2 and GATA3. In lymphocytes, ZBTB32 specifically targets the GATA3 promoter and inhibits GATA3 transcriptional activity (35). Therefore, we cotransfected full-length V5-tagged Zpo2 and full-length Myc-tagged Zbtb32 constructs into EpH4.9 cells to determine whether Zpo2 and ZBTB32 form a complex that targets and represses GATA3 expression and transcriptional activity. Coimmunoprecipitation (co-IP) with anti-Myc (ZBTB32) or anti-V5 tag (ZPO2) antibodies, followed by Western blot analysis using anti-V5 tag or anti-Myc antibodies to pull down ZPO2 or ZBTB32 proteins and examine ZPO2/ZBTB32 interaction, demonstrated that ZPO2 and ZBTB32 form a complex in mammary cells (Fig. 3A).
Fig. 3.
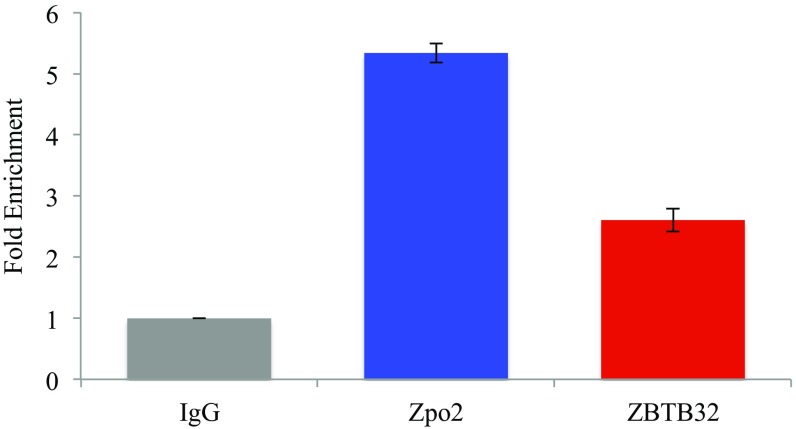
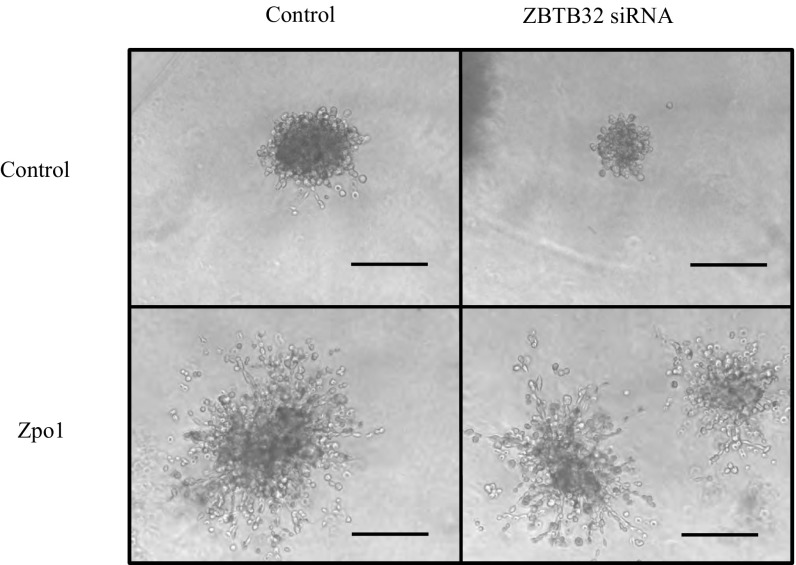
Analysis of Zpo2 and ZBTB32 interaction. (A) Co-IP experiment indicating Zpo2 and ZBTB32 interaction. EpH4.9 cells were cotransfected with V5-tagged Zpo2 and Myc-tagged Zbtb32 constructs. Pull-down was performed with control IgG, anti-Myc (ZBTB32), or anti-V5 tag (ZPO2) antibodies. Western blot analysis for the presence of Zpo2 or ZBTB32 was performed with anti-V5 tag or anti-Myc antibodies, respectively. (B) ChIP analysis indicating the presence of Zpo2 and ZBTB32 on the Gata3 promoter. qRT-PCR analysis was performed using primers specific to the Gata3 promoter. n = 4. (C) qRT-PCR analysis for Gata3 expression in EpH4.9 control or EpH4.9 Zpo2-overexpressing cells in the presence or absence of ZBTB32. Inhibition of Zbtb32 restored Gata3 levels. (D) 3D Matrigel culture assay of control or Zpo2-overexpressing EpH4.9 cells. Inhibition of Zbtb32 interferes with cellular invasion mediated by Zpo2. (Scale bar: 150 µm.)
We also performed co-IP experiments using endogenous ZPO2 and ZBTB32 proteins followed by Western blot analysis to examine the ZPO2–ZBTB32 interaction (Fig. S4). Co-IP experiments using endogenous proteins also indicated a ZPO2–ZBTB32 interaction in EpH4.9 mammary cells. To validate that the Zpo2/ZBTB32 complex is targeted to the Gata3 promoter, we performed chromatin immunoprecipitation (ChIP) analysis using endogenous ZPO2 and ZBTB32 proteins in EpH4.9 cells. Quantitative RT-PCR (qRT-PCR) using primers specific to Gata3 promoter verified that both ZPO2 and ZBTB32 occupy the Gata3 promoter (Fig. 3B). In addition, we cotransfected EpH4.9 cells with full-length Zpo2 and Zbtb32 constructs. ChIP analysis of transfected cells also demonstrated that ZPO2 and ZBTB32 occupy the Gata3 promoter region (Fig. S5).
Fig. S4.
Co-IP experiment indicating endogenous ZPO2 and ZBTB32 interaction in EpH4.9 cells. For each experiment, 10 mg of total protein was pulled down via anti-ZPO2 or anti-ZBTB32 antibody. The samples were examined via Western blot analysis using anti-ZPO2 or anti-ZBTB32 antibody. Bidirectional co-IP indicates that ZPO2 and ZBTB32 form a complex in EpH4.9 mammary cells.
Fig. S5.
ChIP analysis indicating that ZPO2 and ZBTB32 occupy the Gata3 promoter. EpH4.9 cells were grown in 150-mm culture dishes and cotransfected with full-length Zpo2 and Myc-tagged ZBTB32 (generous gifts from Dr. I.-Cheng Ho, Harvard Medical School) constructs via FuGENE6 transfection reagent (Promega). ChIP analysis was performed using the ChIP-IT High-Sensitivity Kit (Active Motif) in accordance with the manufacturer’s protocol. qPCR for ChIP samples was performed using Gata3 promoter sequence primers listed in the text. ChIP analysis indicated that both ZPO2 and ZBTB32 occupy the promoter sequence of GATA3.
We next examined whether ZBTB32 is necessary for the inhibitory effect of Zpo2 activity. Knockdown of Zbtb32 rescued Gata3 levels in EpH4.9 cells overexpressing Zpo2 (Fig. 3C). To further investigate the importance of ZBTB32 for Zpo2 functionality, we performed 3D Matrigel culture assays using control or Zpo2-expressing EpH4.9 cells. As shown previously (28), overexpression of Zpo2 in EpH4.9 cells resulted in the formation of invasive colonies in 3D Matrigel cultures. Interestingly, knockdown of Zbtb32 interfered with the invasive phenotype exerted by Zpo2, and colonies failed to infiltrate throughout the Matrigel matrix (Fig. 3D). To demonstrate the specificity of ZBTB32, we conducted a similar experiment in cells overexpressing Zpo1. Whereas Zpo1 induces cellular migration and promotes an invasive phenotype (21), similar to colonies expressing Zpo2, the knockdown of Zbtb32 in Zpo1-overexpressing cells did not change their invasive phenotype (Fig. S6). Taken together, our data indicate that Zpo2 relies on ZBTB32 to down-regulate GATA3 and promote cellular invasion.
Fig. S6.
Zpo1-overexpressing EpH4.9 cells were placed in 3D Matrigel cultures. Zpo1 induced an aggressive phenotype. Zpo1-overexpressing cells infiltrated through the Matrigel matrix. Knockdown of Zbtb32 did not alter Zpo1-induced cellular invasion. (Scale bar: 150 µm.)
Zpo2 Enhances in Vivo Tumor Growth and Metastasis.
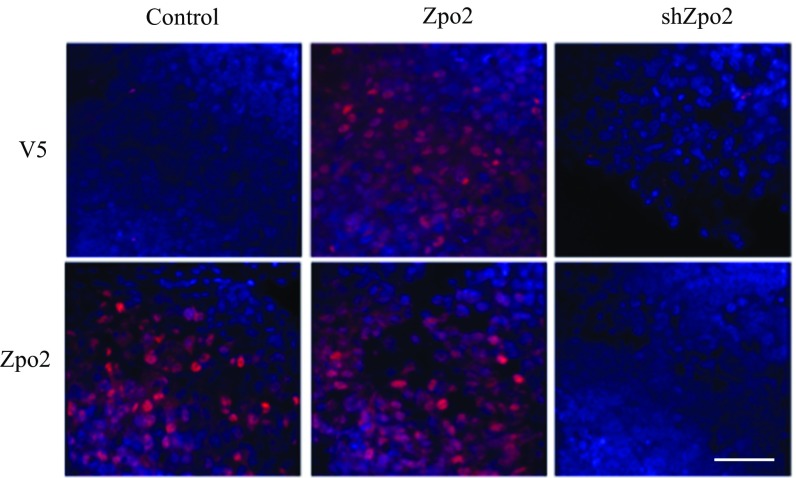
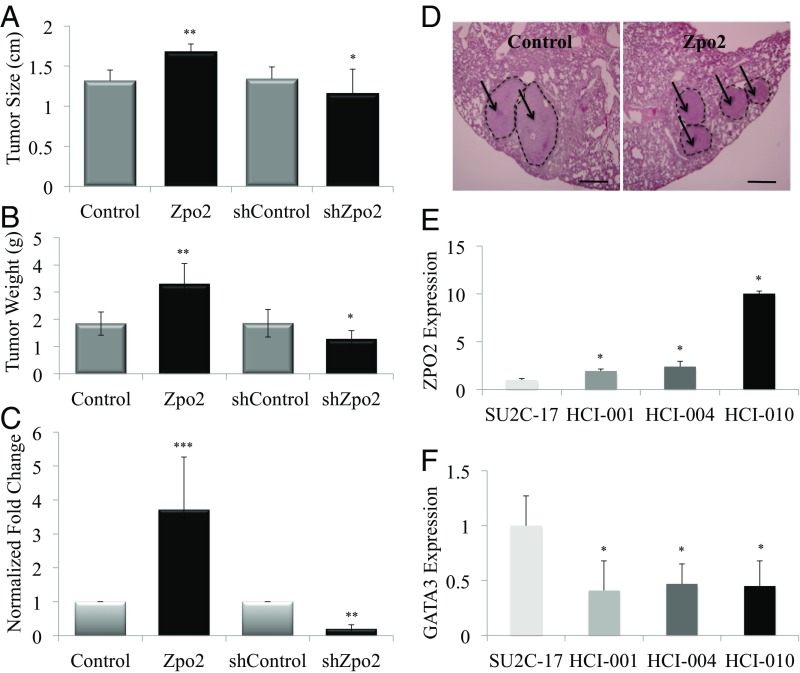
We next analyzed the effect of Zpo2 on tumor growth and metastasis in vivo in orthotopic transplants formed after injecting 2.5 × 10⁵ PyMT control cells or overexpressing full-length V5-tagged Zpo2 cells into the mammary fat pads of 6-wk-old female recipient mice. We also transplanted 2.5 × 10⁵ control or shZpo2 PyMT tumor cells in separate sets of mice. At 6 wk posttransplantation, we verified Zpo2 expression in the transplanted tumors using Zpo2- and V5-tag–specific antibodies via immunostaining (Fig. S7), and determined tumor size and weight (Fig. 4 A and B). Overexpression of Zpo2 resulted in larger tumor size compared with control, whereas knockdown of Zpo2 resulted in smaller tumor size. Using PyMT-specific primers to perform qRT-PCR analysis on recipient lung tissue samples, we observed that PyMT cells expressing Zpo2 exhibited enhanced tumor metastasis to the lungs (Fig. 4C), whereas knockdown of Zpo2 in PyMT tumor cells rendered them less metastatic (Fig. 4C). Histological analysis of recipient lungs demonstrated more metastatic colonies in mice transplanted with PyMT tumor cells overexpressing Zpo2 (Fig. 4D). In addition, when we transplanted 2.5 × 10⁵ control or ZPO2-overexpressing human T47D cells orthotopically in 6-wk-old nude mice, at 4 wk after transplantation, T47D cells that overexpressed ZPO2 also generated larger tumors compared with controls (Fig. S8).
Fig. S7.
Immunostaining analysis of Zpo2 expression in orthotopic PyMT tumor transplants. Tumor sections were stained either with anti-Zpo2 antibody for analysis of endogenous Zpo2 expression or with anti-V5 tag antibody for the overexpressed construct. Control and Zpo2- overexpressing tumor sections stained positive for anti-Zpo2 staining. Only Zpo2-overexpressing tumor sections stained positive for anti-V5 tag antibody. The tumor sections expressing shZpo2 did not stain for either of the antibodies. (Scale bar: 50 μm.)
Fig. 4.
Zpo2 promotes aggressive mammary tumor development. (A) Tumor measurement of orthotopically transplanted PyMT tumor cells. Zpo2 overexpression enhances tumor growth. Knockdown of Zpo2 reduces tumor size compared with controls. Zpo2-overexpressing tumors, **P ≤ 0.01. Zpo2 knockdown tumors, *P < 0.05. n = 10. (B) Zpo2 overexpression leads to increased tumor weight, and knockdown of Zpo2 decreases tumor weight compared with controls. Zpo2-overexpressing tumors, **P < 0.01; Zpo2 knockdown tumors, *P < 0.05. n = 10. (C) qRT-PCR analysis using PyMT-specific primers for the presence of metastatic PyMT cells in the lung. Zpo2 enhances tumor metastasis. Knockdown of Zpo2 reduces the metastatic ability of PyMT cells to the lung. Zpo2-overexpressing tumors, ***P < 0.0001. Zpo2 knockdown tumors. **P < 0.001. n = 10. (D) H&E staining of lung tissue. Overexpression of Zpo2 in PyMT cells enhances metastatic colony formation in the recipient lungs. The arrows point at metastatic colonies in the recipient lung. (Scale bar: 200 μm.) (E) qRT-PCR analysis of ZPO2 expression in PDX tumor lines. More aggressive tumor lines indicate higher ZPO2 expression. *P < 0.001. (F) qRT-PCR analysis of GATA3 levels in PDX tumor lines. GATA3 expression is reduced in more metastatic tumor lines. *P < 0.001.
Fig. S8.
Zpo2 enhances T47D xenograft tumor growth. Analysis of orthotopically transplanted T47D tumors at 4 wk posttransplantation. Tumor cells overexpressing Zpo2 gave rise to larger tumors (A) and increased tumor weight (B) (n = 5).
In further support of our in vivo tumor data, we used patient-derived xenograft (PDX) tumor models to examine ZPO2 levels in breast cancer. We compared ZPO2 levels in a nonmetastatic PDX line (SU2C-17) with those in PDX lines exhibiting tumor metastasis (i.e., HCI-001, HCI-004, and HCI-010) (36, 37). qRT-PCR analysis revealed higher ZPO2 expression in the more aggressive tumors (Fig. 4E). Interestingly, PDX tumor lines with higher ZPO2 expression also demonstrated lower GATA3 levels (Fig. 4F). Taken together, our in vivo data emphasize the importance of ZPO2 in modulating GATA3 and breast cancer development.
Discussion
GATA3 has emerged as a prominent transcription factor required for the maintenance of mammary gland homeostasis. Loss of GATA3 is associated with aggressive breast cancer development. Whereas genomic mutations in GATA3 lead to down-regulation or loss of GATA3 activity in approximately 14% of breast cancers, in our study we found that roughly 7% of tumors demonstrate GATA3 mRNA down-regulation without any sequence mutation or alterations. Our analysis points to interplay between the transcriptional repressor Zpo2 and GATA3. Our in silico data suggest that Zpo2 resides in the same protein network as GATA3. We found that Zpo2 down-regulates GATA3 expression. Whereas Zpo2 and its related protein Zpo1 have high protein sequence similarities and Zpo1 induces aggressive breast cancer (21), modulation of GATA3 was specific to Zpo2 activity, given that overexpression of Zpo2, but not Zpo1, led to down-regulation of GATA3 in mammary cells. Thus, it appears that Zpo1 and Zpo2 are capable of contributing to breast cancer in nonredundant pathways.
We also characterized the relationship between ZPO2 and GATA3 in breast tumor samples segregated based on the presence of either WT or mutated GATA3. Interestingly, ZPO2 transcript levels were higher in tumors with WT GATA3 DNA, and higher ZPO2 expression correlated with lower GATA3 transcript levels in the same analyzed samples. Samples with high ZPO2 expression also had low ZPO1 transcript levels and vice versa. Moreover, patient tumors with higher ZPO2 transcript levels had a poorer prognosis, again highlighting the importance of ZPO2 in aggressive breast cancer.
GATA3 inhibits aggressive breast cancer through strict control and blockage of EMT-associated genes. Suppression of GATA3 levels could partially lift the inhibitory transcriptional control, thereby allowing for up-regulation of EMT-associated genes in the mammary cells. Given that down-regulation of Gata3 via Zpo2 coincided with up-regulation of EMT-associated genes and MMP9, these observations suggest that uncontrolled Zpo2 expression results in the formation of aggressive tumors with more mesenchymal properties. Moreover, up-regulation of MMP9 activity also suggests that Zpo2 could influence the microenvironmental remodeling that allows the invasive tumor cells to escape the main body of the tumor and begin to metastasize. Taken together, these data suggest that Zpo2 contributes to aggressive breast cancer development by exerting a variety of protumor activities through suppression of GATA3 in mammary cells.
Zpo2 translocates to the nucleus and functions as a transcriptional repressor, suggesting that Zpo2 can interact and form complexes with other proteins. However, because Zpo2 contains one zinc finger protein domain, it may lack DNA-binding ability. Using yeast two-hybrid analysis, we identified ZBTB32 as the most plausible candidate for targeting Zpo2 to the Gata3 promoter sequence. In immune cells, during CD4+ T helper 1 (Th1) and T helper 2 (Th2) differentiation, GATA3 expression is critical for Th2 cell fate commitment, whereas GATA3 activity must be blocked for proper Th1 differentiation (38). ZBTB32 plays a crucial role during Th1 and Th2 specification by negatively regulating GATA3 activity (35). ZBTB32 directly binds to the GATA3 promoter sequence and inhibits the activation of GATA3 target genes. Our co-IP and ChIP analyses indicated that in mammary cells, Zpo2 and ZBTB32 form a complex targeted to the Gata3 promoter. Intriguingly, the inhibitory effect of Zpo2 on GATA3 is ZBTB32-dependent. Knockdown of Zbtb32 restored GATA3 levels in cells overexpressing Zpo2. Zpo2 overexpression led to the development of invasive colonies dispersed throughout the 3D Matrigel matrix, which was inhibited by knockdown of Zbtb32. Zbtb32 knockdown restored the WT colony phenotype, even in the presence of Zpo2 overexpression. Interestingly, loss of ZBTB32 did not alter the ability of Zpo1-expressing cells to form invasive colonies, lending further support to the idea that Zpo1 and Zpo2 function through nonredundant mechanisms. Our data suggest that ZBTB32 facilitates targeting of Zpo2 to GATA3 promoter to down-regulate GATA3 target genes in breast cancer. Because GATA3 autoregulates itself (39, 40), repression of GATA3 transcriptional activity could result in an overall decrease in GATA3 levels in mammary cells.
In vivo tumor transplant experiments further support the aggressive nature of ZPO2 in breast cancer development. We found that overexpression of Zpo2 increased tumor growth and aggressiveness in MMTV-PyMT and T47D tumor models. We also found elevated ZPO2 expression in more aggressive breast cancer PDX tumor lines, coinciding with lower GATA3 levels. Thus, the tumor-suppressive capability of the GATA3 pathway may be further enhanced once the restrictive influence of Zpo2 on GATA3 is eliminated. This observation provides a promising avenue for designing new therapeutic strategies by focusing on the Zpo2/GATA3 signaling axis.
It is also noteworthy that Zpo2 could potentially interact with proteins involved in other regulatory pathways in the cells. Zpo2 interactions show a strong preference for components of the sumolyation pathway. Future studies may provide further insight into the importance of Zpo2 during translational modification, as well as its effect in eventual protein targeting and functioning. Moreover, Zpo2 and Zpo1 can form a complex, the significance of which merits future investigation. Our preliminary data indicate that Zpo1 and Zpo2 negatively control each other. Whether Zpo1/Zpo2 complex formation plays a role in negative regulation of these proteins remains unclear.
Early detection of aggressive tumors is a key step in the preparation and design of successful therapeutic strategies against cancer. We have identified ZPO2 as a negative regulator of GATA3, thus providing an alternative mechanism that results in a reduction in or perhaps even loss of GATA3 during breast cancer development. Overexpression of ZPO2 has been detected in breast cancer patients (28), and up-regulation of ZPO2 could supersede GATA3 down-regulation at much earlier time points during breast cancer development. In addition to modulating GATA3, we have shown that ZPO2 could alter multiple pathways, such as pFAK, Rac1/RhoA, and cell cycle-associated genes, in breast cancer (28). Therefore, our data suggest that ZPO2 could be considered an important predictive molecular marker for early detection of aggressive breast cancer.
Materials and Methods
Cell Culture and PDX Cell Lines.
EpH4.9 cells were cultured in DME-H21 medium supplemented with 5% (vol/vol) FBS, insulin (5 µg/mL), and antibiotics. T47D tumor cells were cultured in RPMI medium 1640 supplemented with 10% (vol/vol) FBS, insulin, and antibiotics. MMTV-PyMT tumor cells were cultured in DME-H21 medium supplemented with 5% (vol/vol) FBS and antibiotics. The 3D Matrigel culture assay was performed as described previously (28).
Generation and propagation of PDX lines were done as described previously (36, 37). The nonmetastatic PDX line (SU2C-17) was generated from primary samples from a perineal lymph node provided by Dr. Hope Rugo. The tumor cells were negative for ER, PR, and HER2/neu. The tumor samples were propagated, and a PDX line was generated from these cells.
RNA Extraction, cDNA Synthesis. and qRT-PCR.
RNA extraction was performed using TRIzol reagent (Invitrogen) following the manufacturer’s protocol. cDNA synthesis was performed using iScrip Reverse Transcription Supermix for qRT-PCR (Bio-Rad). qRT-PCR was performed using iTaq Universal SYBR Green Supermix (Bio-Rad) with a Mastercycler ep realplex PCR instrument (Eppendorf).
qRT-PCR Primers and ZBTB32 siRNA.
A list of these primers is provided in SI Materials and Methods.
ChIP Assay.
For ChIP analysis using endogenous ZPO2 and ZBTB32 proteins, EpH4.9 cells were grown to near-confluency in a 150-mm culture dish. ChIP analysis was performed using the ChIP-IT High-Sensitivity Kit (Active Motif) following the manufacturer’s protocol. ChIP sample quality control was maintained with the ChIP-It Control qPCR Kit (Active Motif) and ChIP-It qPCR Analysis Kit (Active Motif). ZPO2 and ZBTB32 ChIP analyses were performed using anti-Zpo2 (Znf503) antibody (Sigma-Aldrich) and anti-ZBTB32 (ROG-M300) antibody (Santa Cruz Biotechnology). qRT-PCR analysis for the Gata3 promoter sequence was performed using two different primer sets: 5′-GGGTTTGGGTTGCAGTTTCCTTGT-3′ (forward), 5′-GCGACGCAACTTAAGGAGGTTCTA-3′ (reverse) and 5′-CGCCAGATCTGTCAGTTTCA-3′ (forward), 5′-AGGAGAAACAGCGAGGGAAT-3′ (reverse).
Co-IP.
EpH4.9 cells were cultured in 10-cm culture dishes and cotransfected with 7 µg of V5-tagged full-length Zpo2 and 7 µg of Myc-tagged ZBTB32 using FuGENE6 transfection reagent (Promega). At 48 h posttransfection, cells were collected and co-IP was performed using a Universal Magnetic Co-IP Kit (Active Motif), followed by Western blot analysis.
Tumor Transplantation.
All animal experiments were performed under approval of University of California San Francisco’s Institutional Animal Care and Use Committee. Here 2.5 × 10⁵ MMTV-PyMT cells from each stable cell lines were placed in 10 µL of Matrigel (Corning) and separately transplanted via intramammary injection using a Hamilton syringe in 6-wk-old syngeneic female FVB mice. Once tumors were palpable, tumors were measured regularly to avoid tumor growth above the allowable 2.0 cm. At 6 wk posttransplantation, animals were killed, and tumors and lungs were collected for analysis.
Immunostaining, Histology Analysis, and Antibodies.
Tissues were fixed in 4% (vol/vol) paraformaldehyde overnight and then embedded in paraffin. Sections were cut (5–7 µm thickness) and treated following the standard protocol for H&E staining. Immunostaining of sections was performed using a sodium citrate antigen retrieval protocol. Sections were blocked with 5% (vol/vol) goat serum and 0.25% Triton X-100 for at least 1 h at room temperature. Primary antibodies were diluted in PBS containing 5% (vol/vol) goat serum and then incubated overnight at 4 °C. Sections were washed with PBS and incubated with secondary antibody for 1 h at room temperature. Following secondary antibody incubation, sections were washed with PBS and mounted using Vectashield mounting medium containing DAPI (Vector Laboratories). A Nikon C1si confocal microscope was used to capture images. Image analysis was performed using ImageJ. The following antibodies were used for immunostaining and Western blot analysis: actin-HRP (Santa Cruz Biotechnology), Alexa Fluor 546 goat anti-mouse (Molecular Probes), GATA3 (R&D Systems), V5 mouse monoclonal antibody (Invitrogen), Zpo2 (Znf503; Sigma-Aldrich), and ZBTB32 (ROG; Santa Cruz Biotechnology).
MMP9.
EpH4.9 control or Zpo2-overexpressing cells were lysed and loaded on 10% (wt/vol) Ready Gel Zymogram gel (BioRad) using Zymogram sample buffer (Bio-Rad). The gel was processed using Zymogram Renaturation Buffer (BioRad) for 30 min at ambient temperature, followed by overnight incubation in Zymogram Development Buffer (Bio-Rad). Gels were visualized via Coomassie Brilliant Blue R-250 (Bio-Rad) staining for 1 h at room temperature, followed by Coomassie Brilliant Blue R-250 Destaining Solution (Bio-Rad).
Statistical Analysis.
Statistical analysis was conducted using Graph Pad Prism 4 software. Statistical significance between two groups was calculated using Student’s t test. A P value < 0.05 was considered to indicate statistical significance.
SI Materials and Methods
qRT-PCR Primers and ZBTB32 siRNA.
Primers for qRT-PCR were designed via the Harvard primer bank (https://pga.mgh.harvard.edu/primerbank/), as follows:
Zpo1 primer: 5′-TGAAGAGCCGCCACAGTCC-3′ (forward); 5′-TGAACCAGCACTCGGAAGGG-3′ (reverse)
Zpo2 primer: 5′-CAAGGTGCTGAAGATGCTGACG-3′ (forward); 5′-GAGAGTTTGGAA GAAGG CGAAGG-3′ (reverse)
E-cadherin primer: 5′-AGCTCTAAGGACAGTGGTCAT-3′ (forward); 5′-CAGTGCTTTACATTCCTCGGT-3′ (reverse)
GATA3 primer: 5′-GCGGGCTCTATCACAAAATGA-3′ (forward); 5′-GCCTTCGCTTGGGCTTAAT-3′ (reverse)
Snail primer: 5′-GGTCAAGAAACATTTCAACGCC-3′ (forward); 5′-GGTGAGGATCTCTGGTTTTGGTA-3′ (reverse)
Twist primer: 5′-CGGGTCATGGCTAAACGTG-3′ (forward); 5′-CGACTTGCCATCTTGGAGTC-3′ (reverse)
Vimentin primer: 5′-CGTCCACACGCACCTACAG-3′ (forward); 5′-GGGGGATGAGGAATAGAGGCT-3′ (reverse)
ZEB1 primer: 5′-GCTGGCAAGACAACGTGAAAG-3′ (forward); 5′-GCCTCAGGATAAATGACGGC-3′ (reverse)
ZEB2 primer: 5′-ATTGCACATCAGACTTTGAGGAA-3′ (forward); 5′-ATAATGGCCGTGTCGCTTCG-3′ (reverse)
ZBTB32 primer: 5′-GGTACAGTTAGCGGCTAGACT-3′ (forward); 5′-GGAAGGGCTTATGTCTTCAACC-3′ (reverse)
Mouse Zbtb32 siRNA is a pool of three target-specific siRNAs purchased from Santa Cruz Biotechnology (catalog no. sc-38356).
Acknowledgments
We thank Dr. I. Cheng Ho for the Zbtb32 construct; Dr. Hope Rugo (University of California, San Francisco) for the donation of tumor samples; and Vicki Plaks, Amy-Jo Casbon, Caroline Bonnans, Kai Kessenbrock, Ken Takai, and Elena Atamanuic for their support and intellectual discussions. This research was funded by National Cancer Institute Grants R01 CA180039 and R01 CA190851 (to Z.W.), and Traineeship T32 CA108462 (to P.S.). This work was supported by Taiwan Ministry of Science and Technology Grant 104-2917-I-006-002 (to C.W.), US Department of Defense Congressionally Directed Medical Research Program Postdoctoral Fellowship 11-1-0742 (to D.A.L.), and a Becas Chile Scholarship (H.G.V.).
Footnotes
The authors declare no conflict of interest.
This article contains supporting information online at www.pnas.org/lookup/suppl/doi:10.1073/pnas.1701690114/-/DCSupplemental.
References
- 1.Kouros-Mehr H, Slorach EM, Sternlicht MD, Werb Z. GATA-3 maintains the differentiation of the luminal cell fate in the mammary gland. Cell. 2006;127(5):1041–1055. doi: 10.1016/j.cell.2006.09.048. [DOI] [PMC free article] [PubMed] [Google Scholar]
- 2.Asselin-Labat ML, et al. Gata-3 is an essential regulator of mammary gland morphogenesis and luminal cell differentiation. Nat Cell Biol. 2007;9(2):201–209. doi: 10.1038/ncb1530. [DOI] [PubMed] [Google Scholar]
- 3.Kouros-Mehr H, Kim JW, Bechis SK, Werb Z. GATA-3 and the regulation of the mammary luminal cell fate. Curr Opin Cell Biol. 2008;20(2):164–170. doi: 10.1016/j.ceb.2008.02.003. [DOI] [PMC free article] [PubMed] [Google Scholar]
- 4.Cancer Genome Atlas N. Cancer Genome Atlas Network Comprehensive molecular portraits of human breast tumours. Nature. 2012;490(7418):61–70. doi: 10.1038/nature11412. [DOI] [PMC free article] [PubMed] [Google Scholar]
- 5.Bertucci F, et al. Gene expression profiling of primary breast carcinomas using arrays of candidate genes. Hum Mol Genet. 2000;9(20):2981–2991. doi: 10.1093/hmg/9.20.2981. [DOI] [PubMed] [Google Scholar]
- 6.Hoch RV, Thompson DA, Baker RJ, Weigel RJ. GATA-3 is expressed in association with estrogen receptor in breast cancer. Int J Cancer. 1999;84(2):122–128. doi: 10.1002/(sici)1097-0215(19990420)84:2<122::aid-ijc5>3.0.co;2-s. [DOI] [PubMed] [Google Scholar]
- 7.Mehra R, et al. Identification of GATA3 as a breast cancer prognostic marker by global gene expression meta-analysis. Cancer Res. 2005;65(24):11259–11264. doi: 10.1158/0008-5472.CAN-05-2495. [DOI] [PubMed] [Google Scholar]
- 8.Wilson BJ, Giguère V. Meta-analysis of human cancer microarrays reveals GATA3 is integral to the estrogen receptor alpha pathway. Mol Cancer. 2008;7:49. doi: 10.1186/1476-4598-7-49. [DOI] [PMC free article] [PubMed] [Google Scholar]
- 9.Parikh P, Palazzo JP, Rose LJ, Daskalakis C, Weigel RJ. GATA-3 expression as a predictor of hormone response in breast cancer. J Am Coll Surg. 2005;200(5):705–710. doi: 10.1016/j.jamcollsurg.2004.12.025. [DOI] [PubMed] [Google Scholar]
- 10.Yoon NK, et al. Higher levels of GATA3 predict better survival in women with breast cancer. Hum Pathol. 2010;41(12):1794–1801. doi: 10.1016/j.humpath.2010.06.010. [DOI] [PMC free article] [PubMed] [Google Scholar]
- 11.Jiang YZ, Yu KD, Zuo WJ, Peng WT, Shao ZM. GATA3 mutations define a unique subtype of luminal-like breast cancer with improved survival. Cancer. 2014;120(9):1329–1337. doi: 10.1002/cncr.28566. [DOI] [PubMed] [Google Scholar]
- 12.Asselin-Labat ML, et al. Gata-3 negatively regulates the tumor-initiating capacity of mammary luminal progenitor cells and targets the putative tumor suppressor caspase-14. Mol Cell Biol. 2011;31(22):4609–4622. doi: 10.1128/MCB.05766-11. [DOI] [PMC free article] [PubMed] [Google Scholar]
- 13.Kouros-Mehr H, et al. GATA-3 links tumor differentiation and dissemination in a luminal breast cancer model. Cancer Cell. 2008;13(2):141–152. doi: 10.1016/j.ccr.2008.01.011. [DOI] [PMC free article] [PubMed] [Google Scholar]
- 14.Perou CM, et al. Molecular portraits of human breast tumours. Nature. 2000;406(6797):747–752. doi: 10.1038/35021093. [DOI] [PubMed] [Google Scholar]
- 15.Dydensborg AB, et al. GATA3 inhibits breast cancer growth and pulmonary breast cancer metastasis. Oncogene. 2009;28(29):2634–2642. doi: 10.1038/onc.2009.126. [DOI] [PubMed] [Google Scholar]
- 16.Sorlie T, et al. Repeated observation of breast tumor subtypes in independent gene expression data sets. Proc Natl Acad Sci USA. 2003;100(14):8418–8423. doi: 10.1073/pnas.0932692100. [DOI] [PMC free article] [PubMed] [Google Scholar]
- 17.Ellis MJ, et al. Whole-genome analysis informs breast cancer response to aromatase inhibition. Nature. 2012;486(7403):353–360. doi: 10.1038/nature11143. [DOI] [PMC free article] [PubMed] [Google Scholar]
- 18.Gaynor KU, et al. GATA3 mutations found in breast cancers may be associated with aberrant nuclear localization, reduced transactivation and cell invasiveness. Horm Cancer. 2013;4(3):123–139. doi: 10.1007/s12672-013-0138-x. [DOI] [PMC free article] [PubMed] [Google Scholar]
- 19.Usary J, et al. Mutation of GATA3 in human breast tumors. Oncogene. 2004;23(46):7669–7678. doi: 10.1038/sj.onc.1207966. [DOI] [PubMed] [Google Scholar]
- 20.Nakamura M, Runko AP, Sagerström CG. A novel subfamily of zinc finger genes involved in embryonic development. J Cell Biochem. 2004;93(5):887–895. doi: 10.1002/jcb.20255. [DOI] [PubMed] [Google Scholar]
- 21.Slorach EM, Chou J, Werb Z. Zeppo1 is a novel metastasis promoter that represses E-cadherin expression and regulates p120-catenin isoform expression and localization. Genes Dev. 2011;25(5):471–484. doi: 10.1101/gad.1998111. [DOI] [PMC free article] [PubMed] [Google Scholar]
- 22.Sircoulomb F, et al. ZNF703 gene amplification at 8p12 specifies luminal B breast cancer. EMBO Mol Med. 2011;3(3):153–166. doi: 10.1002/emmm.201100121. [DOI] [PMC free article] [PubMed] [Google Scholar]
- 23.Reynisdottir I, et al. High expression of ZNF703 independent of amplification indicates worse prognosis in patients with luminal B breast cancer. Cancer Med. 2013;2(4):437–446. doi: 10.1002/cam4.88. [DOI] [PMC free article] [PubMed] [Google Scholar]
- 24.Shi Y, et al. The long noncoding RNA SPRY4-IT1 increases the proliferation of human breast cancer cells by upregulating ZNF703 expression. Mol Cancer. 2015;14:51. doi: 10.1186/s12943-015-0318-0. [DOI] [PMC free article] [PubMed] [Google Scholar]
- 25.Dorfman R, Glazer L, Weihe U, Wernet MF, Shilo BZ. Elbow and Noc define a family of zinc finger proteins controlling morphogenesis of specific tracheal branches. Development. 2002;129(15):3585–3596. doi: 10.1242/dev.129.15.3585. [DOI] [PubMed] [Google Scholar]
- 26.Hoyle J, Tang YP, Wiellette EL, Wardle FC, Sive H. nlz gene family is required for hindbrain patterning in the zebrafish. Dev Dyn. 2004;229(4):835–846. doi: 10.1002/dvdy.20001. [DOI] [PubMed] [Google Scholar]
- 27.Ko HA, Chen SY, Chen HY, Hao HJ, Liu FC. Cell type-selective expression of the zinc finger-containing gene Nolz-1/Zfp503 in the developing mouse striatum. Neurosci Lett. 2013;548:44–49. doi: 10.1016/j.neulet.2013.05.020. [DOI] [PubMed] [Google Scholar]
- 28.Shahi P, et al. The transcriptional repressor ZNF503/Zeppo2 promotes mammary epithelial cell proliferation and enhances cell invasion. J Biol Chem. 2015;290(6):3803–3813. doi: 10.1074/jbc.M114.611202. [DOI] [PMC free article] [PubMed] [Google Scholar]
- 29.Loi S, et al. Predicting prognosis using molecular profiling in estrogen receptor-positive breast cancer treated with tamoxifen. BMC Genomics. 2008;9:239. doi: 10.1186/1471-2164-9-239. [DOI] [PMC free article] [PubMed] [Google Scholar]
- 30.Ma XJ, et al. A two-gene expression ratio predicts clinical outcome in breast cancer patients treated with tamoxifen. Cancer Cell. 2004;5(6):607–616. doi: 10.1016/j.ccr.2004.05.015. [DOI] [PubMed] [Google Scholar]
- 31.Li Y, et al. Amplification of LAPTM4B and YWHAZ contributes to chemotherapy resistance and recurrence of breast cancer. Nat Med. 2010;16(2):214–218. doi: 10.1038/nm.2090. [DOI] [PMC free article] [PubMed] [Google Scholar]
- 32.Chou J, et al. GATA3 suppresses metastasis and modulates the tumour microenvironment by regulating microRNA-29b expression. Nat Cell Biol. 2013;15(2):201–213. doi: 10.1038/ncb2672. [DOI] [PMC free article] [PubMed] [Google Scholar]
- 33.Yan W, Cao QJ, Arenas RB, Bentley B, Shao R. GATA3 inhibits breast cancer metastasis through the reversal of epithelial-mesenchymal transition. J Biol Chem. 2010;285(18):14042–14051. doi: 10.1074/jbc.M110.105262. [DOI] [PMC free article] [PubMed] [Google Scholar]
- 34.Si W, et al. Dysfunction of the reciprocal feedback loop between GATA3- and ZEB2-nucleated repression programs contributes to breast cancer metastasis. Cancer Cell. 2015;27(6):822–836. doi: 10.1016/j.ccell.2015.04.011. [DOI] [PubMed] [Google Scholar]
- 35.Miaw SC, Choi A, Yu E, Kishikawa H, Ho IC. ROG, repressor of GATA, regulates the expression of cytokine genes. Immunity. 2000;12(3):323–333. doi: 10.1016/s1074-7613(00)80185-5. [DOI] [PubMed] [Google Scholar]
- 36.DeRose YS, et al. Tumor grafts derived from women with breast cancer authentically reflect tumor pathology, growth, metastasis and disease outcomes. Nat Med. 2011;17(11):1514–1520. doi: 10.1038/nm.2454. [DOI] [PMC free article] [PubMed] [Google Scholar]
- 37.Lawson DA, et al. Single-cell analysis reveals a stem-cell program in human metastatic breast cancer cells. Nature. 2015;526(7571):131–135. doi: 10.1038/nature15260. [DOI] [PMC free article] [PubMed] [Google Scholar]
- 38.Yagi R, Zhu J, Paul WE. An updated view on transcription factor GATA3-mediated regulation of Th1 and Th2 cell differentiation. Int Immunol. 2011;23(7):415–420. doi: 10.1093/intimm/dxr029. [DOI] [PMC free article] [PubMed] [Google Scholar]
- 39.Ranganath S, Murphy KM. Structure and specificity of GATA proteins in Th2 development. Mol Cell Biol. 2001;21(8):2716–2725. doi: 10.1128/MCB.21.8.2716-2725.2001. [DOI] [PMC free article] [PubMed] [Google Scholar]
- 40.Zhou M, et al. Friend of GATA-1 represses GATA-3–dependent activity in CD4+ T cells. J Exp Med. 2001;194(10):1461–1471. doi: 10.1084/jem.194.10.1461. [DOI] [PMC free article] [PubMed] [Google Scholar]


