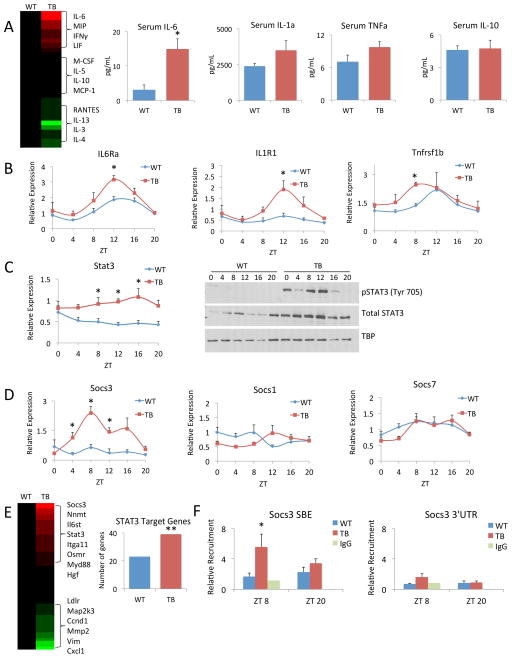
Figure 5. Lung tumor-induced inflammation in the liver.
A) Serum samples from WT and TB mice were assayed in an unbiased, multiplexed cytokine array platform and displayed as a heat map. Red indicates increased levels of cytokines and green indicates decreased cytokine levels in TB normalized to WT mouse serum. Specific profiles of pro-inflammatory cytokines (IL-6, IL-1α and TNFα) and anti-inflammatory IL-10 are shown. B) Gene expression as profiled by RT-PCR is shown for Il6rα, Il1r1 and Tnfrsf1b. C) Stat3 gene expression as shown by RT-PCR. Phospho-STAT3 (Tyr 705) and total STAT3 protein levels over the circadian cycle in WT and TB mice. D) Gene expression profiles of Socs3, Socs1 and Socs7 by RT-PCR. E) Known STAT3 target genes were compared to our transcriptomics data. Heat map displays gene expression profiles in the TB-specific group normalized to WT, with red and green representing up and down-regulated genes, respectively. Additionally, to determine enrichment of STAT3 target genes in WT and TB, Fisher’s exact test was used. The ** indicates the odds that the overlap of 39 genes in TB over random is 1.716 and the p-value is 0.00358, which satisfies a p<0.005 threshold. For WT the odds ratio is 1.345 with a p-value of 0.209. F) Recruitment of p-STAT3 to the STAT binding element (SBE) in the Socs3 promoter or to the 3′ untranslated region (UTR) as determined by chromatin immunoprecipitation (ChIP). Error bars indicate SEM. Significance was calculated using Student’s T test and * indicates a p-value cutoff of 0.05.

