Abstract
There is a need for research to rapidly determine an individual’s absorbed dose and its potential health effects after a potential radiological or nuclear event that could expose large portions of a population to ionizing radiation (IR). Studies on biomarker identification after radiation exposure could aid in biodosimetry, identifying individual dose absorbed, as well as biologic response, and administering immediate and proper medical care. Metabolomics on easily accessible biofluids is an emerging field with potential for high-throughput biodosimetry. While tremendous effort has been put into obtaining discovery based global radiation signatures from a number of biofluids and model organisms, quantitative targeted analysis on a subset of known radiation biomarkers is required to develop an optimized panel of biomarkers for future clinical applications. The current study analyzes levels of several known broad chemical groups (acylcarnitines, amino acids, phosphatidylcholines, and biogenic amines) affected by IR in serum from nonhuman primates (NHP) 7 days after exposure through multiple reaction monitoring (MRM) analysis with a triple quadrupole mass spectrometry (MS) platform. We identified several novel metabolites affected by IR exposure through univariate and unsupervised multivariate analyses. Levels of acylcarnitines, amino acids, and phospholipids were perturbed indicating altered protein metabolism, fatty acid β-oxidation, and inflammation. Fold changes in carnitine and short-chain acylcarnitines (acetylcarnitine, propionylcarnitine, butyrylcarnitine, and valerylcarnitine) complement previous global radiation signatures on NHP; notably, the levels of change were lower than previously observed in urine. Decreased levels of glutamate, citrulline, and arginine after IR are biomarkers indicating gastrointestinal syndrome and perturbations to the urea cycle. Sex differences were also assessed and were more prevalent in circulating acylcarnitines and phospholipids after IR exposure. These biomarkers may be combined with previously described compounds from DNA damage to develop a defined metabolomic biodosimetry panel to be analyzed by MS platforms, which are increasingly available in clinical laboratories.
Keywords: Targeted Metabolomics, Ionizing Radiation, Nonhuman Primates, Biodosimetry
Introduction
In 2007, the National Institute of Allergy and Infectious Diseases (NIAID) held a meeting in Washington, DC to discuss needed research to counteract potential threats from terrorist actions and accidents involving nuclear power plants/nuclear waste that could expose large portions of the population to ionizing radiation (IR).1 One goal that has been established to counteract potential threats is the development of high-throughput field based biodosimetry methods. Ideally, instrumentation could be developed to collect easily accessible biofluids (e.g., urine or serum) and quickly identify individuals requiring immediate medical care (e.g., cytokine therapy, bone marrow transplant). Metabolomics has emerged as a possible technology to aid high-throughput biodosimetry.
The field of radiation metabolomics began as initial global metabolomic discovery steps to create a biomarker database and to assess various differences in metabolism after radiation exposure. Immense effort has been put into developing this database using discovery metabolomics. Studies to date include metabolic changes using murine (serum, plasma, and urine), human (urine), and nonhuman primate (NHP) (urine, serum) models.2-21 While nuclear magnetic resonance (NMR) spectroscopy and gas chromatography (GC) mass spectrometry (MS) have been used in past studies, the more common analytical platform for performing de novo untargeted global radiation metabolomics has been liquid chromatography (LC) MS. The use of NMR suffers from lowered sensitivity and GC/MS may require lengthy derivatization protocols. Ions of interest particular to a specific disease state or altered condition are normally picked using a combination of multivariate and univariate statistics. In LC/MS platforms, a portion of these analytes are then ideally validated in samples by comparing to multiple orthogonal properties, commonly comparison of MS/MS fragmentation spectra to an authentic standard, retention time, and high accuracy m/z using identical analytical conditions.22
As these non-targeted global studies are required for initial biomarker discovery, quantitative targeted metabolomic methodology on subsets of radiation biomarkers must be further developed for future clinical use (Supp. Fig. 1). Once validation has been performed on a panel of select disease- or injury-specific analytes, quantitative targeted metabolomics is performed by adding appropriate internal standards and analyzing using selected ion recording (SIR) or multiple reaction monitoring (MRM) using a quadrupole MS detector. Single metabolites can often be representative of myriad disease conditions, thus determining extent of radiation exposure by metabolomic biodosimetry will likely require quantification of multiple analytes and biofluids or possibly computer algorithms designed to measure ratios of perturbed metabolites for the required specificity.11,23 Furthermore, the response of select analytes must be of a great enough fold change to be reasonably detected by current instrumentation. Analysis of low abundance metabolites requires additional sample preparation, such as solid-phase microextraction (SPME), adding time and negatively impacting a high-throughput workflow. As the current radiation biomarker library expands we will be able to determine a subset of ions for development of a high-throughput biodosimetry panel with optimized sample extraction and preparation, sample preservation, and detection with MS platforms.
While targeted approaches have been performed in murine models, few studies have used NHP models and these validated targeted studies were restricted to citrulline and retinoic acid while animals received supportive care.9,24-27 NHP models are advantageous to murine models due to higher genetic similarity to humans, which are the target for radiation countermeasures.28 To build upon our previous work developing metabolomic panels for biodosimetry, we performed targeted metabolomic analysis on NHP serum for five broad chemical classes determined through “discovery” phase experiments that are affected by IR exposure.20,21 Since previous studies have implicated changes in concentrations of amino acids, acylcarnitines, lipids, and biogenic amines after IR exposure, we chose the Biocrates AbsoluteIDQ® p180 Kit due to its specificity to quantify these broad chemical classes. We found several novel acylcarnitine, phosphatidylcholine (PC), and amino acid compounds perturbed by IR exposure in an NHP model 7 days post-IR. These compounds may possibly be combined with other purine/pyrimidine analytes indicative of DNA damage to create a panel for assessing exposure to IR. Research on radiation metabolomics for biodosimetry directly addresses NIAID’s Radiation Biodosimetry Research and Development Goals.1
Experimental
Chemicals
All reagents were LC/MS grade (Fisher Scientific, Hanover Park, IL). All materials for the Biocrates AbsoluteIDQ® p180 Kit were purchased from Biocrates Life Science AG (Innsbruck, AUT).
NHP system
The study animals, experimental treatment, and biofluid collection have been previously described.20,21 Briefly, Rhesus monkeys (Macaca mulatta) were maintained in an accredited AAALAC facility. Purified water was provided ad libitum, certified chow (Tekland Certified Hi-Fiber Primate Diet no. 7195C; Harlan Laboratories, Madison, WI) was provided twice daily and enrichment was provided daily as per facility’s enrichment program. Room environment was continuously controlled (21°±3 Celsius; 30-70% humidity; 12 hours light/dark cycle) with twelve (12) air changes per hour using a HEPA system. Animals received a single total body irradiation (TBI) (exposure dose rate: ~ 0.6 Gy/min-60Co γ source). Animals received all proper medications and animal handling procedures were approved by the Institutional Animal Care and Use Committee. Animals per treatment received 2, 4, 6, 7, or 10 Gy TBI and buprenorphine as analgesia (2, 6, 4, 7 Gy n=12; control, 10 Gy n=11). Half of the animals were male and half female. Biofluids were collected on day 7. Serum was collected via the abdominal aorta (0.5 mL each after morning meal), aliquoted, and stored at −70°C until shipment on dry ice to Georgetown University Medical Center.
Targeted metabolomic profiling
NHP serum samples were prepared for analysis by the Biocrates AbsoluteIDQ® p180 Kit according to the manufacturer’s instructions. The AbsoluteIDQ® p180 Kit allows for quantification of 188 metabolites from 5 broad compound classes (sphingolipids, PCs, glucose, acylcarnitines, biogenic amines, and amino acids) and sample preparation has been described in detail.9,29,30 Briefly, 10 μl serum per sample was added to a 96-well plate for derivatization (with phenylisothiocyanate) and sample cleanup by SPME. Blanks, internal standards, quality control samples, and standard curves were all prepared per manufacturer’s instructions and were injected with samples into a Waters ACQUITY ultra-performance liquid chromatography (UPLC) coupled to a Xevo® TQ-S mass spectrometer (MS) (column-BEH C18 1.7 μm 2.1 × 50 mm). Samples were run in positive or negative ionization mode and acquired in either LC MS/MS or flow injection analysis (FIA) mode as previously described.9 Data was processed with MetIQ software and analyzed with a Kruskal-Wallis test (P value < 0.05)and a post-hoc Duncan test in SAS 9.4 (Cary, NC, USA), persistent outliers were assessed and removed, and a singular value decomposition based principal component analysis (PCA) was conducted. A volcano plot (with false discovery rate [FDR] corrected P values [using Benjamini-Hochberg step-up correction procedure]) and heatmap were generated with the in-house software MetaboLyzer on complete presence ions (≥70% presence).31 Data was graphed using GraphPad Prism 6 (GraphPad Software, Inc., La Jolla, CA). Differences in significant ion trends were compared between sexes at control vs. 10 Gy with a Mann-Whitney U test (P value < 0.05).
Results and discussion
Targeted metabolomics for potential high-throughput biodosimetry
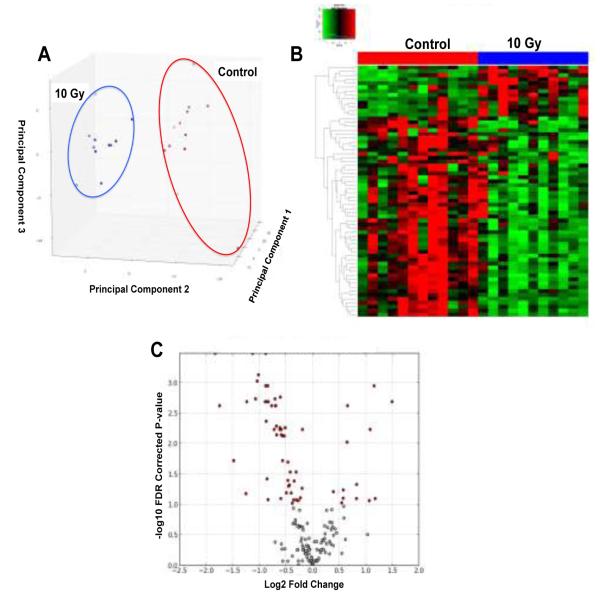
In this study, we performed targeted metabolomics on NHP serum and determined changes in several broad chemical classes (i.e., amino acids, acylcarnitines, and PCs) using the AbsoluteIDQ® p180 Kit, which specifically quantifies certain chemical groups perturbed from IR exposure. In addition, the 96-well format of the AbsoluteIDQ® p180 Kit lends itself to future robotic automation of sample preparation for high-throughput analysis. Data was initially processed with MetIQ software. Analytes flagged as below limits of quantification or detection were removed. The remaining analytes were compared with a multivariate PCA and Kruskal-Wallis test on individual ions to filter ions based on statistical significance (P-value < 0.05). Groups were readily separated by an unsupervised PCA and significant differences in circulating metabolites were highlighted with a heatmap, as represented by the specific analysis of control compared to the 10 Gy group (Fig. 1A,B). A volcano plot represents log2 fold-change vs. significance (−log10 FDR corrected P-value) to further illustrate significant ions (Fig. 1C). Several novel IR induced biomarkers were detected along with markers previously identified in NHP and murine models.
Fig. 1.
Multivariate data analysis of targeted metabolomics on serum from NHPs exposed to IR. Comparison of control group to 10 Gy IR exposed NHPs. A) Unsupervised PCA scores plot indicates groups are clearly separated along principal components 1 and 2. B) Heatmap and C) Volcano plot (red dots) shows statistically significant differences between the control and 10 Gy group. Heatmap and volcano plot were generated by the in-house software MetaboLyzer and highlight differences between groups.
Previous studies on mouse and NHP serum have indicated major shifts in lipid profiles and increases in carnitine and acylcarnitines after IR exposure similar to the current study.9,21,32 These results complement our previous work defining global metabolomic signatures of NHP urine and serum, which strongly indicate 7 days post-IR several perturbations to protein metabolism, fatty acid β-oxidation, steroid hormone synthesis, purine metabolism, and taurine metabolism.20,21 Together, these data provide a quantitative library of IR related biomarkers that may be used for biodosimetry in the event of a nuclear or radiological incident.
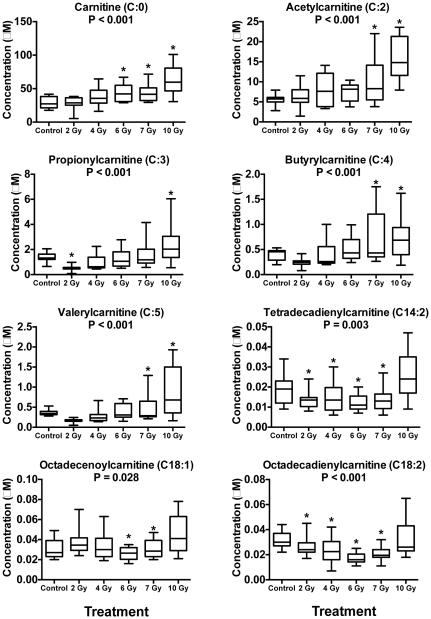
As carnitine and acylcarnitines are commonly implicated biomarkers after IR exposure, as we have previously demonstrated18,20, we quantitatively analyzed 40 different molecular species, of which 20 were detected. A total of 8 acylcarnitines, 9 amino acids, and 36 PCs and ether-linked PCs (ePCs) significantly changed after exposure to IR (Fig. 2-3, Table 1, Supp. Table 1-2). Carnitine and several short chain acylcarnitines (acetylcarnitine [C:2], propionylcarnitine [C:3], butyrylcarnitine [C:4], and valerylcarnitine [C:5]) increased in concentration after exposure to all doses of IR (Fig. 2). Longer chain acylcarnitines (tetradecadienylcarnitine [C14:2], octadecenoylcarnitine [C18:1], and octadecadienylcarnitine [C18:2]) decreased at lower levels of IR exposure, with slightly higher concentrations at 10 Gy compared to the control.
Fig. 2.
Dose response of carnitine and several acylcarnitines in NHP serum exposed to 2, 4, 6, 7, or 10 Gy γ radiation (box and whisker plots). Statistical significance indicating a dose response was determined with a Kruskal-Wallis test (P < 0.05; 2, 6, 4, 7 Gy n=12; control, 10 Gy n=11) and a post-hoc Duncan test. Short-chain acylcarnitines increase significantly in concentration in a dose dependent manner while longer-chain acylcarnitines have slightly lower concentration at 2, 4, 6, and 7 Gy, but show no change at 10 Gy with respect to control. (* signifies significantly different from control determined by post-hoc Duncan test)
Fig. 3.
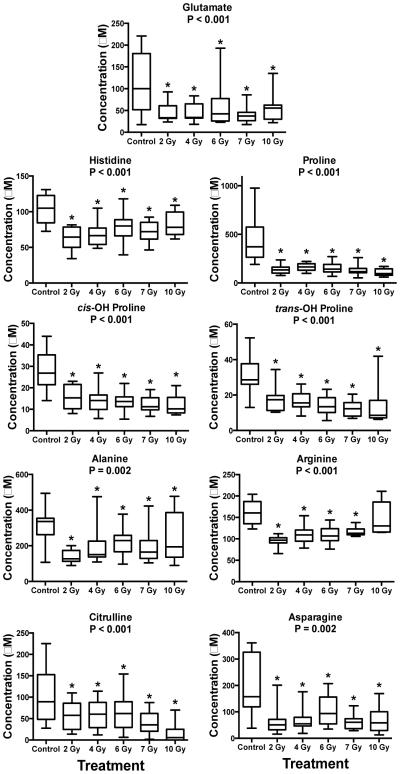
Dose response of amino acids in NHP serum exposed to 2, 4, 6, 7, or 10 Gy γ radiation (box and whisker plots). Statistical significance indicating a dose response was determined with a Kruskal-Wallis test (P < 0.05; 2, 6, 4, 7 Gy n=12; control, 10 Gy n=11) and a post-hoc Duncan test. All amino acids decreased in concentration after IR exposure. (* signifies significantly different from control determined by post-hoc Duncan test)
Table 1.
Blood biomarker discovery (not including lipids) in NHPs after exposure to radiation.
| Broad Chemical Class |
Metabolite | HMDB Identifier |
Trend after IR Exposure |
|---|---|---|---|
| Carnitine and Acylcarnitines |
Carnitine* | HMDB 00062 |
↑ |
| Acetylcarnitine* | HMDB 00201 |
↑ | |
| Propionylcarnitine | HMDB 00824 |
↑ | |
| Butyrylcarnitine* | HMDB 02013 |
↑ | |
| Valerylcarnitine | HMDB 13128 |
↑ | |
| Tetradecadienylcarnitine | HMDB 13331 |
↓ | |
| Octadecenoylcarnitine | HMDB 13338 |
↓ | |
| Octadecadienylcarnitine | HMDB 06469 |
↓ | |
| Amino Acids | Glutamate* | HMDB 03339 |
↓ |
| Histidine | HMDB 00177 |
↓ | |
| Proline* | HMDB 00162 |
↓ | |
| cis-OH Proline | HMDB 60460 |
↓ | |
| trans-OH Proline | HMDB 00725 |
↓ | |
| Alanine | HMDB 00161 |
↓ | |
| Arginine | HMDB 00517 |
↓ | |
| Citrulline* | HMDB 00904 |
↓ | |
| Asparagine | HMDB 00168 |
↓ |
Carnitine was present in the highest abundance followed by acetylcarnitine (C:2), propionylcarnitine (C:3), butyrylcarnitine (C:4), and valerylcarnitine (C:5) respectively (Fig. 2). Disturbance to short chain acylcarnitines indicate inhibition of fatty acid β-oxidation. Free fatty acids (FFAs) are shuttled into the mitochondrial matrix through a complex series of enzymes that convert FFAs into acyl-CoAs that bind to carnitine, thus producing longer-chain acylcarnitines.33 In addition to being important in fatty acid β-oxidation, carnitine and acylcarnitines play roles in ketosis and delivery of acyl groups throughout the body.34 While short-chain acylcarnitines clearly increase in a dose-dependent manner, long-chain acylcarnitines do not show increased levels until 10 Gy and actually decrease at lower doses (Fig. 2). Short-chain acylcarnitines are efficient delivery mechanisms due in part to their small size. Long-chain acylcarnitines are not readily transportable and may be unable to pass easily through the plasma or mitochondrial membrane. Excretion of these small-chain acylcarnitines may be more efficient, hence, their higher concentrations in serum and urine after IR exposure compared to long-chain acylcarnitines. Conversely, increases of long-chain acylcarnitines at higher IR doses may be due to increased IR induced apoptosis of bone marrow during hematopoietic syndrome.35 Carnitine, acetylcarnitine, and butyrylcarnitine were also found to increase in NHP urine.20 Carnitine and acylcarnitine fold changes in urine were much higher than were observed in serum.20,21 Comparing the control vs. 10 Gy groups, carnitine (66.2 fold change urine; 2.2 fold change serum), acetylcarnitine (137.4 fold change urine; 2.8 fold change serum), and butyrylcarnitine (4.9 fold change urine; 2.0 fold change serum) all showed more promising increases, making urine a more suitable biofluid to detect acylcarnitines after IR exposure (Fig. 2). A similar fold change in carnitine was observed in a global metabolomic study of these serum samples, where carnitine had a 2.1 fold increase between the control and 10 Gy group.21
PCs are a ubiquitous group of lipids, the most abundant group of glycerophospholipids (GPs) found circulating in blood, and a principle component of cellular membranes. PCs are found as diacyl compounds, monoacyl compounds (lysophosphatidylcholines [LPCs]) and ether-linked PCs (ePCs), commonly known as plasmalogens if containing a sn-1 ether linkage.36 Exposure to IR is known to cause perturbations to diacyl PCs and ePCs, usually due to increased presence of reactive oxygen species (ROS) after IR exposure.37. The most abundant PCs and ePCs detected in NHP serum were 36 and 38 C molecules. Of the PCs and ePCs that significantly changed, 24 were reduced in concentration after IR exposure (Supp. Table 1-2). PCs with more than 36 C are normally components of the cell membrane and the decrease in concentration could represent poorer membrane condition. Ten compounds were found in lower concentration at 2, 4, 6, and 7 Gy, but increased to concentrations equal to the control at 10 Gy exposures (Supp. Table 2). Interestingly, many compounds that increased at 10 Gy were present in high abundance in proportion to other lipid compounds and were relatively highly unsaturated (PC 36:4, 38:4, 38:5, 38:6, 40:6, ePC 38:4, 38:5). Two compounds (ePC 40:3 and 40:5) significantly increased at 10 Gy exposure compared to the other groups (Supp. Table 2). These relatively longer chain highly unsaturated compounds have been observed to increase in the 10 Gy group in a separate study using global metabolomics.21
The primary pathway for PC begins through the sn-glycerol-3-phosphate pathway for the production of diacylglyceride (DG).38-40 Diacylglycerol cholinephosphotransferase (EC:2.7.8.2) combines cytidine diphosphate (CDP) choline with DG producing a diacyl PC. Unlike PC synthesis, the initial synthesis of ePCs begins in peroxisomes where dihydroxyacetone phosphate and a long-chain acyl-CoA ester are esterified. Alkylglycerone-phosphate synthase (EC:2.5.1.26) catalyzes the reaction to replace the acyl chain with an alcohol, thus forming an ether bond. The initial ePC pathway differs from the sn-glycerol-3-phosphate pathway used for triacylglycerides, PC, and phosphatidylethanolamine synthesis. The ePCs have lower disassociation energies and are oxidized more easily than diacyl PCs, making them important antioxidants.
Radiation toxicity is principally due to ROS created from hydrolysis of water and a pro-inflammatory host response.37 Clustered hydroxyl radicals generated by the ionization track can damage DNA producing highly toxic double strand breaks. IR reacts with water to induce production of ROS (O2•−, H•, •OH, and H2O2) that can interact with cellular lipid bilayers leading to lipid peroxidation.41,42 While these ROS have long been known as damaging to DNA, lipid molecules of cellular membranes and proteins are prime targets for degradation as well.43,44 Increases in lipid peroxidation markers have been observed due to ROS propagation 2-10 days post-IR, which would make the current 7 day post-IR an optimal time point for observing ROS damage.45 Increases in select polyunsaturated lipids were observed from global profiling and were attributed to increases in 20:4 (arachidonic acid) and 22:6 (docosahexaenoic acid), indicating a potential enzymatic inflammatory response.21 In addition to enzymatic products, nonenzymatic phospholipid products, such as GP endoperoxides and hydroperoxides, can also contribute to inflammation and signal apoptosis.46 Clearly, the ratios and roles of PCs and ePCs are important during recovery from IR exposure and warrant further research.
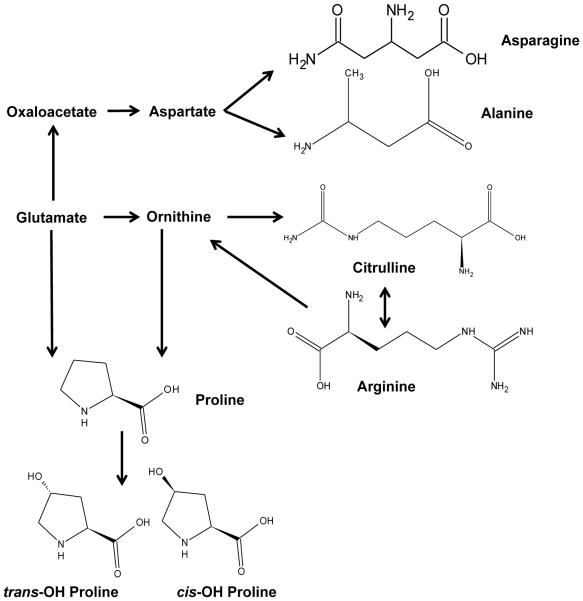
Nine amino acids decreased in concentration due to IR exposure (Fig. 2, Table 1). Similar to DNA and lipids, proteins and amino acids are susceptible to damage by ROS generated after IR exposure and amino acid supplements have been suggested as radiation mitigators to increase electrolyte absorption.47,48 One essential and 8 non-essential amino acids decreased in concentration (histidine, proline, cis-OH proline, trans-OH proline, alanine, arginine, citrulline, asparagine, glutamate) (Fig. 3, 4). Of these, histidine is an essential amino acid and the decrease may be diet related. While proline, methionine, and lysine are prone to oxidation, decreases in essential amino acids such as histidine can be especially problematic.49 Histidine is an important molecule in hemoglobin stability and decreases may affect oxygen transport. In a previous study on mouse serum, serine and aspartic acid significantly increased after exposure to 8 Gy IR (LD50/30 value) and citrulline decreased.9 Altered blood and jejunum citrulline levels are an indication of gastrointestinal syndrome and validated methodology for its detection across multiple species has been described.24-27 Decreases in glutamate, citrulline, and arginine may also indicate damage to the urea cycle and possible liver damage.50 Other studies on mice have indicated changes in valine in serum and isoleucine/leucine in urine.3,4 Decreased glutamate was observed in mouse urine after exposure to the internal emitter 90Sr, which is a starting compound for amino acid biosynthesis (Fig. 4).5 Global metabolomics of NHP serum indicated decreased concentrations of valine, proline, and tyrosine.21 Deficiencies in amino acid levels may lead to decreased protein synthesis, which can negatively impact immune function, the gastrointestinal tract, and overall metabolic syndrome.51-53
Fig. 4.
Biochemical pathway for amino acid synthesis. Biosynthesis of non-essential amino acids was decreased after exposure to IR.
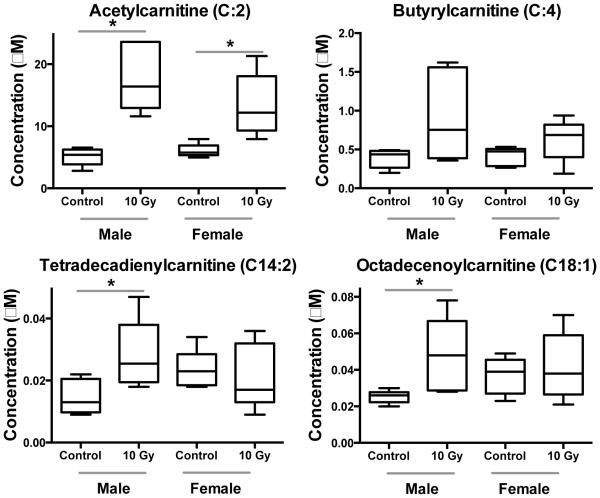
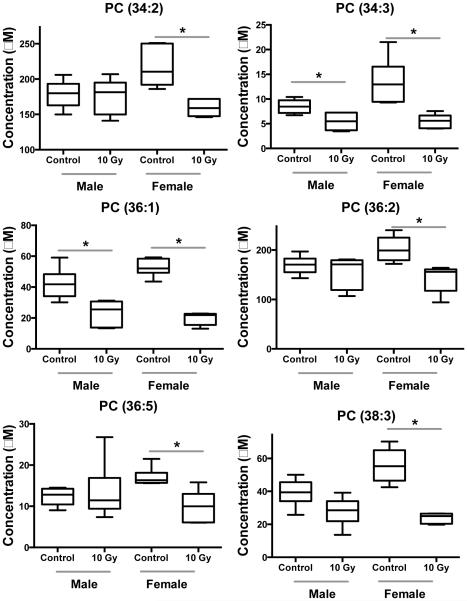
Differences between sexes were observed, as has been noted in other studies.18,20 In NHP urine, males had higher fold changes of carnitine, acetylcarnitine, xanthine, and xanthosine than females (Fig. 5, Table 2).20 As previously described, acetylcarnitine, trimethyl-L-lysine (a precursor for carnitine synthesis), hypoxanthine, xanthine, and uric acid showed different excretion patterns between sexes in urine from humans exposed to total body irradiation.18 Here, by utilizing a targeted metabolomic approach we identified additional acylcarnitines that are present in low amounts in serum and show similar patterns. Butyrylcarnitine, tetradecadienylcarnitine, and octadecenoylcarnitine all exhibit lower fold changes in females than males (Fig. 5, Table 2). These results combined with past work indicate sex differences in perturbations to fatty acid β-oxidation and lower concentrations of acylcarnitines in serum after IR exposure, however, acylcarnitines have been implicated in the activation of proinflammatory signaling pathways.54 Additionally, we determined that serum PC concentration was significantly reduced in females, but not to the same extent in males (Fig. 6, Table 2). While fatty acid β-oxidation may be less affected in females, the effects of oxidative stress may be greater as observed by lowered PC concentration and higher xanthine and hypoxanthine levels seen in past studies.18,20 Differences between sexes should be further explored for metabolomics based biodosimetry.
Fig. 5.
Dose response of acylcarnitines between male and female NHP serum exposed to 10 Gy γ radiation (* signifies P < 0.05 by Mann-Whitney U test). Similar to urine, males have a higher fold change of serum acetylcarnitine than females after exposure to IR. This targeted approach indicates that other acylcarnitines present at lower concentrations (i.e., not detected by previous nontargeted UPLC/MS methods) show similar trends to more abundant acylcarnitines.
Table 2.
Fold change and P-value for acylcarnitines and PCs that show differential response in serum after exposure to IR (values from control vs. 10 Gy compared with a Mann-Whitney U test).
| Compound | Male | Female | ||
|---|---|---|---|---|
| Fold Change |
P-value | Fold Change |
P-value | |
| Acetylcarnitine (C:2) | 3.4 | 0.002 | 2.2 | 0.008 |
| Butyrylcarnitine (C:4) | 2.3 | 0.132 | 1.5 | 0.151 |
| Tetradecadienylcarnitine (C14:2) | 2.0 | 0.017 | 0.9 | 0.508 |
| Octadecanoylcarnitine (C18:1) | 1.9 | 0.009 | 1.1 | 0.944 |
| PC (34:2) | 1.0 | 0.909 | 0.7 | 0.004 |
| PC (34:3) | 0.6 | 0.015 | 0.4 | 0.004 |
| PC (36:1) | 0.6 | 0.009 | 0.4 | 0.004 |
| PC (36:2) | 0.9 | 0.788 | 0.7 | 0.004 |
| PC (36:5) | 1.1 | 0.675 | 0.6 | 0.017 |
| PC (38:3) | 0.7 | 0.065 | 0.4 | 0.004 |
Fig. 6.
Dose response of PCs between male and female NHP serum exposed to 10 Gy γ radiation (* signifies P < 0.05 by Mann-Whitney U test). These PCs are in relatively higher concentration compared to other phospholipid species. Females show a greater decrease in serum PC concentration.
Conclusions
IR exposure induces a consistent change to the metabolome yielding markers indicative of perturbations of protein metabolism, fatty acid β-oxidation, protein/ purine/ taurine metabolism, and steroid hormone synthesis. These studies directly address NIAIDs goals set forth by the Radiation and Nuclear Countermeasures Program, where radiation specific biomarkers may be used for biodosimetry in the event of a nuclear disaster or radiological event. As immense effort has been put into developing global radiation signatures and cataloging validated biomarkers, quantitative targeted approaches are needed in the future. Acylcarnitines, lipids, and amino acids perturbations (with high fold changes) are commonly implicated after IR exposure and will provide valuable clinical biomarkers in the future that are useful for clinical applications. However, responses were determined to be different between males and females (acetylcarnitine, butyrylcarnitine, tetradecadienylcarnitine, octadecenoylcarnitine, and the phospholipids PC [34:2], [34:3], [36:1], [36:2], [36:5], [38:3]) in this study, complicating biodosimetry efforts and therefore warranting the need for development of radiation specific signatures based on sex or secondary injury.8 Previous studies have highlighted the importance of determining sex differences on biomarker patterns (e.g. carnitine, acetylcarnitine, xanthosine, trimethyl-l-lysine).18,20 Other biomarkers (not yet determined to show sex differences) of DNA damage (deaminated purines and pyrimidines)6,15 and radiation exposure (e.g., retinoic acid, taurine, acylglycines, tricarboxylic acid cycle intermediates, and oxylipins)3-5,9,19,25,32 may be combined with reliable biomarkers identified in this study (acylcarnitines and amino acids)5,18,20-21,24-27 with the goal of developing a biodosimetry panel that can be analyzed by MS platforms, in combination with previously established biodosimetry methods.27,55 While serum is an ideal candidate biofluid for detecting lipid and amino acid biomarkers by UPLC/MS, urine may be more suitable for acylcarnitine detection. GC/MS is a complementary analytical platform for nontargeted amino acid and organic acid detection in both serum and urine, and remains an area for future studies.56 Further work should also focus on development of field-deployable instrumentations to reduce processing time in the field after a nuclear or radiological incident.57
Supplementary Material
Acknowledgements
Funding was provided by the National Institutes of Health (National Institute of Allergy and Infectious Diseases) grant 1R01AI101798 (P.I. Albert J. Fornace, Jr.) and Lombardi Comprehensive Cancer Proteomics and Metabolomics Shared Resource (PMSR); partial support National Cancer Institute grant P30CA051008 (P.I. Louis Weiner). The authors acknowledge Lombardi Comprehensive Cancer Proteomics and Metabolomics Shared Resource (PMSR) for data acquisition. Content is the responsibility of authors and does not necessarily represent official views of NCI/NIH.
References
- 1.DiCarlo AL, Ramakrishnan N, Hatchett RJ. Health Phys. 2010;98:863–867. doi: 10.1097/HP.0b013e3181a6ee32. [DOI] [PMC free article] [PubMed] [Google Scholar]
- 2.Mak TD, Laiakis EC, Goudarzi M, Fornace AJ. Anal Chem. 2015;87:3177–3186. doi: 10.1021/ac504012a. [DOI] [PMC free article] [PubMed] [Google Scholar]
- 3.Goudarzi M, Weber W, Mak TD, Chung J, Doyle-Eisele M, Melo D, Brenner DJ, Guilmette RA, Fornace AJ. Radiat Res. 2014;181:54–64. doi: 10.1667/RR13479.1. [DOI] [PMC free article] [PubMed] [Google Scholar]
- 4.Goudarzi M, Mak TD, Chen C, Smilenov LB, Brenner DJ, Fornace AJ. Radiat Environ Biophys. 2014;53:645–657. doi: 10.1007/s00411-014-0558-1. [DOI] [PMC free article] [PubMed] [Google Scholar]
- 5.Goudarzi M, Weber WM, Mak TD, Chung J, Doyle-Eisele M, Melo DR, Strawn SJ, Brenner DJ, Guilmette RA, Fornace AJ. Radiat Res. 2015;183:665–674. doi: 10.1667/RR14011.1. [DOI] [PMC free article] [PubMed] [Google Scholar]
- 6.Johnson CH, Patterson AD, Krausz KW, Lanz C, Kang DW, Luecke H, Gonzalez FJ, Idle JR. Radiat Res. 2011;175:473–484. doi: 10.1667/RR2437.1. [DOI] [PMC free article] [PubMed] [Google Scholar]
- 7.Khan AR, Rana P, Devi MM, Chaturvedi S, Javed S, Tripathi RP, Khushu S. Int J Radiat Biol. 2011;87:91–97. doi: 10.3109/09553002.2010.518211. [DOI] [PubMed] [Google Scholar]
- 8.Laiakis EC, Hyduke DR, Fornace AJ. Radiat Res. 2012;177:187–199. doi: 10.1667/rr2771.1. [DOI] [PMC free article] [PubMed] [Google Scholar]
- 9.Laiakis EC, Strassburg K, Bogumil R, Lai S, Vreeken RJ, Hankemeier T, Langridge J, Plumb RS, Fornace AJ, Astarita G. J Proteome Res. 2014;13:4143–4154. doi: 10.1021/pr5005295. [DOI] [PMC free article] [PubMed] [Google Scholar]
- 10.Lanz C, Patterson AD, Slavik J, Krausz KW, Ledermann M, Gonzalez FJ, Idle JR. Radiat Res. 2009;172:198–212. doi: 10.1667/RR1796.1. [DOI] [PMC free article] [PubMed] [Google Scholar]
- 11.Mak TD, Tyburski JB, Krausz KW, Kalinich JF, Gonzalez FJ, Fornace AJ. Metabolomics. 2014;11:1082–1094. doi: 10.1007/s11306-014-0765-4. [DOI] [PMC free article] [PubMed] [Google Scholar]
- 12.Broin PÓ, Vaitheesvaran B, Saha S, Hartil K, Chen EI, Goldman D, Fleming WH, Kurland IJ, Guha C, Golden A. Int J Radiat Oncol Biol Phys. 2015;91:360–367. doi: 10.1016/j.ijrobp.2014.10.023. [DOI] [PMC free article] [PubMed] [Google Scholar]
- 13.Tang X, Zheng M, Zhang Y, Fan S, Wang C. Metabolomics. 2013;9:853–863. [Google Scholar]
- 14.Tyburski JB, Patterson AD, Krausz KW, Slavik J, Fornace AJ, Jr, Gonzalez FJ, Idle JR. Radiat Res. 2008;170:1–14. doi: 10.1667/RR1265.1. [DOI] [PMC free article] [PubMed] [Google Scholar]
- 15.Tyburski JB, Patterson AD, Krausz KW, Slavik J, Fornace AJ, Jr, Gonzalez FJ, Idle JR. Radiat Res. 2009;172:42–57. doi: 10.1667/RR1703.1. [DOI] [PMC free article] [PubMed] [Google Scholar]
- 16.Zhang Y, Zhou X, Li C, Wu J, Kuo JE, Wang C. Mol Biosyst. 2014;10:1441–1449. doi: 10.1039/c3mb70526a. [DOI] [PubMed] [Google Scholar]
- 17.Laiakis EC, Strassburg K, Bogumil R, Lai S, Vreeken RJ, Hankemeier T, Langridge J, Plumb RS, Fornace AJ, Astarita G. Radiat Prot Dosimetry. 2013;154:9–17. doi: 10.1021/pr5005295. [DOI] [PMC free article] [PubMed] [Google Scholar]
- 18.Laiakis EC, Mak TD, Anizan S, Amundson SA, Barker CA, Wolden SL, Brenner DJ, Fornace AJ., Jr Radiat Res. 2014;181:350–361. doi: 10.1667/RR13567.1. [DOI] [PMC free article] [PubMed] [Google Scholar]
- 19.Johnson CH, Patterson AD, Krausz KW, Kalinich JF, Tyburski JB, Kang DW, Luecke H, Gonzalez FJ, Blakely WF, Idle JR. Radiat Res. 2012;178:328–340. doi: 10.1667/rr2950.1. [DOI] [PMC free article] [PubMed] [Google Scholar]
- 20.Pannkuk EL, Laiakis EC, Authier S, Wong K, Fornace AJ., Jr Radiat Res. 2015;184:121–131. doi: 10.1667/rr14091.1. [DOI] [PMC free article] [PubMed] [Google Scholar]
- 21.Pannkuk EL, Laiakis EC, Mak TD, Astarita G, Authier S, Wong K, Fornace AJ. Metabolomics. 2016 doi: 10.1007/s11306-016-1010-0. DOI:10.1007/s11306-016-1010-0. [DOI] [PMC free article] [PubMed] [Google Scholar]
- 22.Sumner LW, Amberg A, Barrett D, Beale MH, Beger R, Daykin CA, Fan TW, Fiehn O, Goodacre R, Griffin JL, Hankemeier T, Hardy N, Harnly J, Higashi R, Kopka J, Lane AN, Lindon JC, Marriott P, Nicholls AW, Reily MD, Thaden JJ, Viant MR. Metabolomics. 2007;3:211–221. doi: 10.1007/s11306-007-0082-2. [DOI] [PMC free article] [PubMed] [Google Scholar]
- 23.Flanagan JL, Simmons PA, Vehige J, Willcox MD, Garrett Q. Nutr Metab (Lond) 2010;7:30. doi: 10.1186/1743-7075-7-30. [DOI] [PMC free article] [PubMed] [Google Scholar]
- 24.Jones JW, Tudor G, Bennett A, Farese AM, Moroni M, Booth C, MacVittie TJ, Kane MA. Anal Bioanal Chem. 2014;406:4663–4675. doi: 10.1007/s00216-014-7870-0. [DOI] [PubMed] [Google Scholar]
- 25.Jones JW, Scott AJ, Tudor G, Xu PT, Jackson IL, Vujaskovic Z, Booth C, MacVittie TJ, Ernst RK, Kane MA. Health Phys. 2014;106:106–119. doi: 10.1097/HP.0b013e3182a4ed3b. [DOI] [PMC free article] [PubMed] [Google Scholar]
- 26.Jones JW, Tudor G, Li F, Tong Y, Katz B, Farese AM, MacVittie TJ, Booth C, Kane MA. Health Phys. 2015;109:452–465. doi: 10.1097/HP.0000000000000346. [DOI] [PMC free article] [PubMed] [Google Scholar]
- 27.Jones JW, Bennett A, Carter CL, Tudor G, Hankey KG, Farese AM, Booth C, MacVittie TJ, Kane MA. Health Phys. 2015;109:440–451. doi: 10.1097/HP.0000000000000347. [DOI] [PMC free article] [PubMed] [Google Scholar]
- 28.Laiakis EC, Pannkuk EL, Diaz-Rubio ME, Wang YW, Mak TD, Simbulan-Rosenthal CM, Brenner DJ, Fornace AJ. Mutat Res. 2016 doi: 10.1016/j.mrfmmm.2016.03.003. [DOI] [PMC free article] [PubMed] [Google Scholar]
- 29.Laiakis E, Bogumil R, Roehring C, Daxboeck M, Lai S, Breit M, Shockcor J, Cohen S, Langridge J, Fornace AJ, Jr, Astarita G. Waters Application Note. 2013:1–8. [Google Scholar]
- 30.Mapstone M, Cheema AK, Fiandaca MS, Zhong X, Mhyre TR, MacArthur LH, Hall WJ, Fisher SG, Peterson DR, Haley JM, Nazar MD, Rich SA, Berlau DJ, Peltz CB, Tan MT, Kawas CH, Federoff HJ. Nat Med. 2014;20:415–418. doi: 10.1038/nm.3466. [DOI] [PMC free article] [PubMed] [Google Scholar]
- 31.Mak TD, Laiakis EC, Goudarzi M, Fornace AJ. Anal Chem. 2014;86:506–513. doi: 10.1021/ac402477z. [DOI] [PMC free article] [PubMed] [Google Scholar]
- 32.Goudarzi M, Weber WM, Mak TD, Chung J, Doyle-Eisele M, Melo DR, Brenner DJ, Guilmette RA, Fornace AJ. J Proteome Res. 2015;14:374–384. doi: 10.1021/pr500913n. [DOI] [PMC free article] [PubMed] [Google Scholar]
- 33.Houten SM, Wanders RJ. J Inherit Metab Dis. 2010;33:469–477. doi: 10.1007/s10545-010-9061-2. [DOI] [PMC free article] [PubMed] [Google Scholar]
- 34.Jones LL, McDonald DA, Borum PR. Prog Lipid Res. 2010;49:61–75. doi: 10.1016/j.plipres.2009.08.004. [DOI] [PubMed] [Google Scholar]
- 35.Macia IGM, Lucas Calduch A, Lopez EC. Rep Pract Oncol Radiother. 2011;16:123–130. doi: 10.1016/j.rpor.2011.06.001. [DOI] [PMC free article] [PubMed] [Google Scholar]
- 36.Nagan N, Zoeller RA. Prog Lipid Res. 2001;40:199–229. doi: 10.1016/s0163-7827(01)00003-0. [DOI] [PubMed] [Google Scholar]
- 37.Mukherjee D, Coates PJ, Lorimore SA, Wright EG. J Pathol. 2014;232:289–299. doi: 10.1002/path.4299. [DOI] [PubMed] [Google Scholar]
- 38.Gibellini F, Smith TK. IUBMB Life. 2010;62:414–428. doi: 10.1002/iub.337. [DOI] [PubMed] [Google Scholar]
- 39.Vance JE, Vance DE. Biochem Cell Biol. 2004;82:113–128. doi: 10.1139/o03-073. [DOI] [PubMed] [Google Scholar]
- 40.Vance JE. J Lipid Res. 2008;49:1377–1387. doi: 10.1194/jlr.R700020-JLR200. [DOI] [PubMed] [Google Scholar]
- 41.Robbins ME, Zhao W. Int J Radiat Biol. 2004;80:251–259. doi: 10.1080/09553000410001692726. [DOI] [PubMed] [Google Scholar]
- 42.Zhao W, Robbins ME. Curr Med Chem. 2009;16:130–143. doi: 10.2174/092986709787002790. [DOI] [PubMed] [Google Scholar]
- 43.Benderitter M, Vincent-Genod L, Pouget JP, Voisin P. Radiat Res. 2003;159:471–483. doi: 10.1667/0033-7587(2003)159[0471:tcmaab]2.0.co;2. [DOI] [PubMed] [Google Scholar]
- 44.Davies MJ. Biochim Biophys Acta. 2005;1703:93–109. doi: 10.1016/j.bbapap.2004.08.007. [DOI] [PubMed] [Google Scholar]
- 45.Clemens MR, Ladner C, Schmidt H, Ehninger G, Einsele H, Buhler E, Waller HD, Gey KF. Free Radic Res Commun. 1989;7:227–232. doi: 10.3109/10715768909087946. [DOI] [PubMed] [Google Scholar]
- 46.Greig FH, Kennedy S, Spickett CM. Free Radic Biol Med. 2012;52:266–280. doi: 10.1016/j.freeradbiomed.2011.10.481. [DOI] [PubMed] [Google Scholar]
- 47.Stadtman ER, Levine RL. Amino Acids. 2003;25:207–218. doi: 10.1007/s00726-003-0011-2. [DOI] [PubMed] [Google Scholar]
- 48.Yin L, Vijaygopal P, Menon R, Vaught LA, Zhang M, Zhang L, Okunieff P, Vidyasagar S. Health Phys. 2014;106:734–744. doi: 10.1097/HP.0000000000000117. [DOI] [PubMed] [Google Scholar]
- 49.Sharma M, Moulder JE. Adv Exp Med Biol. 2013;990:87–100. doi: 10.1007/978-94-007-5896-4_5. [DOI] [PubMed] [Google Scholar]
- 50.van Rijn J, van den Berg J, Teerlink T, Kruyt FA, Schor DS, Renardel de Lavalette AC, van den Berg TK, Jakobs C, Slotman BJ. Br J Cancer. 2003;88:447–454. doi: 10.1038/sj.bjc.6600700. [DOI] [PMC free article] [PubMed] [Google Scholar]
- 51.Li P, Yin YL, Li D, Kim SW, Wu G. Br J Nutr. 2007;98:237–252. doi: 10.1017/S000711450769936X. [DOI] [PubMed] [Google Scholar]
- 52.Duggan C, Gannon J, Walker WA. Am J Clin Nutr. 2002;75:789–808. doi: 10.1093/ajcn/75.5.789. [DOI] [PubMed] [Google Scholar]
- 53.Wu G. Amino Acids. 2009;37:1–17. doi: 10.1007/s00726-009-0269-0. [DOI] [PubMed] [Google Scholar]
- 54.Rutkowsky JM, Knotts TA, Ono-Moore KD, McCoin CS, Huang S, Schneider D, Singh S, Adams SH, Hwang DH. Am J Physiol Endocrinol Metab. 2014;306:E1378–E1387. doi: 10.1152/ajpendo.00656.2013. [DOI] [PMC free article] [PubMed] [Google Scholar]
- 55.Riecke A, Ruf CG, Meineke V. Health Phys. 2010;98:160–167. doi: 10.1097/HP.0b013e3181b97306. [DOI] [PubMed] [Google Scholar]
- 56.Zhang A, Sun H, Wang P, Han Y, Wang X. Analyst. 2012;137:293–300. doi: 10.1039/c1an15605e. [DOI] [PubMed] [Google Scholar]
- 57.Coy SL, Krylov EV, Nazarov EG, Fornace AJ, Jr, Kidd RD. Int J Ion Mobil Spectrom. 2013;16:217–227. doi: 10.1007/s12127-013-0135-3. [DOI] [PMC free article] [PubMed] [Google Scholar]
Associated Data
This section collects any data citations, data availability statements, or supplementary materials included in this article.


