Abstract
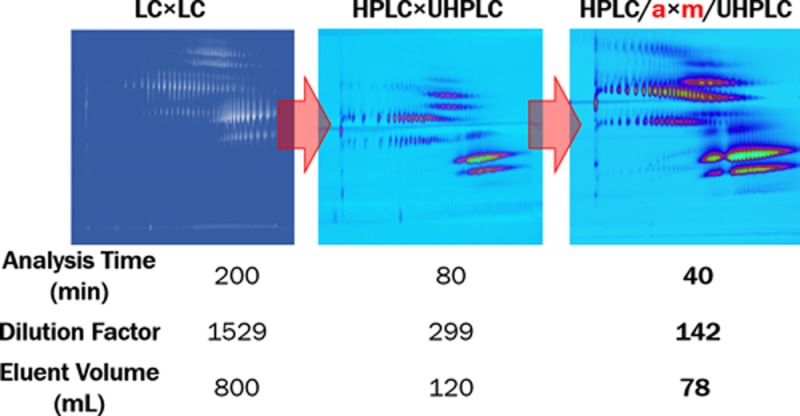
Online comprehensive two-dimensional liquid chromatography (LC × LC) offers ways to achieve high-performance separations in terms of peak capacity (exceeding 1000) and additional selectivity to realize applications that cannot be addressed with one-dimensional chromatography (1D-LC). However, the greater resolving power of LC × LC comes at the price of higher dilutions (thus, reduced sensitivity) and, often, long analysis times (>100 min). The need to preserve the separation attained in the first dimension (1D) causes greater dilution for LC × LC, in comparison with 1D-LC, and long analysis times to sample the 1D with an adequate number of second dimension separations. A way to significantly reduce these downsides is to introduce a concentration step between the two chromatographic dimensions. In this work we present a possible active-modulation approach to concentrate the fractions of 1D effluent. A typical LC × LC system is used with the addition of a dilution flow to decrease the strength of the 1D effluent and a modulation unit that uses trap columns. The potential of this approach is demonstrated for the separation of tristyrylphenol ethoxylate phosphate surfactants, using a combination of hydrophilic interaction and reversed-phase liquid chromatography. The modified LC × LC system enabled us to halve the analysis time necessary to obtain a similar degree of separation efficiency with respect to UHPLC based LC × LC and of 5 times with respect to HPLC instrumentation (40 compared with 80 and 200 min, respectively), while at the same time reducing dilution (DF of 142, 299, and 1529, respectively) and solvent consumption per analysis (78, 120, and 800 mL, respectively).
Two-dimensional liquid chromatography is a technique that allows the characterization of samples that, due to their complexity, cannot be resolved using one-dimensional chromatography. The higher resolving power is a direct consequence of the consecutive separation of the sample components using two distinct chromatographic processes that exploit different selectivity principles. In comprehensive, two-dimensional LC (LC × LC), the entire sample is subjected to the two different separations. In off-line LC × LC there are no restrictions on the speed of analysis in the second dimension, making this the best way to exploit the full resolving power of both the separation dimensions.1,2 However, the resulting long overall analysis times make this technique impractical for routine analysis of large numbers of samples.
Online LC × LC has the advantage of significantly decreasing the analysis time necessary to obtain a high peak capacity. However, the tight constraints imposed by the coupling of the two chromatographic processes seriously limit the separation efficiency. The second dimension separations (2D) must be fast to allow frequent sampling of the first separation (1D), while providing sufficient resolving power. Studies have demonstrated that the optimal number of fractions per 1D peak is somewhere between 2 and 4.3−6 Moreover, to reduce the volumes collected for injection onto the 2D column, the 1D separation has to be run at low, often suboptimal,7 linear flow velocities, and thus, long run times are required to deliver efficient gradients (spanning at least five column volumes). Other restrictions are related to the compatibility of the mobile phases used in the two dimensions8 and to the volume of sample that can be injected on the 2D column.9,10
If online LC × LC is to become more frequently adopted for routine analysis, robust high-throughput analysis exploiting orthogonal selectivities will need to be developed. In this context, it is important to develop strategies that enable fast and efficient separations.
Significant shortening of the analysis time can be achieved by reducing the 2D cycle time using ultra-high-pressure LC (UHPLC),11−13 increased temperatures,14 or parallel 2D15,16 technologies that are now available in commercialized LC × LC systems. However, to reduce the injection band broadening in the second dimension, these systems use combinations of long and narrow 1D columns (e.g., 1 or 2.1 mm I.D.) and short and wide 2D columns (e.g., 4.6 mm I.D). Using such configurations, it is possible to minimize the ratio between the volume of the fractions collected from the first dimension and the 2D column volume,5 typically injecting less than 10% of the 2D column volume. As a consequence, high peak capacities are obtained at the price of high dilutions and, thus, loss in sensitivity.
Alternative column couplings have been suggested to limit the injection band broadening without increasing the dilution and allow combinations of chromatographic modes that make use of incompatible solvents. Examples include interfaces with trap columns instead of loops,17−23 vacuum evaporation,24 and thermally assisted modulation.21,25 These technologies have proven, with different degrees of success, their effectiveness at reducing problems connected with the injection of strong or incompatible solvents in the 2D system, but they have not yet reached a level of maturity that would allow their use in routine LC × LC applications.
In this work we present an active-modulation approach (LC/a × m/LC) in which the fractions collected from the 1D are concentrated prior to injection in the 2D. This is achieved using a HPLC × UHPLC system that was modified to include a dilution flow to decrease the mobile phase strength of the 1D effluent and a modulation unit that uses trap columns. This configuration allows, in comparison with the conventional loop interface (“passive-modulation”), linear velocities closer to the optimum in the 1D without using flow splitters.7,26 The LC/a × m/LC system also reduces the effects of the 1D dead times (consequences of low flow rates in the first dimension), dwell volumes, and 2D injection band broadening (thanks to the reduction of the volumes collected from the 1D). Together, these result in a considerably shorter time necessary to obtain a specified separation efficiency.
The feasibility of LC/a × m/LC is demonstrated for the separation of tristyrylphenol ethoxylate-phosphate (TSP) surfactants (polymeric compounds), using a combination of hydrophilic interaction LC and reversed-phase LC (HILIC × RPLC). Thanks to the independent selectivities offered by this method, the sample can be separated according to its ethoxylate chain length (HILIC) and the degree of styrene and phosphate substitution (RP).
Experimental Section
Chemicals
The samples used for this study are tristyrylphenol ethoxylate (TSP; CAS 99734–09–05), commercially available under the names Agent 3152–90 and Termul 3150; tristyrylphenol ethoxylate phosphate (TSP phosphate CAS 90093–37–1) as Agnique PE TSP 16A, Agent 3152–92, and Soprophor 3D33. The chemical structure of the compounds is reported in Figure 1. The solvents used were Milli-Q grade water (18.2 mΩ) and liquid-chromatography-grade acetonitrile (ACN), methanol (MeOH), tetrahydrofuran (THF), and 1-butanol, obtained from Avantor Performance Materials B.V. (Deventer, NL). Ammonium acetate (Bioxtra grade, 99% purity) was purchased from Sigma-Aldrich (Zwijndrecht, NL). All materials were used as received, and the mobile phases were not filtered prior to use.
Figure 1.
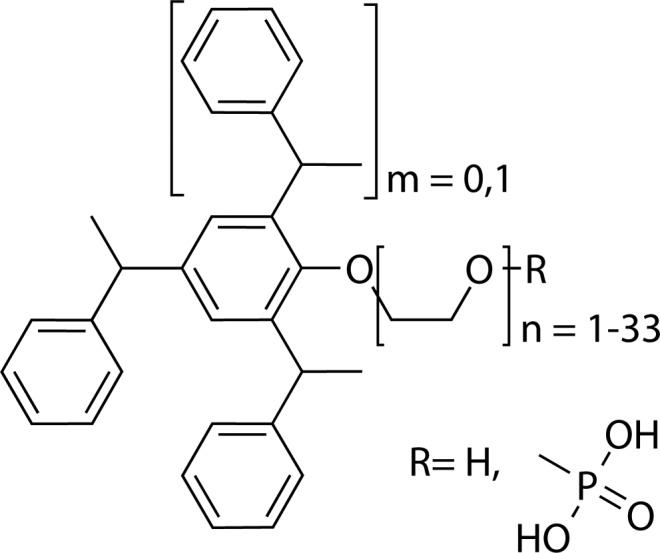
Chemical structure of the commercially available tristylphenol ethoxylates (TSPs) analyzed in this study. For products CAS 90093–37–1, R = phosphate; for CAS 99734–09–5, R = H (TSP phosphate).
Samples were prepared by dissolving the surfactant in a mixture of 94% ACN, 5% THF, and 1% 12.5 mM ammonium acetate at the concentrations reported in Table 1 for the HILIC × RP separations or at 1 mg/mL for the HILIC study reported in Figures 2 and 3. The performance of the different RP materials (Figure 4) was studied with a 1 mg/mL solution of surfactants in H20/ACN 1/1 v/v.
Table 1. Characteristics of the Instrumentation and Conditions Used; A Complete Description of the Setup is Reported in the Experimental Section.
| LC × LC (40 MPa) | HPLC × UHPLC (120 MPa) | HPLC/a × m/UHPLC (120 MPa) | ||
|---|---|---|---|---|
| 1D | L (mm) | 250 | 150 | 150 |
| I.D. (mm) | 3 | 2.1 | 2.1 | |
| particle size (μm) | 5 | 1.7 | 1.7 | |
| flow rate (μL/min) | 100a | 40 | 80 | |
| tG/t0 | 10 | 7.2 | 7.2 | |
| nce | 70 | 67 | 66 | |
| w (1/2 h) av (min)e | 1.4 | 0.6 | 0.3 | |
| DFe | 7.3 | 2.6 | 2.5 | |
| 2D | L (mm) | 50 | 50 | 50 |
| I.D. (mm) | 4.6 | 2.1 | 2.1 | |
| particle size (μm) | 2.6b | 1.7 | 1.7 | |
| flow rate (mL/min) | 4 | 1.5 | 1.35 | |
| tG/t0 | 6.7 | 3.5 | 2.4 | |
| ncf | 15.0 | 12.1 | 12.8 | |
| w (1/2 h) av (s)f | 2.1 | 1.3 | 0.9 | |
| DFf | 29.9 | 35.2 | 21.6 | |
| LC × LC | analysis time (min) | 200 | 80 | 40 |
| Vinj (conc. mg/mL) | 20 (70) | 10 (20) | 10 (10) | |
| modulation (Vfractions) | 60 μL loops (50 μL) | 40 μL loops (20 μL) | trap columns (28 μL) | |
| mod. time (s) | 60 | 30 | 21 | |
| 2D tG (s) | 50 | 25 | 18 | |
| 2D nc | 18 | 19 | (17c) | |
| w (1/2 h) av (s) | 1.4 | 0.8 | 0.6 | |
| DF | 1604 | 299 | 142 | |
| MP per analysis (mL) | 800 | 120 | 82 (54d) | |
| β | 1.28 | 1.33 | 1.66 | |
| nc predictedg | 1233 | 1307 | 1144 | |
| nc practicalh | 562 | 596 | 752 | |
| nc practicali | 964 | 980 | 691 | |
| nc/min | 4.8 | 12.3 | 17.3 |
Split ratio ≈ 1:1.
Superficially porous particles.
The lower value of nc in 1D-LC experiments respect to what observed in LC × LC separation is a consequence of the narrower molecular weight of the fractions analyzed with the latter approach.
Excluding the dilution flow of 12.5 mM ammoniumacetate.
From 1D experiments with 20 μL injection in the HPLC × HPLC setup and 10 μL for the HPLC × UHPLC and HPLC/axm/UHPLC; samples as 1 mg/mL solution in 94% ACN, 5%THF, 1% H2O.
From 1D experiments with 5 μL injection in the HPLC × HPLC setup and 1 μL for the HPLC × UHPLC; samples as 1 mg/mL solution in 50/50 ACN/H20 v/v.
Figure 2.
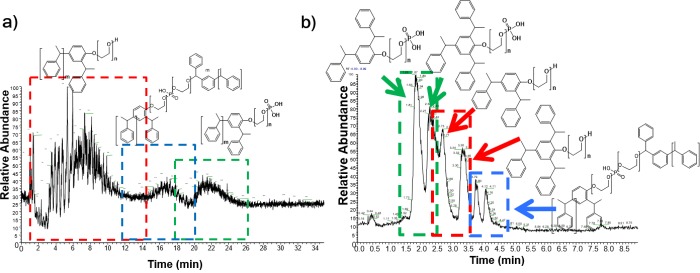
Total-ion-current chromatogram of the HILIC (a) and RPLC (b) analysis of Agnique PE TSP 16A. The colors of the boxes differentiate three different classes of compounds present in this sample. Red indicates the ditri styrene ethoxylate, blue impurities containing two units of the ditri styrene diethoxylate and green the ditri styrene ethoxylate phosphate. Conditions: (a) flow rate: 1 mL/min mobile phase A: 98% ACN 2% 12.5 mM ammonium acetate; Mobile phase B: 12.5 mM ammonium acetate. Linear gradient 0 to 50% B in 20 min. (b) Flow rate = 1 mL/min, mobile phase A = 25 mM ammonium acetate + 1% BuOH, mobile phase B = MeOH + 1% BuOH; linear gradient 50–100% B in 5 min. Mass spectrometry conditions are reported in section S2 of the Supporting Information.
Figure 3.
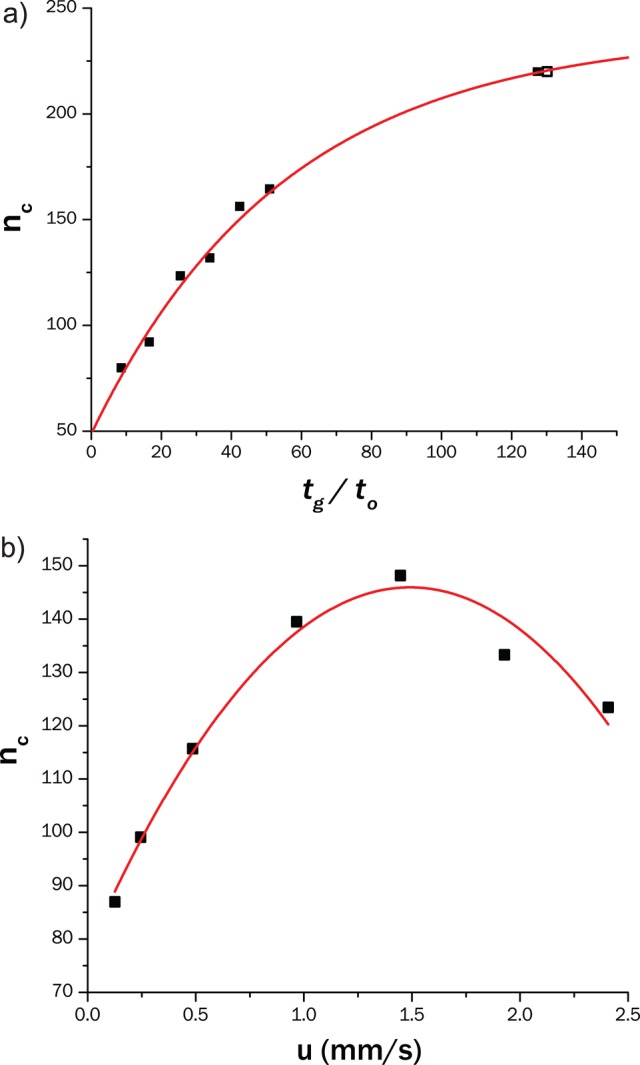
Effect of the gradient time (a) and of the linear flow velocity (b) on the peak capacity of the 1D HILIC separations. Conditions: mobile phase A: 94% ACN, 5% THF 1% 12.5 mM ammonium acetate; mobile phase B: 12.5 mM ammonium acetate, Vinj = 1 μL, T = 15 °C, UV detection at 220 nm. (a) Linear gradient from 0 to 30% B at u = 2.4 mm/s. (b) Linear gradient from 0 to 30% B with constant tG/t0 of 25.
Figure 4.
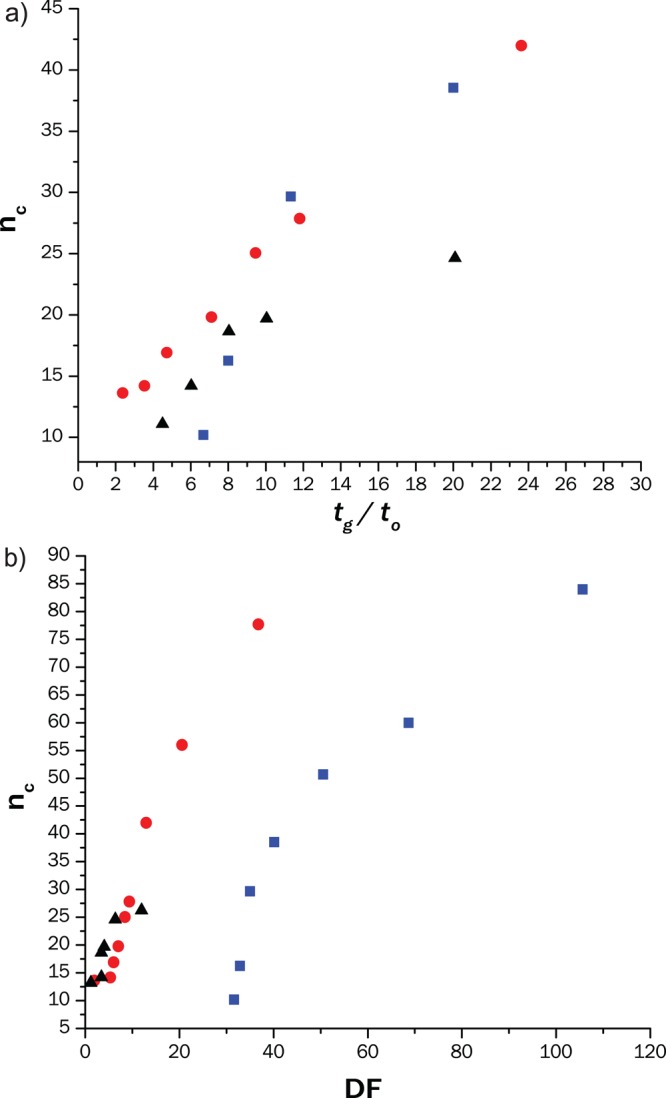
Dependence of the peak capacity on the gradient time (a) and on the dilution factor (b) of the 2D RP separation for the three C18 columns considered in this study: (blue square) 50 × 4.6 mm; 2.6 μm particles (red circle) 50 × 2.1 mm; 1.7 μm (black triangle) 50 × 1 mm; 1.9 μm. Conditions: mobile phase A: 12.5 mM ammonium acetate + 1% 1-BuOH; mobile phase B: MeOH + 1% BuOH. Gradient from 35% to 100% with times scaled for different tG/t0 (see section S5 of Supporting Information); u = 7.2 mm/s, T = 50 °C, Vinj = 1 μL of Agnique TSP 16A in 50/50 ACN/H20.
Instrumentation and Data Analysis
HPLC × HPLC
An LC × LC instrument composed of an Agilent (Waldbronn, Germany) 1100 quaternary (1D) pump (Model G1311A) and a 1260 quaternary (2D) pump (Model G1311B), two degassers (Model G1322), thermostats (Model G1316A), detectors (Model G4212B with 13 μL flow cell), one autosampler (Model G1329B), and a 10-port two-position switching valve (Agilent G4232A and G1170A support unit) with 60 μL loops was used for our experiments. The valve was configured for back-flush injection,27 and all Agilent modules were controlled using Agilent Chemstation B.04.03 software on two different computers, the first was used to control the autosampler, 1D pump and thermostat, and detector, while the second controlled the switching valve, 2D pump, and detector. The data were exported as comma-separated files and processed using a recently published Matlab-2014b (The Mathworks, Inc., Natick, MA, U.S.A.) script.28,29
A Kromasil 60 Si–OH 1D column (250 × 3 mm i.d.; 5 μm particles; 60 Å pore size; Hichrom Ltd., Reading, United Kingdom) was used, followed by a stainless steel tee (Model U-428, IDEX Corp; DaVinci, Rotterdam NL) to split the flow before the switching valve. Stainless steel tubing of the same I.D. and length (75 μm I.D. × 200 mm) were used on the two sides of the tee to approach a split ratio of 1:1. As 2D column we used a Phenomenex Kinetex C18 (50 × 4.6 mm; 2.6 μm; 100 Å, Phenomenex, Macclesfield, U.K.). Operation conditions and further details are reported in Table 1.
HPLC × UHPLC and HPLC/a × m/UHPLC
An Agilent 1200 degasser (G1379), a 1200 SL binary pump (Model G1312, with the original mixer replaced by a 50 μL mixer from Waters), an autosampler (Model G4226A), and a column thermostat compartment (Model G1316C) were used for the 1D. The 2D was composed of UHPLC binary pumps (Model G4220A configured with a JetWeaver V35 mixer), a thermostated column compartment (Model G1316C), and a diode-array UV detector (DAD, Model G4212A) with a standard flow cell (13 μL volume). The valve schematically shown in Figure 5 is a 4-port duo 2-position valve (Model 5067–4214) installed in the 2D thermostat. Loops of 40 μL were used with valve configuration for back-flush injections.
Figure 5.
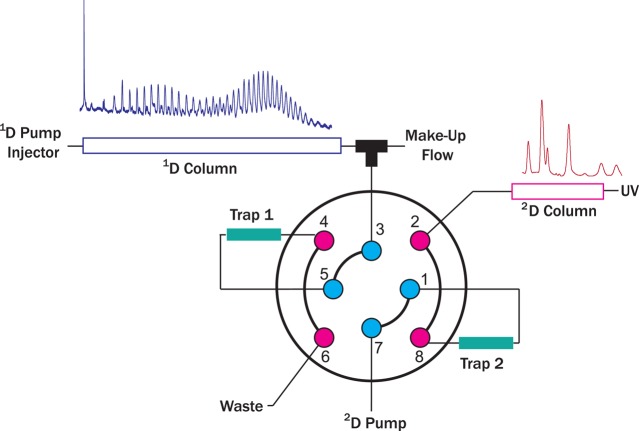
Schematic representation of the HPLC/a × m/UHPLC setup. A dilution flow is delivered to reduce the mobile phase strength of the eluent of the 1D (MF ≈ 7 × 1D flow rate) and allow the concentration of the analytes on a trap column (e.g. Trap 1) having similar packing materials as the 2D column. Once the valve is switched the analytes bands are eluted from the trap and separated on the 2D.
We used an Acquity UPLC BEH HILIC (150 × 2.1 mm; 1.7 μm; 130 Å; Waters, Elstree, U.K.) 1D column and an Acquity UPLC HSS C18 2D column (50 × 2.1 mm; 1.8 μm; 100 Å). Additionally, we tested a Hypersil GOLD C-18 (50 × 1 mm; 1.9 μm; ThermoFisher Scientific, Breda, NL) column. The comparison between the different columns is reported in Figure 4.
The HPLC/a × m/UHPLC setup used the same hardware described above and, in addition, a stainless-steel tee connection (Model U-428, IDEX Corp) to add a dilution flow after the first-separation dimension using an isocratic pump (Model G1310B). The modulation interface was configured for forward-flush operation and the loops where substituted by two C-18 precolumn cartridges (2.1 × 2 mm with sub-2 μm particles, SecurityGuard Ultra AJ0–8782, Phenomenex, Utrecht, NL) directly installed in the switching valve and connected to the port receiving effluent from the 1D by a 50 mm × 50 μm I.D. connection. A schematic representation of the setup is shown in Figure 5.
All Agilent modules of this configuration were controlled and programmed using Agilent Chemstation C.01.04. Data analysis was performed using GC image R 2.5 software (GCimage, Lincoln, U.S.A.). Operation conditions are reported in the Chromatographic Conditions section and Table 1.
Chromatographic Conditions
The 1D separations were performed using mobile phase A (94% ACN, 5% THF, 1% 12.5 mM ammonium formate) to mobile phase B (12.5 mM ammonium acetate). In the 2D, the mobile phases used were A (99% 12.5 mM ammonium formate, 1% 1-butanol) and B (99% MeOH, 1% 1-butanol). Butanol was used to reduce the equilibration time.30 The separation performed using the LC/a × m/LC setup used a dilution flow composed of 12.5-mM ammonium acetate.
The conditions used for the HPLC × HPLC (graphical abstract and Table 1) were 1D flow rate of 0.1 mL/min at T = 10 °C and gradient elution from 0% B to 60% B in 140 min, 20 min at 60% B. At 180 min, the flow rate was set to 1 mL/min and run at 0% B until 200 min. For the 2D separation we used a flow rate of 4 mL/min, T = 40 °C using, gradient elution from 40% B to 80% in 0.01 min, from 80% to 100% at 0.76 min, kept at 100% B until 0.86 min and equilibrated at 40% B for 0.14 min. Modulation volume = 50 μL. The HPLC × UHPLC separation described in Table 1 was performed using a 1D flow rate of 0.04 mL/min, T = 5 °C, gradient elution from 2% B to 20% B in 20 min, then to 50% B at 50 min, 55% B at 60 min, and 2% B at 70 min. Flow rate increased to 0.2 mL/min at 78 min. The 2D was run at 50 °C at a flow rate of 1.5 mL/min, gradient elution from 35% B to 80% in 0.01 min, 85% to 100% at 0.35 min, 0.03 min 100% B, and at 0.4 min re-equilibration at 40% B. Modulation volume = 20 μL. The HPLC × UHPLC and HPLC/a × m/UHPLC reported in Figure 6 and 7 runs were performed using a 1D flow rate of 0.08 mL/min, T = 5 °C, gradient elution from 2% B to 20% B in 10 min, then to 50% B at 25 min, 55% B at 30 min, and 2% B at 39.99 min. Flow rate increased to 0.2 mL/min at 40 min. In the 2D T = 50 °C, gradient elution from 35% B to 80% in 0.01 min, then to 100% at 0.29 min and 100% B at 0.30 min, followed by 0.06 min re-equilibration at 35% B (0.35 min modulation time). The 2D flow rate was of 1.5 mL/min in the HPLC × UHPLC setup and 1.35 mL/min in the HPLC/a × m/UHPLC. The dilution flow in used in the/a × m/setup was 0.6 mL/min and this incremented the 1D back pressure off approximately 100 bar. All the LC × LC separation where monitored at 220 nm using 80 Hz scan rate.
Figure 6.
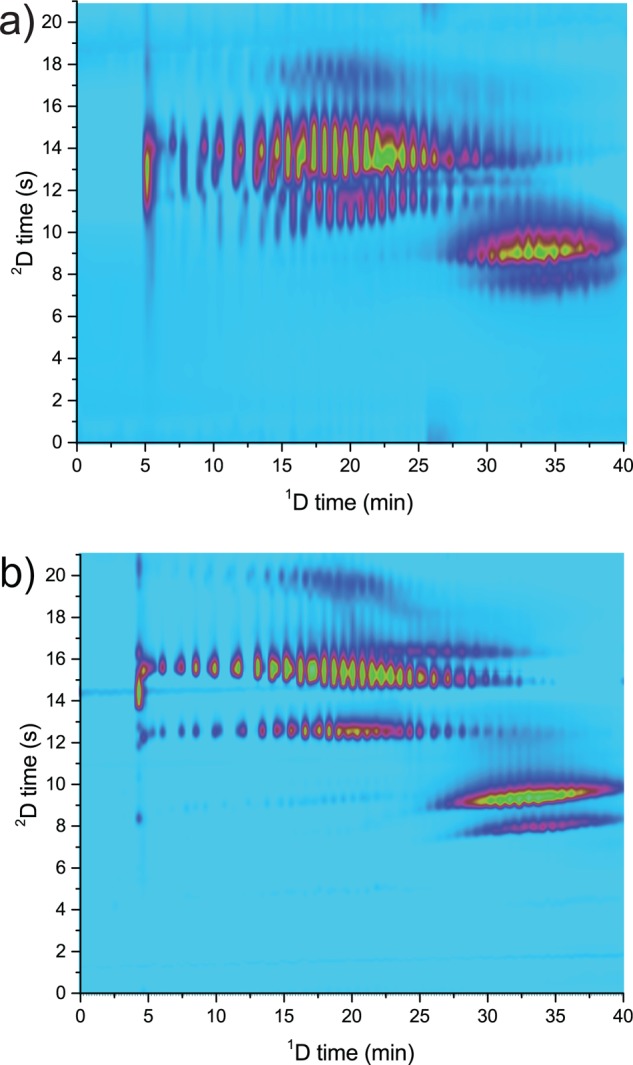
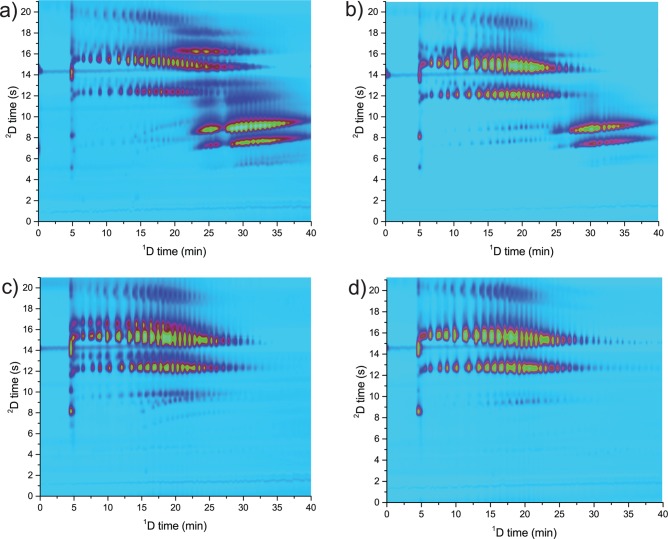
Comparison of the LC × LC separation of Agent 3152–92 using loop-based (a) and active-modulation (b) interfaces. Conditions reported in the chromatographic condition paragraph of the Experimental Section.
Figure 7.
Two-dimensional separation of phosphated tristyrylphenyl ethoxylates (a, Agnique PSE 16A, and b, Soprophor 3D33) and of tristyrylphenol ethoxylates (c, Agent 3152–90, and d, Termul 3150) using HPLC/a × m/UHPLC. Conditions reported in the chromatographic condition paragraph of the Experimental Section.
Calculations
The following paragraph describes the equations adopted to obtain the results reported in Table 1.
Peak Capacity
The peak capacity (nc) was determined from the average width at half height (w̅1/2h) applying eq 1.
| 1 |
For the calculation of the 1D peak capacity the average width was obtained from the integration of five peaks at the beginning of the chromatogram (indicated in red in Figure 2b) and five peaks in the area of elution of the phosphate species (green in Figure 2b). The 2D peak capacity was obtained as average of all the (5–15, depending on tG) peaks present in the chromatograms.
The predicted peak capacity for each LC × LC system was calculated as
| 2 |
using 1nc values obtained from one-dimensional runs under the same conditions as the LC × LC runs (see Table 1 for the respective parameters) and 2nc calculated from the average nc of multiple 2D runs (2D nc parameter of Table 1).
Equation 2 is not taking into account 1D undersampling and band broadening associated with the modulation process.3,4,6
Two different approaches were used to correct for these effects, using the equation proposed by Davis-Li et al.6,31,32
 |
3 |
where β is the undersampling correction factor 2tc is the modulation cycle, tG the dimension gradient time, and that proposed by Vivó et al. for loop-based LC × LC5
 |
4 |
where σ is the standard deviation of the peak in time units, δinj2 is 4.6, δdet is 4, and the required resolution Rs was set to 1.
In the case of LC/a × m/LC, the peak capacity was calculated from
 |
5 |
Dilution Factor
To calculate the dilution factor (DF) we used the model proposed by Vivó-Truyols et al.5
| 6 |
where F is the flow rate and Vi is the injection volume.
The dilution of the complete chromatographic process was calculated from
| 7 |
where M is the number of modulations in the LC × LC run.
Results and Discussion
Thanks to its high separation power, online comprehensive two-dimensional LC is attracting increasing interest for the analysis of complex mixtures in areas such as food,33,34 polymers,27 and life science.35−37 Although this analytical tool has matured (with dedicated systems entering the market), some of the limitations of the current technique need to be (further) addressed to widen its applicability. Two important improvements regard the shortening of the total analysis time and the reduction of the sample dilution to facilitate the detection of low-abundant analytes.
In this work, we present a strategy to reduce analysis time and dilution, introducing a concentration step between the two chromatographic dimensions. Recently, we demonstrated the feasibility of such a two-dimensional chromatographic process, which we named actively modulated LC × LC (LC/a × m/LC), for coupling capillary ion-exchange chromatography with nano-RPLC connected to high-resolution mass spectrometry (HRMS) for the analysis of complex protein digests.38 Here we report the application of LC/a × m/LC to realize analytical scale HILIC × RPLC for the characterization of tristyrylphenol ethoxylate surfactants (TSP).
TSPs are a group of surfactants widely used in agrochemical formulations that exhibit a polymeric distribution with an average of 3 styrene and 16 ethylene-oxide units. The chemical structure of the analytes is shown in Figure 1.
The analytes are amphiphilic and contain polar (ethoxylate and phosphate groups) as well as lipophilic residues (styrene groups) and, thus, can be characterized using either HILIC39 or RPLC.40
1D Analysis
Figure 2a shows the LC-MS total-ion-current chromatogram obtained for Agnique PE TSP 16A using a linear gradient under HILIC conditions. The styrene ethoxylates are separated on the basis of their chain length (from low to high degree of ethoxylation, EO). On the other hand, RPLC using fast gradients (Figure 2b) separates the sample according to its chemical composition, independently of the molecular weight (pseudocritical conditions41,42). As depicted in Figure 2b, it is possible to separate analytes with different degrees of styrene substitution in the ethoxylate and ethoxylate-phosphate and impurities originating from the inclusion of more than one styryl ethoxylate unit in the polymer (more details on the LC-MS investigation are reported in section S2 of the Supporting Information).
The two separations target different properties of the sample (sample dimensions43) to separate it on the basis of two independent (orthogonal44) mechanisms. As a consequence, the species are eluting in a different order in HILIC (Figure 2a: red, blue, and green) and RP (Figure 2b: green, red, and blue).
Due to the prevalence of several sample dimensions (chain length, functional groups) in the sample, no one-dimensional LC separation is capable of completely resolving it. The compounds ionize in ammonia-buffered solutions and, thus, LC-MS analysis is possible. This would enable us to characterize the polymer distribution between different species, but it is quantitatively biased45,46 and limited in the analysis of high-molecular-weight species (EO > 30). A further limitation of LC-MS relates to the high ionizability and amphiphilic character of the analytes. The compounds are a source of contamination for the MS and (like PEGs) they are very difficult to remove, impairing the sensitivity. For these reasons, routine LC-MS analysis of TSPs is not an attractive option. In contrast, given the UV activity and the sample dimensionality characteristic of TSPs, they represent an interesting application for LC × LC-UV.
To develop our separation method, we initially screened different HILIC columns (bare silica, sulfobetaine, and amide chemistry) and selected bare silica as stationary phase due to higher separation efficiency shown by this material (see section S1 of the Supporting Information). In Figures 3 and 4, the results of efficiency optimization studies performed both with the 1D and 2D are summarized.
We found an approximately logarithmic relationship between the peak capacity of the HILIC separation and the gradient time (tG; see Figure 3a). Increasing tG led to an increase in nc up to about 220. At constant tG/t0, the linear flow velocity also affects the peak capacity, as illustrated in Figure 3b.
A typical TSP phosphate-sample contains 160 components (two different levels of styrene substitution, approximately 40 distinguishable ethoxylated units that can either be phosphated or not), together with various other impurities. According to Giddings,43 the number of peaks that could be statistically anticipated given a certain peak capacity is approximately 0.37 × nc, which means that only roughly 100 features of the sample may be separated using the maximum peak capacity of 220 provided by the developed 1D separation. Thus, the peak capacity offered by 1D LC does not suffice to resolve these species. 1D separations may offer more resolving power using longer columns at the price of longer analysis times (>100 min), provided that sufficient selectivity can be obtained between the different series. LC × LC offers much higher peak capacities and additional selectivity in shorter times and, thus, should allow faster and more-detailed separation of the sample.
To develop an LC × LC separation we optimized the 2D RP separation, aiming to achieve efficient separation in a short time. During the optimization we investigated the relationship between the peak capacity and the gradient time and the dilution factor using different column technologies (Figure 4).
We compared 1.7 μm fully porous particles in a 2.1 mm I.D. column, 1.9 μm fully porous particles in 1 mm I.D., and 2.6 μm core–shell particles in a 4.6 mm column. All the columns showed similar selectivities and the sub-2-μm particles showed clear gains in separation efficiency for fast gradients (tG/t0 < 10; Figure 4a). Moreover, using a narrower column reduced significantly the dilution factor (Figure 4b).
Fast separations (down to 25 s cycle time) could be used to efficiently separate the six main polymer groups for small volume injections (0.1 or 1 μL). The peak capacity was severely reduced in case of high injection volumes (32% for Vinj = 20 μL; see section S4 of Supporting Information). The 1 mm ID column could help reduce the dilution of the chromatographic process. However, when used in LC × LC it suffered from lower efficiency and its permeability decreased rapidly. Thus, we did not use it further in the study.
LC × LC, HPLC × UHPLC, and HPLC/a × m/UHPLC
To test the effectiveness of the two-dimensional combination we initially assembled a system using HPLC hardware (<40 MPa) and, given the good results obtained, we optimized the LC × LC separation using UHPLC technology and later actively modulated HPLC × UHPLC (HPLC/a × m/UHPLC, see Figure 5).
A summary of the conditions used to test the different setups is provided in Table 1.
Figure 4a clearly shows how UHPLC technology helps in shortening the time needed to achieve a certain separation efficiency (practical peak capacity). When applied to LC × LC this allows a significant reduction of the 2D analysis cycle time, reducing the total analysis time (from 200 to 80 min)14 and maintaining practically the same sampling of the 1D (see Table 1, β).31 Moreover, by programming a gradient starting from low organic modifier and having two different gradient slopes (first varying very rapidly, 0.6 s, from 40 to 80% of B and then slower, 16.8 s, from 80 to 100% B) we could focus relatively large volumetric fractions of 1D (20 μL) on top of a 2D column with the same ID as the 1D column (2.1 mm ID; injection of approximately 20% of the 2D column volume). The diameter of the column greatly affects the dilution factor. In LC × LC narrower columns in the 2D help to reduce the dilution (see Figure 4b) and the required eluent volume.
To further increase the throughput of such analytical method it is necessary to reduce the time of each analysis (<80 min) and thus increase the speed of the 1D and 2D separations. One partial solution may be to shorten the 1D gradient time. However, this would decrease the 1D separation efficiency (due to a reduced tG/t0; see Figure 3a) and it would not help reducing the long dwell times and column hold-up times associated with the low flow rates used (e.g., at 40 μL/min, t0 ≈ 10 min). Increasing the flow rate and maintaining the same tG/t0, alleviates these problems, but it causes larger volumes to be injected in the 2D and shorter 2D times to maintain similar sampling of the 1D signal. Figure 6a shows the results obtained upon doubling the 1D flow rate (from 40 to 80 μL/min) and reducing the 2D cycle time (from 30 to 21 s) to maintain a similar degree of fractionation of the 1D.31 Larger injection volumes (28 μL) significantly increase the 2D band broadening, rendering this approach unattractive. To overcome these limitations and to reduce the required analysis time we applied the active-modulation setup illustrated in Figure 5. A T-piece allowed the dilution of the 1D effluent with a water-rich makeup flow (MF; ratio MF to 1D flow rate approximately 7:1) to reduce its elution strength. Two 5 × 2.1 mm ID trap (V ≈ 10 μL) columns replace the empty loops in the modulation interface. Figure 6b clearly shows the advantage of reducing the 2D injection volume (the nc, calculated according to eq 3, are of is of 750 for the LC/a × m/LC and of 411 for the LC × LC separation). Using active modulation, efficient (high peak capacity) and information-rich LC × LC separations can be achieved within 40 min.
The traps increase the back pressure and we were limited in the 2D by the instrument maximum (120 MPa) to a flow rate of 1.35 mL/min in comparison with 1.5 mL/min using the loop interface. In spite of the lower tG/t0 in the 2D it was possible to characterize different TSPs and TSP phosphates and to clearly distinguish batches from different producers (Figures 6b and 7a–d).
Conclusions
The possibility to reduce the analysis time and the dilution of LC × LC separations using active modulation has been demonstrated. Active modulation offers an attractive solution to improve the LC × LC analysis. Key features of a HPLC/a × m/UHPLC system are the following:
-
•
The 1D flow rate can be increased, allowing operation close to the optimal linear velocity, providing high-peak-capacity separations in shorter analysis times (40 instead of 80 min).
-
•
The volumes of the fractions collected from the 1D can be decreased, allowing faster and efficient 2D separations (from 30 to 21 s).
-
•
Column combinations and analysis conditions can be selected such that the chromatographic dilution and the sample consumption are significantly reduced (dilution factor from 299 to 142).
-
•
The analysis time necessary to obtain similar peak capacities (≈500) is reduced 2.5-fold when progressing from LC × LC (200 min; solvent consumption per analysis 800 mL) to HPLC × UHPLC (80 min; 120 mL) and a further two times when using active modulation (HPLC/a × m/UHPLC; 40 min; 78 mL), while simultaneously reducing the solvent consumption.
Acknowledgments
This work was financially supported by The Netherlands Organization for Scientific Research (NWO) in the framework of the Technology Area, COAST programme HYPERformance LC (053.21.102), by Syngenta and by the University of Amsterdam. The authors would like to thank Aniko Kende, Anna Nile, Andrew Black, and Pauline Phillips from Syngenta (Jealott’s Hill, Product Characterization and Product Safety) and Henrik Cornelisson van de Ven, Anna Baglai, Sjoerd van der Wal, and Eva M. O. L. Johansson from the University of Amsterdam for their support and valuable discussions.
Supporting Information Available
The Supporting Information is available free of charge on the ACS Publications website at DOI: 10.1021/acs.analchem.5b04051.
Supporting figures and additional experimental and analytical details (PDF).
The authors declare no competing financial interest.
Supplementary Material
References
- Marchetti N.; Fairchild J. N.; Guiochon G. Anal. Chem. 2008, 80 (8), 2756–2767. 10.1021/ac7022662. [DOI] [PubMed] [Google Scholar]
- Eeltink S.; Dolman S.; Vivo-Truyols G.; Schoenmakers P.; Swart R.; Ursem M.; Desmet G. Anal. Chem. 2010, 82 (16), 7015–7020. 10.1021/ac101514d. [DOI] [PubMed] [Google Scholar]
- Murphy R. E.; Schure M. R.; Foley J. P. Anal. Chem. 1998, 70 (8), 1585–1594. 10.1021/ac971184b. [DOI] [Google Scholar]
- Horie K.; Kimura H.; Ikegami T.; Iwatsuka A.; Saad N.; Fiehn O.; Tanaka N. Anal. Chem. 2007, 79 (10), 3764–3770. 10.1021/ac062002t. [DOI] [PubMed] [Google Scholar]
- Vivó-Truyols G.; Van Der Wal S.; Schoenmakers P. J. Anal. Chem. 2010, 82 (20), 8525–8536. 10.1021/ac101420f. [DOI] [PubMed] [Google Scholar]
- Davis J. M.; Stoll D. R.; Carr P. W. Anal. Chem. 2008, 80 (2), 461–473. 10.1021/ac071504j. [DOI] [PubMed] [Google Scholar]
- Filgueira M. R.; Huang Y.; Witt K.; Castells C.; Carr P. W. Anal. Chem. 2011, 83 (24), 9531–9539. 10.1021/ac202317m. [DOI] [PMC free article] [PubMed] [Google Scholar]
- François I.; Sandra K.; Sandra P. Anal. Chim. Acta 2009, 641 (1–2), 14–31. 10.1016/j.aca.2009.03.041. [DOI] [PubMed] [Google Scholar]
- Jandera P.; Hájek T.; Cesla P. J. Chromatogr. A 2011, 1218 (15), 1995–2006. 10.1016/j.chroma.2010.10.095. [DOI] [PubMed] [Google Scholar]
- François I.; de Villiers A.; Sandra P. J. Sep. Sci. 2006, 29 (4), 492–498. 10.1002/jssc.200500451. [DOI] [PubMed] [Google Scholar]
- Stoll D. R.; Li X.; Wang X.; Carr P. W.; Porter S. E. G.; Rutan S. C. J. Chromatogr. A 2007, 1168 (1–2), 3–43. 10.1016/j.chroma.2007.08.054. [DOI] [PMC free article] [PubMed] [Google Scholar]
- Uliyanchenko E.; Cools P. J. C. H.; van der Wal S.; Schoenmakers P. J. Anal. Chem. 2012, 84 (18), 7802–7809. 10.1021/ac3011582. [DOI] [PubMed] [Google Scholar]
- Sarrut M.; Crétier G.; Heinisch S. TrAC, Trends Anal. Chem. 2014, 63, 104–112. 10.1016/j.trac.2014.08.005. [DOI] [Google Scholar]
- Stoll D. R.; Cohen J. D.; Carr P. W. J. Chromatogr. A 2006, 1122 (1–2), 123–137. 10.1016/j.chroma.2006.04.058. [DOI] [PubMed] [Google Scholar]
- Opiteck G. J.; Jorgenson J. W.; Anderegg R. J. Anal. Chem. 1997, 69 (13), 2283–2291. 10.1021/ac961156d. [DOI] [PubMed] [Google Scholar]
- Cacciola F.; Jandera P.; Hajdú Z.; Česla P.; Mondello L. J. Chromatogr. A 2007, 1149 (1), 73–87. 10.1016/j.chroma.2007.01.119. [DOI] [PubMed] [Google Scholar]
- Cacciola F.; Jandera P.; Blahová E.; Mondello L. J. Sep. Sci. 2006, 29 (16), 2500–2513. 10.1002/jssc.200600213. [DOI] [PubMed] [Google Scholar]
- Pepaj M.; Wilson S. R.; Novotna K.; Lundanes E.; Greibrokk T. J. Chromatogr. A 2006, 1120 (1–2), 132–141. 10.1016/j.chroma.2006.02.031. [DOI] [PubMed] [Google Scholar]
- De Vos J.; Eeltink S.; Desmet G. J. Chromatogr. A 2015, 1381, 74–86. 10.1016/j.chroma.2014.12.082. [DOI] [PubMed] [Google Scholar]
- De Vos J.; Desmet G.; Eeltink S. J. Chromatogr. A 2014, 1360, 164–171. 10.1016/j.chroma.2014.07.072. [DOI] [PubMed] [Google Scholar]
- van de Ven H. C.; Gargano A. F. G.; van der Wal S.; Schoenmakers P. J. J. Chromatogr. A 2016, 1427, 90. 10.1016/j.chroma.2015.11.082. [DOI] [PubMed] [Google Scholar]
- Urban J.; Škeříková V.; Jandera P.; Kubíčková R.; Pospíšilová M. J. Sep. Sci. 2009, 32 (15–16), 2530–2543. 10.1002/jssc.200900202. [DOI] [PubMed] [Google Scholar]
- Jandera P.; Fischer J.; Lahovská H.; Novotná K.; Česla P.; Kolářová L. J. Chromatogr. A 2006, 1119 (1–2), 3–10. 10.1016/j.chroma.2005.10.081. [DOI] [PubMed] [Google Scholar]
- Tian H.; Xu J.; Guan Y. J. Sep. Sci. 2008, 31 (10), 1677–1685. 10.1002/jssc.200700559. [DOI] [PubMed] [Google Scholar]
- Verstraeten M.; Pursch M.; Eckerle P.; Luong J.; Desmet G. Anal. Chem. 2011, 83 (18), 7053–7060. 10.1021/ac201207t. [DOI] [PubMed] [Google Scholar]
- Beelders T.; Kalili K. M.; Joubert E.; de Beer D.; de Villiers A. J. Sep. Sci. 2012, 35 (14), 1808–1820. 10.1002/jssc.201200060. [DOI] [PubMed] [Google Scholar]
- Schoenmakers P.; Aarnoutse P. Anal. Chem. 2014, 86 (13), 6172–6179. 10.1021/ac301162b. [DOI] [PubMed] [Google Scholar]
- Vivó-Truyols G.; Lopatka M.; Barcaru A.; Sjerps M. J. J. Chromatogr. A. 2016, online, n/a. 10.1016/j.chroma.2015.12.063. [DOI] [PubMed] [Google Scholar]
- Filgueira M. R.; Castells C. B.; Carr P. W. Anal. Chem. 2012, 84 (15), 6747–6752. 10.1021/ac301248h. [DOI] [PMC free article] [PubMed] [Google Scholar]
- Schellinger A. P.; Carr P. W. J. Chromatogr. A. 2006, 1109 (2), 253–266. 10.1016/j.chroma.2006.01.047. [DOI] [PubMed] [Google Scholar]
- Li X.; Stoll D. R.; Carr P. W. Anal. Chem. 2009, 81 (2), 845–850. 10.1021/ac801772u. [DOI] [PMC free article] [PubMed] [Google Scholar]
- Potts L. W.; Stoll D. R.; Li X.; Carr P. W. J. Chromatogr. A 2010, 1217 (36), 5700–5709. 10.1016/j.chroma.2010.07.009. [DOI] [PMC free article] [PubMed] [Google Scholar]
- Tranchida P. Q.; Dugo P.; Dugo G.; Mondello L. J. Chromatogr. A 2004, 1054 (1–2), 3–16. 10.1016/S0021-9673(04)01301-9. [DOI] [PubMed] [Google Scholar]
- Cacciola F.; Beccaria M.; Donato P.; Mondello L.; Dugo P. LC GC Eur. 2014, 27 (11), 570–577. [Google Scholar]
- Dixon S. P.; Pitfield I. D.; Perrett D. Biomed. Chromatogr. 2006, 20 (6–7), 508–529. 10.1002/bmc.672. [DOI] [PubMed] [Google Scholar]
- Donato P.; Cacciola F.; Mondello L.; Dugo P. J. Chromatogr. A 2011, 1218 (49), 8777–8790. 10.1016/j.chroma.2011.05.070. [DOI] [PubMed] [Google Scholar]
- Horvatovich P.; Hoekman B.; Govorukhina N.; Bischoff R. J. Sep. Sci. 2010, 33 (10), 1421–1437. 10.1002/jssc.201000050. [DOI] [PubMed] [Google Scholar]
- Vonk R. J.; Gargano A. F. G.; Davydova E.; Dekker H. L.; Eeltink S.; de Koning L. J.; Schoenmakers P. J. Anal. Chem. 2015, 87 (10), 5387–5394. 10.1021/acs.analchem.5b00708. [DOI] [PubMed] [Google Scholar]
- Vega Morales T.; Torres Padrón M. E.; Sosa Ferrera Z.; Santana Rodríguez J. J. TrAC, Trends Anal. Chem. 2009, 28 (10), 1186–1200. 10.1016/j.trac.2009.07.011. [DOI] [Google Scholar]
- Glaubitz J.; Schmidt T. J. Surfactants Deterg. 2015, 18 (2), 339–353. 10.1007/s11743-014-1654-6. [DOI] [Google Scholar]
- Gorshkov A. V.; Much H.; Becker H.; Pasch H.; Evreinov V. V.; Entelis S. G. J. Chromatogr. A 1990, 523, 91–102. 10.1016/0021-9673(90)85014-M. [DOI] [Google Scholar]
- Jiang X.; Schoenmakers P. J.; Lou X.; Lima V.; van Dongen J. L. J.; Brokken-Zijp J. J. Chromatogr. A 2004, 1055 (1–2), 123–133. 10.1016/j.chroma.2004.08.136. [DOI] [PubMed] [Google Scholar]
- Giddings J. C. J. Chromatogr. A 1995, 703 (1–2), 3–15. 10.1016/0021-9673(95)00249-M. [DOI] [PubMed] [Google Scholar]
- Gilar M.; Olivova P.; Daly A. E.; Gebler J. C. Anal. Chem. 2005, 77 (19), 6426–6434. 10.1021/ac050923i. [DOI] [PubMed] [Google Scholar]
- Koster S.; Mulder B.; Duursma M. C.; Boon J. J.; Philipsen H. J. A.; Velde J. W. v.; Nielen M. W. F.; de Koster C. G.; Heeren R. M. A. Macromolecules 2002, 35 (13), 4919–4928. 10.1021/ma011234l. [DOI] [Google Scholar]
- Nielen M. W.; Buijtenhuijs F. A. Anal. Chem. 1999, 71 (9), 1809–1814. 10.1021/ac981141a. [DOI] [PubMed] [Google Scholar]
Associated Data
This section collects any data citations, data availability statements, or supplementary materials included in this article.


