

Summary
Objectives
We seek to develop a prototype software analytical tool to augment FDA regulatory reviewers’ capacity to harness scientific literature reports in PubMed/MEDLINE for pharmacovigilance and adverse drug event (ADE) safety signal detection. We also aim to gather feedback through usability testing to assess design, performance, and user satisfaction with the tool.
Methods
A prototype, open source, web-based, software analytical tool generated statistical disproportionality data mining signal scores and dynamic visual analytics for ADE safety signal detection and management. We leveraged Medical Subject Heading (MeSH) indexing terms assigned to published citations in PubMed/MEDLINE to generate candidate drug-adverse event pairs for quantitative data mining. Six FDA regulatory reviewers participated in usability testing by employing the tool as part of their ongoing real-life pharmacovigilance activities to provide subjective feedback on its practical impact, added value, and fitness for use.
Results
All usability test participants cited the tool’s ease of learning, ease of use, and generation of quantitative ADE safety signals, some of which corresponded to known established adverse drug reactions. Potential concerns included the comparability of the tool’s automated literature search relative to a manual ‘all fields’ PubMed search, missing drugs and adverse event terms, interpretation of signal scores, and integration with existing computer-based analytical tools.
Conclusions
Usability testing demonstrated that this novel tool can automate the detection of ADE safety signals from published literature reports. Various mitigation strategies are described to foster improvements in design, productivity, and end user satisfaction.
Keywords: Pharmacovigilance, software design, user-computer interface, data mining, translational research
1. Background and Significance
Literature reports are highly relevant to the detection of drug-adverse event (ADE) safety ‘signals’ for drugs and biologic products [1]. The published literature complements the safety information that can be extracted from the FDA Adverse Event Reporting System (FAERS) [2]. Shetty and Dalal described methods to mine the scientific literature to uncover early ADE associations that foreshowed serious safety issues that later stemmed market withdrawal in one instance [3]. In previous work, we conducted a pilot proof-of-concept study in which we assessed the feasibility of detecting ADEs by mining the Medical Subject Heading (MeSH) indexing terms annotated from citations relevant to the fluoroquinolone (FQ) antimicrobials [4]. In that study, we were able to identify, rank, and prioritize quantitative data mining signal scores derived from PubMed/MEDLINE reports for tendinopathy, tendon rupture, torsade de pointes, long QT, and pseudomembranous colitis, adverse events already included in FQ drug labels. We have also explored using PubMed/MEDLINE data to detect ADEs among pharmacologic classes in which the individual component drugs share a similar pharmacologic mode of action (such as topoisomerase inhibitors). This work was conducted in an effort to assess how differences in the safety risk profiles for individual drugs may contribute to an overall safety signal for the pharmacologic class [5], as such variations in risk may have clinically important implications for safe use.
The major pharmacovigilance resources at FDA currently include pre-market focused (Investigational New Drug and New Drug Applications) and post-market focused data sources (such as spontaneous adverse event reports submitted to FAERS) for which FDA uses various data mining tools and techniques to analyze the FAERS reports [6]. Considering that adverse drug reactions (ADR) contribute to prolonged hospitalizations, increased health care costs, and an increased risk for death [7, 8], systematically rendering useful pharmacovigilance data from published scientific reports could streamline access to and analysis of critical published scientific evidence that is essential to timely informed decision making. Integrating this information with other biomedical resources (such as FAERS) promotes a comprehensive, multimodal approach to pharmacovigilance.
PubMed/MEDLINE, the National Library of Medicine’s (NLM/NIH) premier biomedical literature database, is among the largest and most comprehensive electronic scientific literature databases worldwide. In contrast to the spontaneous case reports in FAERS, MEDLINE offers a broader diversity of content spanning various scientific disciplines (such as chemistry, pharmacology, and genomics), publication types (such as case series, randomized clinical trials, and meta-analyses), and information relevant to mechanistic physiologic pathways that may underpin a potential ADE association. In addition, whereas FAERS is a post-market product safety resource, published scientific reports in PubMed/MEDLINE may span the entire life cycle of a drug or biologic product from early pre-market development through useful market life.
In this applied research project, we seek to develop a prototype software tool to automate the detection and analysis of emerging ADEs from literature reports. We also seek to better understand the desired requirements for an aspirational full production system by obtaining feedback through a usability study. This approach provides us with the opportunity to devise better software solutions to meet the operational needs of intended users.
2. Objectives
Design a prototype, web-based, software analytical tool that can accept the input of PubMed/MEDLINE structured datasets, generate ADE safety signals through quantitative data mining, and produce graphical analytics to visualize overall trends and patterns. We envision a dynamic, web-based, analytical tool to systematically query, data mine, detect, and analyze drug-adverse event (ADE) safety ‘signals’ derived from literature reports.
Conduct a usability study involving a small group of intended FDA regulatory review users to evaluate ease of learning, ease of software use, user satisfaction, and organizational fit within the FDA pharmacovigilance workplace environment and culture.
3. Methods
The following subsections describe the prototype development, PubMed/MEDLINE datasets, and the procedures employed for usability testing.
3.1 Software Prototype Development
3.1.1 Prototype Development Team
The prototype development team consisted of several FDA pharmacovigilance subject matter experts, an information resource specialist from the National Library of Medicine/NIH, and an FDA contract information technology and data management company. This development team included a regulatory review team leader, and the team also received advice periodically from safety evaluator end users who provided feedback to assist us in engineering the selection of data visualizations for the prototype. The prototype development project was initiated in October 2015 and was completed in September 2016.
3.1.2 Prototype Development
The prototype software tool was called ‘PEARL’, an acronym for ‘Prospective Detection of Emerging Drug-Adverse Event Safety Signals from Relevant Scientific Literature through Quantitative Data Mining of MEDLINE Indexing Terms’. The software tool was developed using open source components. The web portal was constructed using open source front-end JavaScript components. The open source D3.js JavaScript library was used for creating data related visualizations. Open source PostgreSQL was used as the relational database to store the structured MEDLINE datasets as well as to store and retrieve the quantitative data mining outputs.
3.1.3 PEARL Software User Interface Specifications
We sought the development of a user-friendly graphical interface that included: (1) drop down menus to select drugs and adverse events of interest, (2) embedded links for easy access to abstracts and full text citation versions (where available) through PubMed, (3) an audit trail of parameters selected for individual queries, (4) predefined statistical measures of disproportionality, (5) exportable tables of statistical data mining outputs, and (6) various data visualizations to permit end user assessment of overall trends or patterns in the data. The embedded links to PubMed are crafted through dynamic web links made to PMIDs associated with drug-manifestation pairs through a base URL to which the specific PMIDs are concatenated [9]. The links to full text citations are made through FDA Library resources.
3.1.4 PubMed/MEDLINE Search Algorithm
We use a multifaceted approach that leverages the MeSH indexing terms annotated for citations in PubMed/MEDLINE to retrieve articles that are highly relevant to drugs and adverse effects. The multifaceted approach includes the following three components: (1) a baseline approach for extracting ADEs from MeSH indexing using the co-occurrence of a drug MeSH heading (qualified by an ‘adverse effects’ subheading) and a manifestation MeSH heading (qualified by a ‘chemically-induced’ subheading), (2) a second level of refinement involving pre-coordinated MeSH descriptors that do not require a ‘chemically-induced’ subheading (such as ‘drug-induced liver injury’) as well as additional relevant subheadings (‘contraindications’, ‘poisoning’, and ‘toxicity’), and (3) a third level in which the ADE content is borne by broader terms than the individual drug level descriptor (such as the ‘pharmacological action’ descriptor) [10].
In this earlier work, we assessed the methodology through a quantitative evaluation that focused on the specific contribution of each component of the multifaceted approach for extracting ADEs by leveraging MeSH indexing. Overall, the contribution based on the baseline co-occurrence accounted for 73% of the ADEs, another 21% was extracted using the pre-coordinated descriptors and additional qualifiers, and an additional 6% were extracted after including ADE content borne by broader terms than the individual drug level descriptor [10].
The search query is initiated in the web-based software prototype tool by typing three or more characters in free text fields for the drug name(s) and adverse event term(s) and selecting the name(s) or event(s) of interest from a flat list. A drop-down menu permits the user to select the citation count threshold of interest. The search query methodology captures drug names as reflected in MeSH indexing. MeSH tends to create distinct descriptors for most major drugs; however, some drugs are alternatively indexed as supplementary concept records. MeSH indexing terms can also be used to describe multiple drugs mentioned in an article through the use of a drug group name as represented in the literature (such as ‘fluoroquinolones’). PubMed routinely includes the MeSH heading of interest (such as ‘fluoroquinolones’) as well as the more specific terms (such as the individual drugs ciprofloxacin, enoxacin, and ofloxacin) beneath that heading in the MeSH hierarchy (which is termed ‘exploded’) when performing manual ‘all fields’ searches. However, in our search algorithm, the drug group name (e.g., fluoroquinolones) is not automatically exploded to capture the individual drugs (e.g., individual fluoroquinolone drugs) in the MeSH hierarchy, because the hierarchical groupings of individual drugs are not retained in the configuration of our algorithm. Thus, signals generated from this analytical tool involving drug group name MeSH terms will not automatically include relevant reports for all of the individual drugs of similar pharmacologic mode of action.
3.1.5 Data Mining Quantitative Methods
In analyzing the structured data from PubMed/MEDLINE, various statistical methods can be used to detect instances in which the observed frequency of reporting of drug-event pairs of interest is out of proportion to the expected reporting frequencies for all drug-event pairs in the source data presuming there is no statistical association between the drug and the adverse event. The disproportionality measures are calculated from the individual drug and event frequencies for each drug-event pair as represented in 2 x 2 contingency tables [11]; disproportionately higher observed compared to expected frequencies that exceed thresholds indicate drug-event pair safety ‘signals’ worthy of further assessment by domain experts. The data mining statistical methods that we employed included the proportional reporting ratio (PRR), reporting odds ratio (ROR), and the empirical Bayes geometric mean (EBGM) with their corresponding 95% confidence intervals, and the likelihood ratio test (LRT) with corresponding statistical significance (p-value < 0.05) [11–13]. The quantitative data mining disproportionality outputs were produced through the use of publicly available R modules.
3.2 PubMed/MEDLINE Structured Datasets
The search algorithm is executed using the NCBI Entrez Programming Utilities to generate a list of PubMed/MEDLINE identification numbers (PMIDs) that are used to retrieve the corresponding MEDLINE records in XML format. The data is then extracted and processed into structured datasets (Excel spreadsheets) that were provided to the FDA and their contractors for input and analysis with the prototype tool. Some of the attributes captured in the datasets include the unique PMIDs for each citation, drug name and code as indexed in MeSH, event manifestation term and code as indexed in MeSH, publication year and type, and other metadata.
3.3 Software Prototype Usability Testing
3.3.1 Study Participants
Six FDA Safety Evaluators and Medical Officers with pharmacovigilance domain expertise and skilled in the use of existing computer-based software analytical tools, but not involved in the development of the PEARL tool, volunteered to participate as ‘early adopters’ in the usability testing.
3.3.2 Study Design and Conduct
The ‘early adopters’ accessed the TEST instance of the prototype tool and incorporated it in their normal pharmacovigilance and regulatory review activities during a three month time period (June 6 – August 24, 2016). To facilitate the usability testing, two of us (AS and AR) provided a one hour overview about the tool and provided them with a help-text manual. The manual provided details of the log-in procedure, dashboard layout, functionalities, operation, and exportable outputs. Through this approach, we sought feedback from actual end users having employed the tool in a variety of real-life circumstances that reflect the scope of intended tasks to be supported by the tool.
3.3.3 Metrics
Each participant was instructed to keep a spreadsheet inventory (see supplementary online ► Appendix 1) of instances per month in which they used the web-based prototype tool, including date, drug(s) and adverse event(s) of interest, usefulness of the PubMed/MEDLINE data, outcome, and comments on errors and possible future design enhancements. We subsequently collected information regarding end user proficiency, technical operation, user acceptance and satisfaction with the analytical tool through a self-administered post-use survey/questionnaire (see supplementary online ► Appendix 2). In addition, we conducted in-person, structured debriefing interviews (similar to the critical incident technique [14]) (see supplementary online ► Appendix 3).
4. Results
4.1 PEARL Software User Interface Development
The principal features of the prototype user interface are accessed from five tabs on the opening dashboard: Drug Overview, Table, Tree Map, Heat Map, and Time Course Graph. The drug names and chemically-induced manifestation (event) terms are displayed as indexed in MeSH. Within each tab, embedded links provide access to citation abstracts in PubMed with additional links to full text versions of published reports of interest as available through FDA Library institutional relationships. We employed a citation count of three or more as the threshold to highlight safety signals that deserve further investigation based on the work of Avillach and colleagues [15].
The figures included in this article are screen shots from the PEARL tool user interface. Ciprofloxacin was arbitrarily chosen as the use case for the quantitative data mining outputs and visualizations depicted in the figures for illustrative purposes only. The event terms depicted in the figures reflect the chemically-induced manifestation terms in the MeSH indexing for the retrieved citations. MeSH terms are assigned by NLM human indexers to represent subject content of journal articles. MeSH terms are designed for searching and retrieval of citation content at various levels of specificity within the MeSH hierarchy. As such they may not have the precision or granularity that characterizes established standardized terminologies used to code adverse events, such as the Medical Dictionary for Regulatory Activities (MedDRA).
Dashboard (► Figure 1): The Drug Overview page is immediately accessed on login to the PEARL tool; there is a field for entering the name of a drug of interest as free text (requires three or more characters) followed by selection of the drug from a drop down flat list of drug and chemical names and drug group names as represented in MeSH indexing terms.
The Drug Overview (► Figure 2 depicts the top ten safety signals for a selected drug or drug group as represented in the MeSH indexing (as described in Section 3.1.4 above) as a vertical bar chart with the adverse events aligned in individual bars from left to right in descending order of frequency by citation count. The bar chart is accompanied by a pie chart depicting the distribution of select publication types for the citations that underpin each safety signal.
The Table tab (► Figure 3) provides citation count strata for the drug-adverse event pairs and quantitative data mining signal scores for the drug-adverse event pairs using various disproportionality measures (as described in Section 3.1.4) and is exportable as a .csv file. An audit trail of the user-selected parameters chosen for the query is provided with the exported table.
The Tree Map tab (► Figure 4) provides a graphical display to visually compare the adverse events data mining outputs for a selected drug(s) as a series of nested rectangles that are ordered and sized with respect to the magnitude of the user-selected disproportionality measure (e.g., PRR, ROR, LRT, or EBGM). In ► Figure 4, the tree map displays the ADE data mining outputs for the use case in which the rectangular boxes are ordered and sized by the magnitude of the PRR for the drug-event pair. Two views are available: (1) Drug– color by adverse event, and (2) Adverse event– color by drug.
The Heat Map tab (► Figure 5) displays the various adverse events for a selected drug (or drugs) as a series of boxes arranged vertically in descending fashion by citation count. The graduated color matrix reflects the range of citation counts from deep red (higher citation counts) to deep blue (lower citation counts).
The Time Course Graph (► Figure 6) depicts the time of accrual of citations for each drug-event pair. The relative numbers of citations published in a given year are reflected in the varying sizes of the graphed circles, which contain embedded links to PubMed.
Fig. 1.
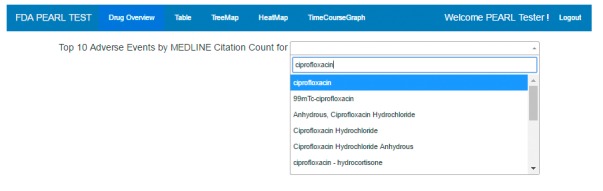
Screen shot of the prototype dashboard. The name of the prototype analytical tool, the five functionality tabs, ‘Welcome’ for the end user, and ‘Logout’ are displayed. The Drug Overview page is immediately accessed on login to the PEARL tool; there is a field for entering the name of a drug of interest as free text (requires three or more characters) followed by selection of the drug from a drop down flat list of drug and chemical names and drug group names as represented in MeSH indexing terms. Ciprofloxacin is an arbitrarily selected use case drug.
Fig. 2.
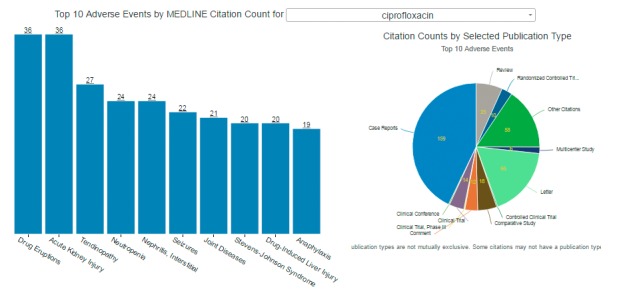
Screen shot of the Drug Overview interface of the prototype. The bar chart displays adverse events from left to right in descending order by citation count (as indicted by the underlined number over each vertical bar). The pie chart displays the various publication types (also by citation count). The data depicted is for the use case of ciprofloxacin.
Fig. 3.
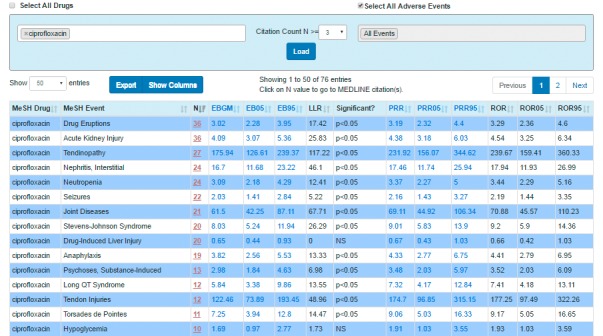
Screen shot of the Table page showing a sampling of the candidate drug-event pairs with corresponding quantitative data mining outputs (‘signal scores’) generated using various statistical disproportionality measures for the use case of ciprofloxacin. The table data can be exported as a .csv file if desired.
Fig. 4.
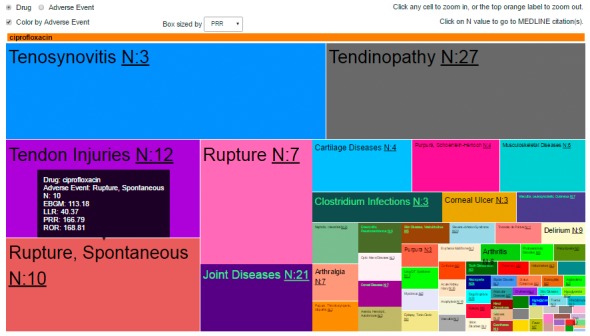
Screen shot of the Tree Map. The data depicted is the drug– color by adverse event view for the use case of ciprofloxacin in which the individual boxes and rectangles are sized corresponding to the magnitude of the user-selected citation count or statistical disproportionality measure from the drop-down menu (PRR has been selected in this example). Moving the cursor over a specific box generates an inset, which shows the name of the drug of interest, adverse event of interest, citation count, and data mining safety signal scores for the drug-event pair.
Fig. 5.
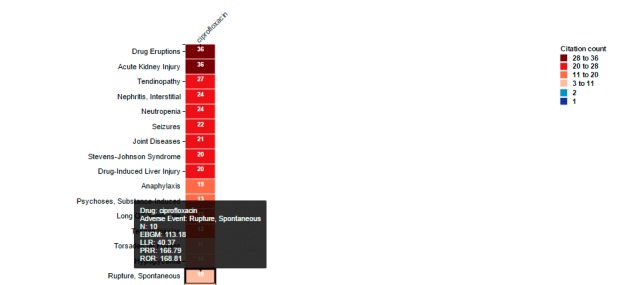
Screen shot from the Heat Map. The data depicted is for the use case of ciprofloxacin. Moving the cursor over a specific box generates an inset, which shows the name of the drug of interest, adverse event of interest, citation count, and data mining safety signal scores for the drug-event pair.
Fig. 6.
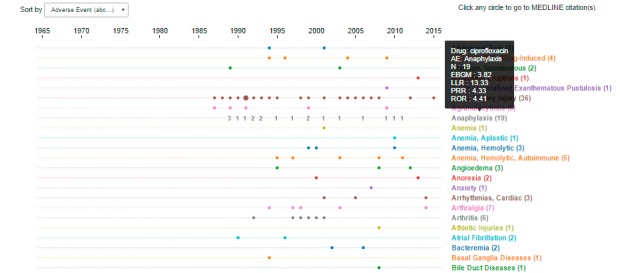
Screen shot from the Time Course Graph. The data depicted is for the use case of ciprofloxacin. Moving the cursor over a specific adverse event term generates an inset, which shows the name of the drug of interest, adverse event of interest, citation count, and data mining safety signal scores for the drug-event pair.
4.2 Early Adopter Usability Testing
Usability testing revealed the participants’ satisfaction with the ease of use and ease of learning of the tool. One responder commented that an important advantage of the tool is that there is no need for a formal training course that would require time away from regular review activities to become skilled in the tools’ various functionalities. The prototype was also considered a time saver that could ‘jumpstart’ or ‘kick start’ internal discussions about emerging ADE safety signals. One respondent favored the automated PEARL search query as retrieving content that was more relevant and ‘desired’ with few false positive hits. These observations cast a favorable impression in terms of the overall fitness of the tool within the FDA workplace culture.
► Table 1 depicts an aggregate summary of the ‘early adopters’ comments obtained during the usability testing. Among the commentary, four notable operational and functionality issues were identified for further investigation: (1) missing drugs and missing adverse event terms, (2) comparability of the prototype’s automated search citation retrieval to a manual PubMed/MEDLINE literature search, (3) interpretation of the data mining disproportionality scores, and (4) interoperability with existing analytical tools already in use in the Agency.
Table 1.
Aggregate Summary of the Early Adopters’ Comments obtained during the Prototype Usability Testing
| Result linked to source of information | ||||
|---|---|---|---|---|
| Characteristic or functionality | Comments with verbatim response examples (as indicated) | Spreadsheet Inventory | Questionnaires | Structured Interviews |
| Ease of use and learning | ”Do not need a formal training course” to use the tool | No | Yes | Yes |
| Graphics were useful, especially those linked to the reference citations | No | Yes | No | |
| Automated search retrieves “more desired” content | Yes | No | Yes | |
| Literature search | Uncertainty about the comparability of the automated search query in the prototype to a manual ‘all fields’ PubMed search | Yes | Yes | No |
| Understanding the limitations of the PEARL search algorithm leveraging MeSH indexing terms compared to a PubMed search (‘all fields’ search) | Yes | Yes | No | |
| Missing drugs | Some newly approved and newly marketed drugs are missing (such as the newer drugs for the treatment of hepatitis C) | Yes | Yes | Yes |
| Unable to search by brand name vs generic name; missing brand names and generic names; inability to limit search to brand name drug only | Yes | Yes | Yes | |
| Missing adverse event terms | A MeSH manifestation term could not be identified that corresponded to some adverse events, such as “eosinophilic pneumonia”, “TEN” (toxic epidermal necrolysis’), and “hepatitis B reactivation” | Yes | No | Yes |
| Data Mining disproportionality scores | The quantitative signal scores need validation | No | No | Yes |
| Difficult to interpret total citation count in scenarios where one main article is followed by multiple commentary articles (which could be misconstrued as separate studies) | Yes | No | Yes | |
| Added value for pharmacovigilance activities | Time saving and efficient | No | Yes | Yes |
| Could ‘jumpstart’/’kick start’ novel signal detection and assessment | No | No | Yes | |
| Filtering by publication type was very helpful for narrowing the search | No | Yes | No | |
| Ease of access to previously published citations for older established drugs | Yes | No | Yes | |
| Fitness for workplace and workplace culture | Helpful for review work | No | No | Yes |
| For user acceptance, need more reliable and predictable literature search results from the prototype tool that are similar to those obtained with a manual PubMed (‘all fields’) search | Yes | Yes | Yes | |
Based on the original requirements for the prototype development and the feedback received following the usability testing, various design recommendations were identified (► Table 2).
Table 2.
Design Recommendations
| Result linked to source of information | ||||
|---|---|---|---|---|
| Operation | Functionality and Design Recommendations with verbatim response examples (as indicated) | Spreadsheet Inventory | Questionnaires | Structured Interviews |
| Drug product search | Align MeSH drugs to better differentiate by formulation | Yes | No | Yes |
| Selecting adverse event terms | Align MeSH manifestation terms to Medical Dictionary for Regulatory Activities (MedDRA) terms, which are also mapped to the adverse event terms annotated from spontaneous adverse event reports in FAERS | No | No | Yes |
| Complement existing analytical tools | Integration with existing analytical tools in FDA to increase interoperability with existing tools | No | No | Yes |
| Drug overview assessment | Add option to see more drug-AE pairs other than top 10 signals | No | No | Yes |
| Add more filters for study characteristics and patient demographics (such as age, gender, and non-human data) | No | No | Yes | |
| Visual analytics | Align visual displays with those of established analytical tools used in FDA | No | No | Yes |
| Audit trail of drug-adverse event query variables | Make audit trail accessible from all tab pages | No | Yes | Yes |
| Desirable user functionalities | Add “what’s new” since last data analysis run | No | No | Yes |
| Consider a Periodic ‘Alert’ (such as on a quarterly basis) | No | No | Yes | |
5. Discussion
In this research project, a new, web-based, prototype software tool was developed to harness published scientific literature reports for ADE detection and analysis. In attempting to meet the increasing regulatory and public health expectations regarding safe drug use, leveraging multiple complementary biomedical resources for pharmacovigilance has become an increasingly important consideration for FDA. The prototype tool buttresses progression towards a multimodal pharmacovigilance model by enriching the scope of information that can be systematically assessed beyond the traditional focus on FAERS data. It speeds review and analysis of possible ADEs through various visualization functionalities, and it supports knowledge discovery related to newly emerging ADEs.
Our usability testing for the prototype tool was aimed at determining the its readiness for operations and fitness to fulfill users’ requirements and business applications. Usability testing indicated several advantages of the software tool including: (1) ease of use of dashboard tabs and visual analytical displays to highlight potential ADEs of interest, (2) ease of access to full text citations of interest using embedded links (drill down), and (3) ease of learning with minimal need for formal training.
Upon completion of the usability testing, the ‘early adopters’ also expressed concerns about four key aspects of the operation and functionality of the prototype: (1) comparability of the tool’s PubMed/MEDLINE search query to a manual PubMed literature search, (2) missing drug names and adverse event terms, (3) interpretation of the data mining disproportionality signal scores, and (4) interoperability with existing analytical tools . We have developed the various mitigation strategies to address these issues, which will be further explored and implemented as future enhancements for the tool.
Perceived differences in the number of citations retrieved using the PEARL automated search compared to a manual (‘all fields’) PubMed search was an identified usability issue. The prototype’s automated search query takes advantage of existing structured MeSH indexing terms to identify relevant citations with greater precision than would be achieved with a manual ‘all fields’ search aimed at broad recall. In general, manual ‘all fields’ searches in PubMed retrieve more citations, but can be limited by a high number of citations to review. However, such PubMed searches could retrieve articles from journals in PubMed that are not indexed in MEDLINE and may also retrieve articles recently deposited but not yet indexed in MEDLINE, which would not be retrieved with the prototype’s current automated MeSH-based search query.
Three potential software solutions include: (1) Apply automatic indexing techniques (NLM Medical Text Indexer, MTI [16]) for indexing articles/citations in real time, so as to make them available to the prototype immediately, mitigating the lag due to human indexing; 2) Adding an embedded link to a broad PubMed search (such as the ADE pair of interest OR’ed with an ‘all fields’ search) to provide a self-check for the end user that all relevant citations were retrieved; (3) Using existing informatics tools (such as NLM’s SemRep program [17]) to extract semantic predications (subject-relation-object triples) from free text in titles and abstracts of citations indicative of biologic plausibility or mechanistic data related to ADEs.
The missing drug names noted by the ‘early adopters’ refers to newly marketed drugs and biologic products whose product names are not denoted by MeSH terms. Similarly, the missing adverse event terms refers to descriptive terminology used to describe an adverse event for which there was no chemically-induced manifestation term(s) correlate in MeSH. These observations likely reflect three aspects of MeSH indexing: (1) MeSH reflects content in the published literature and is not designed or oriented specifically for adverse event coding, (2) MEDLINE indexing of citations with MeSH terms is not immediately available when such reports are first deposited in PubMed, as time is needed for review and annotation by human indexing domain experts (many of the reports about the safety and efficacy of new drugs are included in this PubMed subset), (3) annual updating of the MeSH vocabulary with new terms. Other related mitigation efforts include aligning the MeSH drug names with those in standardized reference terminologies, such as the Anatomic Therapeutic Chemical Classification System (ATC) and RxNorm, and aligning the MeSH manifestation terms to the standardized MedDRA terms. These standardized terminologies are familiar to end users as they are integrated in existing analytical tools.
Various quantitative data mining and statistical methodologies are currently being employed to identify safety ‘signals’ (statistical associations) for ADEs from different data sources [18]. The quantitative data mining signal scores generated with the prototype are hypothesis-generating and do not confirm an actual drug-adverse event association; assessment by domain experts is required. Performance assessments for the disproportionality statistical methods used for safety signal generation have not been performed nor have analyses to identify specific thresholds to highlight drug-event pairs deserving of further investigation been conducted. In future work, we anticipate evaluating the diagnostic accuracy of the various statistical algorithms using existing reference standards (e.g., the OMOP gold standard [19] or the time-indexed reference standard [20]) and by manually evaluating signal scores (potential associations) generated for a sample of drugs and adverse events of interest.
Currently employed analytical tools at FDA are designed for analysis of spontaneous adverse event reporting data and are not readily amenable to loading and analyzing structured datasets of MEDLINE data derived by leveraging MeSH indexing terms. Thus, we aspire to enhance the PEARL prototype tool to be agile and adaptable to process and analyze data from varied biomedical resources.
We plan to explore software solutions to integrate outputs from currently employed data mining tools with the prototype tool. One of the challenges in aiming for a seamless integration of outputs among different analytical tools involves aligning the terminologies integral to each tool to the same standardized terminologies, for example RxNorm or ATC for drug names and MedDRA for adverse event terms. As previously noted, the extracted chemically-induced manifestation MeSH terms for each citation frequently lack the precision and granularity of MedDRA terms, which have been used routinely for adverse event coding for FAERS data; regulatory reviewers are more familiar with the MedDRA hierarchy of adverse event terms and the ‘early adopters’ recommended mapping of MeSH to MedDRA in future enhancements of this tool. We plan future work to explore using RxNorm to assess equivalences between MeSH drug names and those in ATC; we plan to use the Unified Medical Language System (UMLS) Metathesaurus to assist us in mapping MeSH manifestation terms and MedDRA terms reported in FAERS data. We anticipate this effort will require significant human curation to assess granularity differences between the various vocabularies.
There were important limitations inherent to the usability testing procedures employed in this work. The usability testing was subjective and somewhat unstructured, as the participants were not provided with a specific list of predefined tasks or a series of predefined clinical scenarios to assess in a structured survey. Instead, following a training overview, the early adopters were free to explore the various functionalities and system outputs within the range of real-life pharmacovigilance work situations encountered (such as supporting the discovery of newly emerging safety signals not previously identified, enhancing marginal safety signals identified from FAERS, or providing evidence of biologic plausibility for safety signals identified from other resources) and to provide feedback on ease of learning and use, errors, and suggestions for improving the software visualizations and data representations to enhance comprehension and interpretability. Having expertise in pharmacovigilance practices within FDA and being skilled with already existing software analytical tools, they could best understand the tasks within the Agency’s work domain in which the new prototype could be deployed for future use and the desirable features for a web-based tool for accomplishing information visualization and other analytical tasks.
A second drawback was the small sample size of intended FDA users, which may limit generalization of the study findings to the broader group of regulatory reviewers throughout the FDA. Future work will involve a larger group of end users with varying levels of expertise to better assess the impact of the tool on overall workflow efficiency, workplace cultural acceptability, and interoperability with existing analytical tools that are part of current business practices.
6. Conclusion
Through our usability and technical evaluation, we confirmed that this novel, open source prototype analytical tool provides a feasible web-based method for detecting ADE safety signals from indexing terms annotated for published scientific reports in PubMed/MEDLINE. Harnessing scientific reports and other diverse safety data streams will aid FDA reviewers in predicting potential ADRs, improve systematic evaluation of safety signal data, prioritize signals that warrant further evaluation, and provide useful information to regulators and healthcare providers to ensure safe use.
In our future work oriented to the aspirational goal of a full production web-based tool, we will consider mitigation strategies to overcome various operational and performance challenges and additional enhancements based on the usability feedback. We anticipate that the further development of the tool will foster added value for pharmacovigilance domain experts in regulatory, pharmaceutical, and academic areas.
Multiple Choice Questions
-
Which characteristics of PubMed/MEDLINE enhances its utility as a complimentary biomedical resource for pharmacovigilance?
broad diversity of human, animal, and in vitro data.
wide variety of publication formats (such as case reports, observational and clinical studies)
citations span the entire life cycle of a drug
all of the above
Correct answer: D
The PubMed/MEDLINE database is an appealing reource for pharmacovigilance purposes due to its robust size of approximately 25 million scientific literature reports, large number of indexed journals (approximately 5,600 biomedical journals), and diversity of content and publication types (including case reports, patient registries, clinical trials, and others). In contrast to postmarket spontaneous adverse event reports, PubMed/MEDLINE also offers the advantage of providing scientific information that spans the entire life cycle of a drug from early pre-market drug development through useful market life. These features make the biomedical literature a very important source of information about ADEs.
-
In the context of Pharmacovigilance, data mining of scientific literature for product safety enables us to:
detect causal ADE relationships
detect hypothethical ADE relationships
enhance marginal signals from Spontaneous Reporting Systems.
B and C
Correct answer: D
Data mining of the scientific literature uses statistical measures of disproportionality between the observed and expected frequencies of a unique drug-event pair compared to all drug-event pairs in the MEDLINE data to generate ‘safety signals’. These statistical measures may indicate hypothetical associations and do not indicate the existence of causal relationships between the drug product exposures and the adverse events; assessment by domain experts is required to make those evaluations. Safety signals generated from one biomedical resource may enhance or corroborate similar signals from other complementary resources.
Supplementary Material
Acknowledgements
We wish to acknowledge S. Buckman-Garner, S. Haider, B. Weaver, S. Schmidt, L. Peters, C. Patel, C. Chamberlain, S. Bersoff-Matcha, S. Connelly, P. Kim, and F. Pucino for their support of the development of this prototype tool.
Funding Statement
Funding: We wish to acknowledge financial support from the FDA/CDER/Office of Translational Sciences and the Intramural Research Program, NIH, National Library of Medicine.
The views expressed are those of the authors and do not necessarily represent the views of the US FDA, the NIH, or the US Government.
Footnotes
Clinical Relevance Statement
This novel prototype web-based tool is relevant to domain experts in government, industry and academia who aim to systematically harness published literature reports for ADE safety signals. The tool enhances efforts to improve the quality of pre- and post-market safety signal generation, augment analysis of current literature reports, and enhance life cycle safety surveillance for marketed products.
Conflict of Interest
The authors declare that they have no conflicts of interest in the research work.
Human Subjects Protection
Subject participation in the usability testing was voluntary and conducted in compliance with ethical standards.
References
- 1.Pontes H, Clément M, Rollason V. Safety signal detection: the relevance of literature review. Drug Saf 2014; 37(7): 471-479. doi:10.1007/s40264–014–0180–9. [DOI] [PubMed] [Google Scholar]
- 2.Xu R, Wang Q. Large-scale combining signals from both biomedical literature and the FDA Adverse Event Reporting System (FAERS) to improve post-marketing drug safety signal detection. BMC Bioinformatics 2014; 15: 17 doi:10.1186/1471–2105–15–17. [DOI] [PMC free article] [PubMed] [Google Scholar]
- 3.Shetty KD, Dalal SR. Using information mining of the medical literature to improve drug safety. J Am Med Inform Assoc 2011; 18(5): 668-674. doi:10.1136/amiajnl-2011–000096. [DOI] [PMC free article] [PubMed] [Google Scholar]
- 4.Sorbello A, Harpaz R, Szarfman A, Bodenreider O, Winnenburg R, Ripple A, Tonning J, Francis H. Detecting drug-adverse event safety signals through quantitative data mining of MEDLINE indexing terms: A pilot study. 54th Interscience Conference on Antimicrobial Agents and Chemotherapy (ICAAC 2014); September 2014; Washington, DC Poster A-055. [Google Scholar]
- 5.Winnenburg R, Sorbello A, Bodenreider O. Exploring adverse drug events at the class level. J Biomed Semantics 2015; 6: 18 doi: 10.1186/s13326–015–0017–1. [DOI] [PMC free article] [PubMed] [Google Scholar]
- 6.Duggirala HJ, Tonning JM, Smith E, Bright RA, Baker JD, Ball R, Bell C, Bright-Ponte S, Botsis T, Bouri K, Boyer M, Burkhart K, Condrey G, Chen J, Martin D, Oladipo T, O’Neill R, Palmer L, Paredes A, Rochester G, Sholtes D, Szarfman A, Wong H, Xu Z, Kass-Hout T. Use of data mining at the Food and Drug Administration. J Am Med Inform Assoc 2016; 23(2): 428-434. doi: 10.1093/jamia/ocv063. [DOI] [PMC free article] [PubMed] [Google Scholar]
- 7.Classen DC, Pestotnik SL, Evans RS, Lloyd JF, Burke JP. Adverse drug events in hospitalized patients. Excess length of stay, extra costs, and attributable mortality. JAMA 1997; 277(4): 301-306. [PubMed] [Google Scholar]
- 8.Bates DW, Spell N, Cullen DJ, Burdick E, Laird N, Petersen LA, Small S, Sweitzer B, Leape L. The costs of adverse drug events in hospitalized patients. Adverse Drug Events Prevention Study Group. JAMA 1997; 277(4): 307-311. [PubMed] [Google Scholar]
- 9.Web Link Help [Internet]. Bethesda (MD): National Center for Biotechnology Information (US); 2005-. Creating a Web Link to PubMed. 2006 Oct 16 [Updated 2016 Jun 24]. Available from: https://www.ncbi.nlm.nih.gov/books/NBK3862/.
- 10.Winnenburg R, Sorbello A, Ripple A, Harpaz R, Tonning J, Szarfman A, Francis H, Bodenreider O. Leveraging MEDLINE indexing for pharmacovigilance – Inherent limitations and mitigation strategies. J Biomed Inform 2015; 57: 425-435. doi: 10.1016/j.jbi.2015.08.022. [DOI] [PMC free article] [PubMed] [Google Scholar]
- 11.van Manen RP, Fram D, DuMouchel W. Signal detection methodologies to support effective safety management. Expert Opin Drug Saf 2007; 6(4): 451-464. [DOI] [PubMed] [Google Scholar]
- 12.DuMouchel W, Pregibon D. Empirical Bayes Screening for Multi–Item Associations. Proceedings of the Seventh ACM SIGKDD International Conference on Knowledge Discovery and Data Mining, San Diego, CA; August 2001 New York: ACM Press; 67–76. [Google Scholar]
- 13.Huang L, Zalkikar J, Tiwari RC. A Likelihood Ratio Test Based Method for Signal Detection With Application to FDA’s Drug Safety Data. J Am Stat Assoc 2011; 106(496):1230–1241. [Google Scholar]
- 14.Lindberg DA, Siegel ER, Rapp BA, Wallingford KT, Wilson SR. Use of MEDLINE by physicians for clinical problem solving. JAMA 1993; 269(24): 3124-3129. [PubMed] [Google Scholar]
- 15.Avillach P, Dufour JC, Diallo G, Salvo F, Joubert M, Thiessard F, Mougin F, Trifiro G, Fourrier-Reglat A, Pariente A, Fieschi M. Design and validation of an automated method to detect known adverse drug reactions in MEDLINE: a contribution from the EU-ADR project. J Am Med Inform Assoc 2013; 20(3): 446-452. doi: 10.1136/amiajnl-2012–001083. [DOI] [PMC free article] [PubMed] [Google Scholar]
- 16.Mork J, Jimeno Yepes A, Aronson A. The NLM Medical Text Indexer System for Indexing Biomedical Literature. BioASQ 2013. [Google Scholar]
- 17.Rindflesch TC, Fiszman M. The interaction of domain knowledge and linguistic structure in natural language processing: interpreting hypernymic propositions in biomedical text. J Biomed Inform 2003; 36(6): 462-477. [DOI] [PubMed] [Google Scholar]
- 18.Harpaz R, DuMouchel W, Shah NH, Madigan D, Ryan P, Friedman C. Novel data-mining methodologies for adverse drug event discovery and analysis. Clin Pharmacol Ther 2012; 91(6): 1010-1021. doi: 10.1038/clpt.2012.50. [DOI] [PMC free article] [PubMed] [Google Scholar]
- 19.Ryan D, Schuemie M, Welebob E, Duke J, Vanemtine S, Hartzema A. Defining a reference set to support methodological research in drug safety. Drug Saf 2013; 36 (Suppl. 1): S33-S47. [DOI] [PubMed] [Google Scholar]
- 20.Harpaz R, Odgers D, Gaskin G, DuMouchel W, Winnenburg R, Bodenreider O, Ripple A, Szarfman A, Sorbello A, Horvitz E, White R, Shah N. A time-indexed reference standard of adverse drug reactions. Sci Data 2014; 1: 140043 doi:10.1038/sdata.2014.43. [DOI] [PMC free article] [PubMed] [Google Scholar]
Associated Data
This section collects any data citations, data availability statements, or supplementary materials included in this article.