

Abstract
From a molecular perspective, enactors of function in biology are intact proteins that can be variably modified at the genetic, transcriptional, or post-translational level. Over the past 30 years, mass spectrometry (MS) has become a powerful method for the analysis of proteomes. Prevailing bottom-up proteomics operates at the level of the peptide, leading to issues with protein inference, connectivity, and incomplete sequence/modification information. Top-down proteomics (TDP), alternatively, applies MS at the proteoform level to analyze intact proteins with diverse sources of intramolecular complexity preserved during analysis. Fortunately, advances in prefractionation workflows, MS instrumentation, and dissociation methods for whole-protein ions have helped TDP emerge as an accessible and potentially disruptive modality with increasingly translational value. In this review, we discuss technical and conceptual advances in TDP, along with the growing power of proteoform-resolved measurements in clinical and translational research.
Keywords: mass spectrometry, top-down proteomics, proteoforms, intact protein analysis, translational proteomics
1. INTRODUCTION
Top-down proteomics (TDP) is the study of the proteoform. The term proteoform designates all of the different molecular forms in which the protein product of a single gene can be found, encompassing all forms of genetic variation, alternative splicing of RNA transcripts, and post-translational modifications (PTMs) (Figure 1) (1). Coined just two years ago, the term proteoform has clarified some aspects in the field of whole-protein measurement and characterization. Before the proteoform, common nomenclature used to denote discrete products lacked the gene-centric context of leading protein databases. Until the Consortium for Top Down Proteomics was established in 2012 with a mission focused on the promotion of research, collaboration, and acceleration of the comprehensive analysis of intact proteins and their complexes, the culture of TDP was somewhat insular and highly focused on technical gains. Few labs excelled in the practice, and conventions were unstandardized. The following terms could be found in the literature to describe the same proteoform: protein form, protein isoform, protein species, protein variant, or protein mod form. This confusion did not facilitate progress, given the importance of comprehending all sources of protein variation in basic and translational research, especially now that technologies exist to measure it. Thus, the idea of the proteoform was born as a term to unite research efforts in TDP into a concerted drive to understand and measure the genetic and chemical complexity of amino acid biopolymers with complete molecular specificity.
Figure 1.

Proteoforms capture molecular specificity. A base primary sequence derived from a single gene, once combinatorially modified into a final functional form, is termed a “proteoform.”
The semantics of TDP followed throughout this review are summarized in Figure 2. As described above, the term proteoform denotes the basic unit of TDP: a specific primary structure of an intact protein translated from a specific gene and possessing a precisely characterized and localized combination of PTMs, splice variants, and genetic variation. Currently, there is no universal analog of the protein accession number for proteoforms; therefore, their classification from lab to lab is not standardized or readily deployable. To facilitate top-down data searching and sharing of the future, the Consortium for Top Down Proteomics aims to collate well-characterized proteoforms that have been published into its freely accessible, online Proteoform Repository and assign them proteoform identifiers (http://repository.topdownproteomics.org/). Until recently, the metric for most large-scale proteomics analyses was a report of protein identifications (IDs). Each ID stipulates a unique accession number in a protein database, such as UniProtKB, and is specific only to the isoform level of protein primary sequence (i.e., all sequences generated by known alternative splicing, alternative promoter usage, and alternative translation initiation for a given gene). Therefore, multiple proteoforms with discrete proteoform identifiers could map to the same ID or accession number, and therein lay the original dilemma and necessity for a separate classification schema and gene-specific repository for proteoforms.
Figure 2.
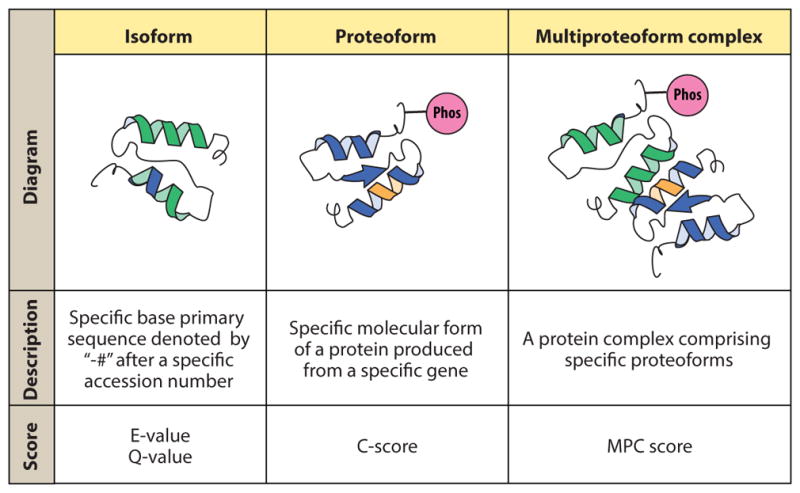
Semantics and nomenclature in top-down proteomics. Abbreviations: MPC, multi-proteoform complex; Phos, phosphorylation.
2. TOP-DOWN PROTEOMICS BY MASS SPECTROMETRY
Proteoforms are usually measured in mixtures using TDP, employing a combination of separations, such as liquid chromatography (LC), and mass spectrometry (MS). TDP represents a major paradigm shift from more common bottom-up proteomics (BUP) workflows, which utilize proteolytic enzymes to digest proteoforms and entire proteomes into peptides before analysis. There are a number of reasons for the prevalence of bottom-up techniques, and we address them throughout this review. In general, peptides are easier to work with because they are readily solubilized and separated prior to MS, and easily dissociated to produce useful fragmentation ladders for identification during a tandem MS and database-searching experiment (2). Practitioners of TDP simply forgo the digestion step (Figure 3). Although this conceptual departure is simple, the practical challenges in separation science, MS, and informatics are far less so. First of all, it is fundamental to note that important information is lost in the reduction from proteoforms to collections of peptides. The protein inference problem in BUP stems from the drawbacks of assembling the sequences of identified peptides to infer the protein content of a sample. The simple act of proteolytic digestion early in the bottom-up workflow eliminates connectivity between intact proteins and the tryptic peptides they yield, complicating computational analysis and biological interpretation (3). Though imperfect, bottom-up methods pervade the field, are useful in answering a wide range of biological questions, and have been instrumental in the progression of MS-based proteomics into translational and clinical research. Using peptides as a surrogate for proteins, though a necessary step in the evolution of MS-based proteomics, is poised for evolution as the direct study of proteoforms becomes more accessible. A number of factors seem to predict this shift, including great advancements in the tools and processes that facilitate research using TDP. The development of these tools and processes throughout the body of top-down literature, along with exciting prospects for their future advancement, are thoroughly discussed here. But first, a quick review of the fundamentals of TDP by MS and a brief history of the field help to set the stage.
Figure 3.

Divergent workflows in top-down and bottom-up proteomics. Top-down simply removes the digestion step used in bottom-up to generate peptides for analysis. Abbreviations: LC-MS/MS, liquid chromatography online with tandem mass spectrometry; PTM, post-translational modification.
2.1. A Brief Note on the Fundamentals of Top-Down Proteomics
Proteomics is the study of proteins, proteoforms, and multi-proteoform complexes, including their identification, characterization, and quantification in a variety of contexts. Separations and MS are the primary tools for TDP we summarize here. High-resolution, accurate mass measurements by the latest generation of mass spectrometers present increasingly robust means to study whole proteins, and MS has become a popular tool in cell and structural biology over the past 30 years. We only briefly touch on some of the fundamentals of MS and its productive foray into basic and translational research. Several useful technical reviews cover this subject in high detail (2, 4–7), and at least seven other reviews in this volume alone cover some aspect of MS or proteomics.
Before MS approaches to proteome analysis emerged in the 1990s, targeted approaches to measure the abundance and localization of specific proteins of interest were prevalent, such as Western blots, fluorescence microscopy, and enzyme-linked immunosorbent assays. Since the advent of soft ionization methods, the goal of whole-protein measurement in high-resolution mass analyzers has progressed from early studies focused on just single proteoforms or closely related proteoform families. MS-based experiments on whole proteins involve the passage of proteoforms from solution to the gas-phase. The application of electrospray ionization (ESI) turns solution-phase intact proteoforms into positively charged molecular ions that are further desolvated with the assistance of heat and gas flow and ultimately liberated as gas-phase protein cations (8). These multiply charged ions are proteoforms that have (usually) been denatured and protonated at basic residues by acid in the solvent used for chromatographic separation. The mass spectrometer, using a complex system of ion optics, mass filters, and mass analyzers, ultimately measures with high accuracy the exact mass-to-charge ratios (m/z) of proteoform ions of interest.
The simplest top-down MS experiments, and where many labs begin in targeted mode, involve several steps. Proteoforms of interest are first prepared for ESI and directly infused into the mass spectrometer. This often involves purification and careful attention to ensure that protein precipitation does not obviate downstream analysis. Often, samples will be prefractionated by molecular mass or isoelectric point to produce a set of fractions that can be further separated by various LC modes coupled online with ESI (LC-MS) (see Section 3.1). Typically, intact proteoform cations (precursors) are collected in an ion trap, filtered by a quadrupole mass filter, or directed by ion optics into a high-resolution mass analyzer. The ion cyclotron resonance (ICR) mass spectrometer utilizes a strong magnetic field to trap ions in a mass-dependent cyclotron motion whose frequency is Fourier transformed into the mass domain, whereas the more recently introduced Orbitrap analyzer captures ions in an electrostatic field that incites mass-dependent axial oscillations along a central electrode (6).
Precursor ions are also fragmented in specialized compartments of the mass spectrometer for identification and characterization, most often by collisional or electron-based dissociation. This is termed tandem MS (also MS/MS or MS2), and improvements in ion fragmentation techniques are detailed below. A key value proposition of TDP is that it can achieve theoretically complete elucidation of the primary amino acid sequence, and when combined with various fragmentation strategies, nearly complete dissociation can be achieved for proteoforms <30 kDa. Practitioners often seek to localize particular sources of mass shifts (Δm) to precise regions of the primary sequence. In an early exploration of this concept, Kelleher et al. (9) compared the practice to the classic logic puzzle where one must detect a false coin by weight in a set of 100 visually identical coins using a minimum number of weighings. Basically, it is more efficient to detect the false coin by consecutively weighing subsets of half of the pile until one hones in on the culprit (maximum of six weighings), instead of weighing each coin out separately (100 possible weighings). TDP is therefore well suited to Δm localization, and complementary fragment ions created by MS/MS can map the entire molecule. These fragment masses and the intact mass of the precursor are used along with the known primary sequence to characterize the parent proteoform using various software tools for targeted TDP (10, 11).
2.2. A Brief History of Top-Down Proteomics
Fred McLafferty (12) penned a fascinating exploration of the history of molecular MS and the dawning of proteomics for this journal in 2011. In the Future Issues section of that review, the first item predicted that TDP would become a routine technique for the characterization of larger proteins in complex mixtures (12). Just five years later, the field of top-down has rapidly advanced to begin the realization of this vision, thanks to improvements in MS tools and processes that are detailed here. The pioneering development that catalyzed the modern era of proteomics can be attributed to the discovery of ESI by Fenn et al. (8). Their foundational paper presented the first molecular mass spectra of proteins, including cytochrome c, myoglobin, and bovine serum albumin, albeit at low resolution (8). Importantly, as a portent of things to come, their final figure depicted the first high-resolution mass spectra of proteins (cytochrome c and myoglobin) collected on a Fourier-transform ion cyclotron resonance (FTICR) mass spectrometer coupled to an ESI apparatus in coordination with the McLafferty and Hunt labs (8, 13).
Foundational studies from McLafferty’s laboratory in the early and mid-1990s helped formalize TDP by MS and establish the utility of high-resolution tandem Fourier-transform mass spectrometry (FTMS) for large polypeptides (14). In a targeted study of the 42-kDa thiaminase I, for example, Kelleher et al. (15) applied high-resolution mass measurement and nozzle-skimmer fragmentation to assign unexpected mass heterogeneities and locate the enzyme active site. In 1999, Kelleher et al. (9) established targeted TDP as a useful tool for obtaining 100% sequence coverage on carbonic anhydrase (29 kDa). Studies such as these helped establish an early role for TDP in single proteoform characterization at a point in history where bottom-up measurements were rapidly increasing in throughput, proteome coverage, and quantitative potential.
This observation raises the important question as to why TDP was relegated to a niche in the early years of proteomics. After all, full sequence coverage and subsequent characterization and localization of PTMs, single nucleotide polymorphisms, and proteolytic cleavages seem highly preferable over the protein inference problem, at least when looking from the outside in. The answer to this question is actually pretty simple: TDP is technically more challenging. In a recent technical note, Compton et al. (16) lay out the primary limitations and instrumentation-related challenges behind implementation of TDP on high mass proteins. MS instrumentation presents a major limitation because the increase in charge states formed by ESI and the potential for interfering species and solvent adduction in accordance with increasing protein mass all serve to hinder the basic detection of high mass species in the first place (16). A number of other reviews (17–19) have delineated the challenges facing TDP and tend to focus on limitations in separations and instrumentation for intact protein analysis as broad and even grand challenges facing the field. For this reason, these two factors are major points of focus in the sections below.
3. PATHS FORWARD IN TOP-DOWN PROTEOMICS
3.1. Prefractionation of Complex Proteoform Mixtures
The proteome is extraordinarily complicated. Imaginations could run wild with estimates of the true number of proteoforms that exist at any time in a given cell, tissue, or organism. If we rationally assume that a variety of PTMs and sequence variants could occur in any combination across the products of the ~20,300 genes identified in the human genome, millions or billions of possible proteoforms could feasibly exist, shifting dynamically in time as proteomes react to stimuli and turn over proteins and their reversible modifications. Though very exciting to think about, the complexity of the proteome greatly complicates large-scale analyses by MS. The dynamic range of the proteome is vast and that of mass spectrometers limited such that only the most highly abundant proteoforms would ever be identified if nothing were done to reduce sample complexity before MS. The typical TDP workflow can be viewed as three primary pillars: (a) front-end fractionation of complex mixtures, (b) high-resolution mass spectral data acquisition at precursor and fragment levels, and (c) data processing and database searching/scoring (20). The first step of the top-down workflow, front-end fractionation and separations, has been extensively developed to accomplish the task of reducing sample complexity before MS.
To avoid ambiguity, we use the term prefractionation to describe all separation techniques applied to proteoforms subsequent to mass analysis (21). These front-end separation strategies have always represented a major challenge for intact proteins, owing to the lower and less predictable solubility of whole proteins compared with that of peptides, as well as their tendency to stick to chromatography media. A large body of research explores new fractionation/separation strategies as well as multidimensional combinations of strategies to optimize proteome coverage. Early proteomics studies, such as the sequence analysis of six gene products from the Escherichia coli thiamin biosynthetic operon from Kelleher et al. (22), used reversed-phase traps for simple step elution before ESI. Shortly thereafter, researchers demonstrated high-throughput mass spectrometric analyses of digested and intact proteins using capillary reversed-phase liquid chromatography (RPLC) (23, 24) or capillary isoelectric focusing (CIEF) (25) coupled online to FTICR to facilitate the study of complex protein mixtures. To develop a two-dimensional approach to proteome fractionation that did not greatly complicate downstream MS, Meng et al. (26) used an acid-labile surfactant instead of sodium dodecyl sulfate (SDS) during continuous elution gel electrophoresis followed by RPLC to greatly reduce the yeast proteome from a mixture of thousands of proteoforms to separate mixtures of just 5–20 components. The benefit of increasing the depth of proteome coverage with more extensive front-end fractionation seemed to outweigh the cost of higher complexity of the experimental design and increased variability for these studies, as platform development was primarily gauged on the basis of the number of IDs that were yielded. For example, in a comparison of two different two-dimensional approaches, Simpson et al. (27) reported 297 IDs by size-exclusion chromatography fractionation, with RPLC-FTICR-MS providing better coverage than the 166 IDs determined from an RPLC-CIEF-FTICR-MS experiment. Interestingly, however, the IDs yielded from either strategy were markedly different, which makes a case for the complementarity of front-end prefractionation approaches.
In addition to CIEF, solution isoelectric focusing is an effective fractionation strategy prior to TDP, although protein recovery remains a significant shortcoming of the technique (21, 28). Capillary zone electrophoresis has also proven to be effective, owing to its low flow rates compatible with ESI and relative speed and efficiency. Early work from the Smith (29) and McLafferty (30) labs established capillary electrophoresis MS as a useful technique capable of enabling the deep interrogation of complex proteomes. More recently, Li et al. (31) optimized this technique for TDP of 30–80-kDa proteoforms (the middle mass range that has proven resistant to traditional chromatography) using Pseudomonas aeruginosa whole-cell lysate. Capillary zone electrophoresis was also recently implemented for the first time online with top-down tandem MS utilizing electron transfer dissociation (ETD) instead of collision-based fragmentation methods, as a complementary technique to improve protein characterization on an electrophoretic timescale (32).
The development of gel-eluted liquid fraction entrapment electrophoresis (GELFrEE) by Tran & Doucette (33, 34) greatly facilitated multidimensional front-end separations for top-down analyses of complex proteomes by presenting a robust strategy for molecular weight-based fractionation of proteoforms in the liquid phase. Multiple studies have combined GELFrEE with other fractionation techniques to develop powerful workflows for large-scale intact-proteome analyses capable of matching the scale of shotgun proteomics when it comes to generating IDs (31, 35–39). An example workflow that depicts multidimensional prefractionation is shown in Figure 4. A major limitation of GELFrEE is that it involves the use of SDS, a surfactant that greatly interferes with ESI and therefore must be extensively washed out of samples. This cleanup procedure is most often performed by methanol/chloroform precipitation or spin columns, neither of which is necessarily reproducible or automatable. A very recent innovation has addressed this issue by coupling asymmetrical flow field-flow fractionation directly between GELFrEE and MS as an online matrix removal platform for TDP and demonstrated the near-complete removal of SDS from samples in just 5 min (40). Creative front-end technical advances like these will make top-down workflows more automated and user-friendly and should contribute to a more widespread adoption of the technique and instrumentation in the future.
Figure 4.

Multidimensional workflow in global, high-throughput proteomics, depicting a complex, large-scale top-down experiment for global proteome analysis. Multiple dimensions of prefractionation are combined prior to mass spectometry measurement to increase proteome coverage by analysis of several fractions. Abbreviations: GELFrEE, gel-elution liquid fraction entrapment electrophoresis; MW, molecular weight; nano-HPLC-MS, nanoliter-flow high-performance liquid chromatography online with mass spectrometry; sIEF, solution isoelectric focusing.
Another interesting recent development in the field of separations, but not necessarily at the front end of the top-down workflow, incorporates ion mobility separation of fragments after precursor proteoforms have already been fragmented by collision-induced dissociation (CID) (41). This work from the Russell lab (41) begins to ameliorate another long-standing limitation of TDP, the dynamic range of fragment ion abundance, and facilitates vast increases in sequence coverage. In recent years, hydrophobic interaction chromatography as a prefractionation technique has been proven to provide high-resolution separation of intact proteins, thanks to the adoption of ammonium tartrate as an MS-compatible salt with selectivity that complements that of reversed-phase chromatography (42). This platform has been improved even further by the edition of an extra dimension of separation, ion-exchange chromatography, to generate a three-dimensional fractionation approach that has led to a vast increase in the IDs determined from each fraction (43). The majority of the recent advances in the prefractionation of proteoforms prior to MS have served to deepen the proteome coverage achievable by large-scale TDP, which is more extensively detailed in Section 4.1.
3.2. Mass Spectrometry Instrumentation and Fragmentation Techniques
In general, the mass spectrometric characterization of polypeptides requires three major steps: (a) ionization, which allows the passage of the polypeptide from the liquid to the gas phase as a charged particle that can be manipulated inside the mass spectrometer (8); (b) the determination of the intact mass of the polypeptide by MS1; and (c) the acquisition of sequence information through the activation and fragmentation of selected precursor ions or MS2. In the case of whole proteoforms, these operations are complicated by the size of the polypeptide chain. Although examples of intact proteins analyzed by matrix-assisted laser desorption ionization (MALDI) exist, TDP traditionally employs ESI as the ionization technique of choice. During ESI performed under denaturing conditions, polypeptides show charge-state polydispersity. This phenomenon is translated into wider charge state envelopes for intact proteoforms when compared with those of shorter peptides. In parallel, the average charge state of precursor ions increases with the length of the polypeptide chain. With these premises in mind, it is easier to understand that TDP is particularly demanding in terms of MS instrumentation.
Different from BUP, high-resolving power is strongly preferred for TDP, particularly for fragment ions created in a tandem MS experiment. For MS1 data on intact proteoforms, isotopic resolution of ion clusters is useful but not required to determine their charge state. However, fragmentation spectra from intact proteoforms are convoluted and contain a variety of product ions of different charge states that can partially overlap each other. Hence, resolving power of >50,000 is typically necessary to correctly deconvolute and fully interpret MS2 spectra. The level of resolving power required by TDP is currently obtained by some time-of-flight (TOF) and FT-based mass analyzers. Modern TOF mass analyzers can exceed resolving powers of 50,000, whereas Orbitrap and ICR FTMS mass analyzers demonstrate resolving powers greater than 1,000,000 (44). Another important parameter for the MS analysis of intact proteins is the signal-to-noise ratio (S/N). Large charge-state envelopes for large proteins translate into protein ion signals split into more channels, with the intensity of each inversely proportional to the number of channels (16). Therefore, for TOF mass analyzers, operating under the single ion count principle, a solution is to accumulate more ion counts than usually done for bottom-up applications. In FTMS, which works often with a fixed amount of ions (or charges) that cannot be increased over certain limits to avoid detrimental space charge effects such as ion coalescence, a widely adopted solution to the S/N problem is averaging multiple scans for both MS1 and MS2. Both solutions, however, slow the experimental duty cycle relative to BUP.
FTICR was the original workhorse in TDP thanks to key technological advances, including an improved Penning trap, enhanced selective ion accumulation with a resolving quadrupole, and increased S/N after application of a DC voltage gradient to the accumulation octopole during ion transfer (45). Further improvements to the ion trapping cell, when coupled with decreased vacuum pressure to account for increased ion kinetic energy, have also been optimized for TDP on a 12 T instrument (46). Recently, the Orbitrap has become an extremely popular FTMS alternative to ICR, because it is a benchtop instrument that is cost effective, accessible, and applicable in promising hybrid architectures (47–49). The high resolving power and sensitivity of the Orbitrap mass analyzer were quickly shown to facilitate intact proteomic measurements on model proteins smaller than 30 kDa (50). Notable early applications of top-down on the Orbitrap from the Kelleher group included deep characterization of the complex array of modifications on the small, DNA-packaging histone proteins (51–53). Creative work from the Fenselau group applied high-resolution, accurate mass measurements from Orbitrap instruments to analyze protein biomarkers of unsequenced bacterial organisms and thus helped place them in their phylogenetic context (54, 55). Additionally in 2012, Ahlf et al. (37) first demonstrated the feasibility of a hybrid ion trap–Orbitrap instrument for medium-scale TDP of complex proteomes. Although FTMS has become a more widespread and dominant strategy for TDP, recent studies also demonstrate the viability of TOF instrumentation for intact protein analysis. For example, the utility of a hybrid quadrupole TOF instrument paired with radical-driven fragmentation methods has been demonstrated for medium- and large-sized model proteins (56) in addition to biologically relevant proteoforms in Neisseria meningitidis invasiveness (57).
As mentioned above, mass spectrometers generally used for TDP often combine the aforementioned high-resolution mass analyzers into hybrid architectures. The presence of multiple mass analyzers in series not only allows for more sophisticated ion manipulations, but also is advantageous for performing adequate ion activation/fragmentation of large biomolecular ions. Slow-heating CID performed in ion traps was originally used for large-scale TDP (36). It is generally outperformed by beam-type collisional activation, such as higher-energy collisional dissociation (HCD), which is realized in quadrupole or multipole devices. Higher degrees of sequence coverage can be reached by radical-driven ion activation techniques, namely electron capture dissociation (ECD) and ETD (58), but the lower fragmentation efficiency (defined as the total ion intensity of product ions over the initial intensity of isolated precursors) of these methods limits their use as the default method in LC-MS experiments. Hence, ECD and ETD are generally applied to the characterization of single proteins, even of extremely large size. The development and implementation of ETD in hybrid platforms commonly used for TDP were important innovations that facilitated future applications (59). For example, Fornelli et al. (60) leveraged ETD and time-domain transient averaging on an Orbitrap instrument to increase sequence coverage, in terms of backbone cleavage sites, of the ~150-kDa immunoglobulin G1 to ~33%, and comparable coverage was achieved shortly thereafter on a 9.4 T modified ICR instrument utilizing ECD (61). Additionally, a landmark study fully sequenced the 115-kDa cardiac myosin binding protein C by combining top-down and middle-down analyses with ECD (62). At the time, this was the largest protein isotopically resolved, thanks to the high resolving power achieved on a modified 9.4 T ICR instrument.
Future developments in ion activation for intact proteins compatible with the requirements and time constraints of proteomics studies might come from the use of photons to deposit energy into whole-protein cations. Specifically, low-energy infrared photons have been used to increase the efficiency of ETD, in a process called activated ion ETD, resulting in a higher S/N of product ions observed in a single scan for model proteins (63). Additionally, 193-nm UV photons were used to characterize ribosomal proteins in LC-MS/MS experiments on complex samples—a fragmentation technique called UV photodissociation (UVPD) (64). This method utilizes the absorption of UV photons by the amide backbone to initiate cleavages that occur statistically over the entire amino acid sequence, allowing for high sequence coverage (65). The advantages of UVPD were recently underscored in studies on green fluorescent protein variants, as this dissociation method yielded a wider variety of fragment ion types that were equally distributed across the amino acid sequence (thus enhancing sequence coverage of the intact protein) when directly compared with CID, HCD, and ETD on the same protein (66). Nearly complete sequence coverage facilitates deep interrogation of primary structure to precisely localize mass discrepancies within the protein. For example, Shaw et al. (67) used UVPD on an Orbitrap instrument to unambiguously characterize a dioxidated proteoform of human Pin1, a protein relevant in Alzheimer’s and cancer disease models.
The various hybrid MS instruments and dissociation strategies will continue to be developed and combined to maximize proteoform characterization and answer more nuanced biological questions. The tribrid Orbitrap platform represents an example advance in hybrid architectures, as it combines three mass analyzers—a quadrupole, linear ion trap, and Orbitrap—in a unique configuration (68). Although this instrument combines mass analyzers in a tribrid fashion, it has also recently been used to combine ETD and HCD (or CID) in a single fragmentation event to provide more useful fragmentation spectra than those provided by any of the dissociation methods alone (69). The combination of ETD with collisional methods, termed EThcD and ETciD, increased protein sequence coverage of the mitotic regulator Bora, allowing kinase-specific localization of phosphorylation residues (69). The technical advancements of the tribrid, including narrow precursor isolation windows and improved vacuum control, were leveraged in combination with the multiple fragmentation methods to deeply interrogate combinatorially modified histone H3 proteoforms with up to eight methylations in a recent study (70). In the field of biopharmaceuticals, another study achieved 95% sequence coverage of granulocytic colony stimulating factor through the combination of ETD, HCD, and CID in an MS3 workflow on this instrument (71).
In the years ahead, we imagine new workflows in TDP will lean toward more targeted analyses as large-scale TDP in discovery mode begins to obtain a degree of proteome coverage comparable with that of BUP. It is feasible that targeted modes for entire proteoforms, not just peptides (as in so-called single-reaction monitoring), will be implemented to quantify the content of a proteoform in small amounts of complex samples. A step in this direction was taken recently by developing a top-down assay to monitor clinically relevant hemoglobin variants caused by single nucleotide polymorphisms at the level of the fragment ion (72). Previously, a clinically applicable ion trap assay was developed to quantify hemoglobin A2 variants at the MS1 level to aid thalassemia diagnosis, and it demonstrated impressive analytical precision that would be acceptable in diagnostic laboratories (73). Opportunities for proteoform-resolved measurements in translational research and clinical practice will continue to become available as the quantitative potential of targeted top-down measurement improves—most likely in conjunction with advances in instrument speed, precursor activation, and fragment ion detection.
4. COVERAGE AND QUANTITATION OF INTACT PROTEOMES
Large-scale proteome analyses are useful for elucidating the myriad proteins and proteoforms that differ between sample states or treatments. Traditionally, these high-throughput studies have been conducted using bottom-up methods that digest the proteome after separation in-gel (74) by SDS polyacrylamide gel electrophoresis or by detergent-free protein extraction in solution with strong chaotropic reagents followed by multidimensional LC (75). Improvements to and advancements from these core bottom-up methodologies have facilitated the identification of thousands of proteins in a single run from very minute amounts of sample, thus setting a high bar for large-scale TDP to follow (76). Fortunately, the intrinsic value of proteoform resolution has inspired the development of top-down techniques that dig ever deeper into proteomes, even in the face of diminished sensitivity of whole proteins relative to well-behaved peptides. Early TDP analyses did not quite circumvent these limitations. They had strived to excel in providing a bird’s-eye view of intact protein structure informed by PTMs and truncations that bottom-up techniques may overlook, instead of matching their depth of coverage. Just in the past few years, however, advances in front-end separation platforms, more intelligent data-acquisition strategies, better instrumentation, and progress in data processing have facilitated a significant uptick in the breadth and depth of coverage for TDP.
4.1. Progress in Proteome Coverage
Early implementations of TDP from 2000 to 2010 focused on bacteria, Archaea, and yeast because basic platform establishment at all stages (sample preparation, data acquisition, and informatics) was the primary goal. For example, Bunger et al. (77) applied the then-recent development of ETD and multidimensional fractionation to identify 322 proteoforms corresponding to 174 proteins in E. coli using custom data analysis and scoring algorithms. Importantly in this study, 94 proteins were uniquely identified in the top-down experiment when compared with a corresponding bottom-up analysis, demonstrating the complementarity of the approaches (77). Furthermore, a large-scale top-down analysis of Methanosarcina acetivorans, a species of the domain Archaea with relevance in biotechnology and energy sectors, yielded 99 unique IDs including unannotated and mispredicted proteins and a number of new proteolytic processing events (78). A number of studies in yeast contributed large-scale top-down analyses of increasing depth of coverage to the canon of literature regarding the Saccharomyces cerevisiae proteome. From this line of research, a novel two-dimensional prefractionation approach was developed to address the front-end implementation problems in whole-protein analysis, while proving the utility of TDP in identifying unannotated truncation forms that peptide-based workflows would likely miss (26). Meng et al. (79) then built upon this study and identified 117 proteoforms with comprehensive sequence coverage in S. cerevisiae and characterized a myriad array of PTMs including N-terminal acetylations, a dimethylation, and a phosphorylation as well as many proteolytic fragments. In 2011, an intensive tube gel-based fractionation strategy was applied to greatly expand the depth of proteome coverage achieved thus far by top-down analyses of the yeast proteome. As a result, 1,103 distinct proteoforms of 530 IDs were characterized (80).
In an early effort to extend progress in TDP developed in microbial systems to human cells, Roth et al. (81) performed a population proteomics-focused study on primary human leukocytes. Their platform, a two-dimensional separation strategy termed multidimensional protein characterization by automated top-down, led to the characterization of 133 proteoforms identified from 67 unique genes (81). This study was the first example of top-down population proteomics in primary human tissues. A landmark study from Tran et al. (36) utilized several advances for improved prefractionation to introduce a net four-dimensional separation platform composed of solution isoelectric focusing followed by GELFrEE and LC-MS for both low- and high-molecular-mass proteins in senescent HeLa S3, B16F10, and H1299 human cell lines. This complex but effective system produced greater than 20-fold increases in proteome coverage from TDP in mammalian systems thus far, yielding 1,043 unique gene product identifications mapping to more than 3,000 proteoforms, including those up to 105 kDa in mass (36). The same cellular system was interrogated once again with a different platform utilizing extensive subcellular fractionation of organelles to improve proteome coverage to >5,000 proteoforms associated with 1,220 IDs (35).
These relatively recent large-scale qualitative studies of the intact human proteome illustrate the capacity of TDP to characterize proteoforms at high throughput, in addition to the added biological relevance of proteoform resolution. For example, dynamic methylation and phosphorylation profiles of HMGA1 isoforms were observed during cellular senescence (36), in addition to 301 integral membrane IDs—which are typically difficult to solubilize and identify in MS experiments (35). Lists of biologically relevant proteoforms such as these will only continue to expand as basic technical advancements—primarily those associated with the paths forward discussed in this review—are implemented in high-throughput studies. Although deeper proteome coverage by TDP is a useful endeavor, some of the most exciting recent progress and opportunities for expansion involve high-throughput quantitation of intact proteomes.
4.2. Toward the Quantitation of Intact Proteomes
The pursuit of robust quantitation strategies in large-scale proteomic studies represents another theme in the progression of TDP. The ability to quantify proteoform abundances across samples will open the door to an increasing presence of TDP in the translational and clinical realms, especially in the field of biomarker discovery. Initially, targeted quantitation of proteoforms within a simple mixture was established through various means as a necessary stepping-stone to whole proteomes. For example, Pesavento et al. (82) simply measured the intensity ratios of multiple, coeluting histone H4 proteoforms and their fragment ions for relative, intraspectrum quantitation in a single sample. Their work introduced the protein ion relative ratio (PIRR) and fragment ion relative ratio metrics calculated from integrating the most abundant isotopes for chosen charge states of intact precursors and fragment ions (82). This technique was recently used in a series of studies to quantify phosphorylated proteoforms of the gold-standard serum biomarker for acute cardiac injury, cardiac troponin I (cTnI), in human heart tissue (83), wild-type and cTnI-mutated mice (84), a rat model of hypertensive heart failure (85), the common swine heart model (86), and Rhesus monkey (87). Though interesting, the applicability of the simple PIRR technique to whole proteomes in multisample quantitative studies is limited owing to the inherent variability associated with high-throughput, large-scale proteomics.
Numerous in vitro and in vivo labeling strategies have also been explored as methods to quantify proteoforms across entire proteomes in global proteomics experiments. Cys-labeling and 14N/15N metabolic labeling were successfully explored in yeast as quantitative strategies in accordance with the intact mass tag (IMT) concept of ID without tandem MS, and 50 protein ratios were determined with 14 unambiguous identifications (88). This mark was improved in a following study utilizing improved separations and instrumentation, yielding 231 metabolically labeled S. cerevisiae protein pairs with 22 unambiguous identifications in the 14–35-kDa range in a single LC-MS/MS run (89). Although still suffering from the limitations of stable isotope labeling–based MS strategies, namely S/N bias and limited dynamic range, this study helped establish a proof of principle for large-scale quantitative TDP. Soon thereafter, Collier et al. (90) tested the feasibility of TDP using stable isotope labeling of amino acids in cell culture (SILAC), which has been a common and robust strategy in quantitative BUP for years (91). Even though 659 SILAC pairs were detected in this study, limitations in the application of SILAC to TDP were noted because the chances of fully labeling entire proteins with heavy arginine at a realistic labeling efficiency decrease as molecular mass increases (90). To address this limitation, the same group followed up with a model to account for the number of amino acids to be labeled in a given proteoform and the incorporation efficiency of the amino acid, and successfully deployed top-down SILAC in human embryonic stem cells (92). Additionally, a pilot study applying the tandem mass tag (TMT) quantification strategy often used in BUP (93) has demonstrated the feasibility of TMT-based quantitation in TDP (94). This method is appealing because this in vitro labeling technique is dependent on tandem MS, so that labeled pairs will have the same chromatographic profiles. This is important because other labeling strategies attempting intact protein quantitation, such as differential cysteine labeling (88), alter retention times and thus hinder intraspectrum quantitation. However, a notable shortcoming of using TMTs in TDP is that only one precursor ion can be selected for fragmentation at a time, whereas complex top-down mass spectrometric profiles are often composed of many charge states that can carry different numbers of TMT labels (94).
Label-free methods to relatively quantify whole proteomes at the resolution of the proteoform present an appealing avenue forward for high-throughput TDP, owing to the relative ease of sample preparation, lack of expensive labeling reagents, and applicability to primary human samples. Differential MS, developed by the Yates group (95) for peptide analysis, presents a viable option for intact protein analysis as well. This technique is an automated proteomics workflow that provides relative quantitation from complete LC-MS data sets, requiring only information on m/z, retention time, and intensity for peaks of interest as well as plenty of replicates to overcome noise (95). In 2010, Mazur et al. (96) published a proof-of-principle demonstration of top-down differential MS by relatively quantifying apolipoprotein proteoforms in HDL isolated from patients with high and low cholesterol.
The concept of the IMT as introduced by the Whitelegge group (97, 98) is important in the context of label-free quantitative workflows for TDP. An IMT simply corresponds to a significant mass spectrometric signal yielding a molecular mass that can be compared to a database and assigned an ID. Work on cystatins (97) and other salivary secretory proteoforms (99) in human saliva has shown that, once IMTs are defined, they can be used to monitor changes in abundance in different samples in a quantitative fashion. Label-free strategies that take advantage of IMT assignment may be the future of high-throughput quantitative TDP, as the most exciting applications in translational and clinical spheres preclude metabolic labeling owing to the nature of primary human samples. For example, Castagnola et al. (100) used extracted ion abundances of IMTs of interest in human saliva to demonstrate hypophosphorylation of salivary proteins in children with autism, which may suggest molecular asynchronies that could be relevant in central nervous system development and subsequent autism pathogenesis. A recent approach using an accurate mass and time tag database for identified proteoforms, intact protein quantitation, has been reported as a top-down relative quantitation strategy with procedural and conceptual elements of IMT-based strategies and differential MS. Using this method, Wu et al. (101) quantitatively profiled 83 proteoforms of 20 IDs in human parotid and submandibular gland secretions.
Even with the advent of high-throughput label-free workflows to quantify proteoforms in entire proteomes, key limitations still exist. For example, statistical assessments in most of the mentioned high-throughput label-free studies were limited to the Student’s t test, which is insufficient to address the many sources of technical variation inherent in complex, multilevel comparative proteomics studies (39). Ntai et al. (39) therefore applied a hierarchical linear model allowing for nested effects that uses two separate ANOVA analyses to test the statistical significance of intensity changes and estimate effect size for quantitation mass targets (QMTs) in a pilot study in a yeast deletion mutant. This study detected 838 total QMTs: Of these QMTs, 120 demonstrated a statistically significant intensity change between the mutant and wild-type yeast strains, and 63% were confidently identified by tandem MS or the IMT approach (39). This label-free quantitative pipeline represents a deployable tool for future translational research because it can be applied to various primary sample types that cannot be metabolically labeled and a statistical framework that can stand up to high patient and treatment variability is already built in.
5. CONCLUSIONS: THE POWER AND PROMISE OF THE PROTEOFORM
Proteoform-resolved measurements contribute added value to translational and clinical research questions that cannot often be matched by less specific measurements of peptides. For example, a recent line of research has applied TDP to the analysis of variant hemoglobin proteoforms in dried blood spots, and these measurements show promise as clinical tools (102, 103). A novel top-down assay has been shown to effectively monitor key diabetic marker proteoforms with accurate quantitation and sensitive PTM detection, all from just 5 μL of blood (104). The body of top-down literature related to microbiology is constantly expanding, while an early foray into the field—the application of organism-specific proteoforms to rapid identification of intact microorganisms—remains a powerful tool with great clinical value (105). The applications of proteoform-resolved measurement are truly diverse and not just biomedical in nature: They range from elucidating mustard allergen proteoforms on an Orbitrap (106) to determining bread-flour quality using a quadrupole-TOF (107).
The field of biomarker discovery in human health and disease is full of potential possibilities for TDP—proteoform-resolved biomarkers may play a strategic role in increasing the return on investment for MS-based proteomics in enabling early detection of human disease. After all, the pathogenesis of many diseases is based on the operation of functional, modified proteoforms in their natural context, and not tryptic peptides. The work has already begun. In 2009, intact surface-enhanced laser desorption/ionization TOF-MS was used to correlate S100A6 proteoforms with patient survival in stage I non-small cell lung cancer (108). Phosphorylated proteoforms of cardiac troponin I have been identified as candidate biomarkers for chronic heart failure by FTICR-MS (109). Orbitrap-based instrumentation has been applied to intact biomarker studies that have identified candidate proteoform biomarkers in cerebrospinal fluid for pediatric brain tumor prognosis (110) as well as multiple salivary proteoforms potentially associated with complications of Down syndrome, including early onset Alzheimer’s disease (111). Additionally, TDP has been applied to biomarker studies concerning cirrhosis at risk of malignancy (ubiquitin PTMs) (112), schizophrenia and bipolar disorder (113), neurodevelopmental disorders (in combination with MALDI MS imaging) (114), Parkinson’s disease (alpha-synuclein proteoforms) (115), and medulloblastoma and pilocytic astrocytoma (116), all in just the past two years.
If TDP is to be described as the study of proteoforms, then there must be a valid reason to do it—or at least an added degree of value over more pervasive and accessible peptide-based methods. Clearly, the applications described in the above passage, as well as throughout the course of this review, prove that there exists a void in multiple domains—from biomedicine to food science—that proteoform-resolved measurements can address. In a recent review in Genome Medicine, Savaryn et al. (117, p. 4) clearly lay out the guiding hypothesis behind the value of proteoform-based endeavors:
We hypothesize, as do many researchers in the top-down proteomics field, that the information obtained from precise, comprehensive whole-protein analysis will be connected more directly to complex disease phenotypes than information gained from bottom-up analyses. As a result, studying proteomes at the whole-protein level will provide a more efficient translation of proteomic data into phenotypic understanding and early detection of disease.
As functional units within higher levels of biological hierarchy, proteoforms offer more specific targets for greater understanding in protein biology. Proteoforms might just be more closely linked to complex phenotypes, and a growing accessibility to the technology to perform TDP will continue to develop in accordance with our understanding of the complexity of these phenotypes.
FUTURE ISSUES.
Thanks to advances in instrumentation (i.e., the Orbitrap), more labs will be able to access TDP workflows and perform proteoform-resolved research.
TDP will expand in translational and even clinical research as the mechanistic insights provided by proteoforms complement those of peptides/protein groups.
Creative multidimensional prefractionation solutions, in combination with advances in top-down deployable instrumentation, will allow large-scale top-down analyses of the global proteome to rival bottom-up measurements in depth of coverage.
New hybrid instruments (i.e., tribrid Orbitrap platform) will widen the scope of top-down applications, while increasing the speed and flexibility of analysis.
In the clinic, proteoform-resolved biomarkers for disease may provide the specificity required to increase the return on investment in MS-based proteomics for biomarker discovery. This has already proven true in bacterial pathogen identification by whole-proteoform MS.
Proteoform-resolved solutions for targeted proteomics will be developed and deployed in a truly quantitative fashion for large-scale validation of intact biomarkers and targets elucidated in discovery experiments.
Acknowledgments
This work was supported by Northwestern University. N.L.K. acknowledges the contribution of Lloyd Smith at the University of Wisconsin-Madison, Nathan Yates at the University of Pitts-burgh, and the members of the Consortium for Top Down Proteomics for helping to define and measure proteoforms. L.F. thanks the Swiss National Science Foundation for an Early Postdoc Mobility Fellowship and R01GM067193 (N.L.K.). T.K.T. was supported by the National Institute of General Medical Sciences of the National Institutes of Health under award number T32GM105538. This review was prepared with partial support from the National Resource for Translational and Developmental Proteomics under Grant P41GM108569. The content is solely the responsibility of the authors and does not necessarily represent the official views of the National Institutes of Health.
Footnotes
DISCLOSURE STATEMENT
N.L.K. declares an affiliation with Thermo Fisher Scientific.
LITERATURE CITED
- 1.Smith L, Kelleher N Consort. Top Down Proteom. Proteoform: a single term describing protein complexity. Nat Methods. 2013;10:186–87. doi: 10.1038/nmeth.2369. [DOI] [PMC free article] [PubMed] [Google Scholar]
- 2.Chait B. Mass spectrometry: bottom-up or top-down? Science. 2006;314:65–66. doi: 10.1126/science.1133987. [DOI] [PubMed] [Google Scholar]
- 3.Nesvizhskii A, Aebersold R. Interpretation of shotgun proteomic data: the protein inference problem. Mol Cell Proteom. 2005;4:1419–40. doi: 10.1074/mcp.R500012-MCP200. [DOI] [PubMed] [Google Scholar]
- 4.Gross JH. Mass Spectrometry: A Textbook. New York: Springer; 2004. [Google Scholar]
- 5.Walther T, Mann M. Mass spectrometry-based proteomics in cell biology. J Cell Biol. 2010;190:491–500. doi: 10.1083/jcb.201004052. [DOI] [PMC free article] [PubMed] [Google Scholar]
- 6.Scigelova M, Hornshaw M, Giannakopulos A, Makarov A. Fourier transform mass spectrometry. Mol Cell Proteom. 2011;10:M111. doi: 10.1074/mcp.M111.009431. 009431. [DOI] [PMC free article] [PubMed] [Google Scholar]
- 7.Zhang Y, Fonslow B, Shan B, Baek M, Yates JR., 3rd Protein analysis by shotgun/bottom-down proteomics. Chem Rev. 2013;113:2343–94. doi: 10.1021/cr3003533. [DOI] [PMC free article] [PubMed] [Google Scholar]
- 8.Fenn J, Mann M, Meng C, Wong S, Whitehorse C. Electrospray ionization for mass spectrometry of large biomolecules. Science. 1989;246:64–71. doi: 10.1126/science.2675315. [DOI] [PubMed] [Google Scholar]
- 9.Kelleher N, Lin H, Valaskovic G, Aaserud D, Fridriksson E, McLafferty F. Top down versus bottom up protein characterization by tandem high-resolution mass spectrometry. J Am Chem Soc. 1999;121:806–12. [Google Scholar]
- 10.Guner H, Close P, Cai W, Zhang H, Peng Y, et al. MASH suite: a user-friendly and versatile software interface for high-resolution mass spectrometry data interpretation and visualization. J Am Soc Mass Spectrom. 2014;25:464–70. doi: 10.1007/s13361-013-0789-4. [DOI] [PMC free article] [PubMed] [Google Scholar]
- 11.Fellers R, Greer J, Early B, Yu X, LeDuc R, et al. ProSight Lite: graphical software to analyze top-down mass spectrometry data. Proteomics. 2015;15:1235–38. doi: 10.1002/pmic.201570050. [DOI] [PMC free article] [PubMed] [Google Scholar]
- 12.McLafferty F. A century of progress in molecular mass spectrometry. Annu Rev Anal Chem. 2011;4:1–22. doi: 10.1146/annurev-anchem-061010-114018. [DOI] [PubMed] [Google Scholar]
- 13.Henry K, Williams E, Wang B, McLafferty F, Shabanowitz J, Hunt D. Tumor-specific loss of 11p15.5 alleles in del11p13 Wilms tumor and in familial adrenocortical carcinoma. PNAS. 1989;86:3247–51. doi: 10.1073/pnas.86.9.3247. [DOI] [PMC free article] [PubMed] [Google Scholar]
- 14.McLafferty F. High-resolution tandem FT mass spectrometry above 10 kDa. Acc Chem Res. 1994;27:379–86. [Google Scholar]
- 15.Kelleher N, Costello C, Begley T, McLafferty F. Thiaminase I (42 kDa) heterogeneity, sequence refinement, and active site location from high-resolution tandem mass spectrometry. J Am Soc Mass Spectrom. 1995;6:981–84. doi: 10.1016/1044-0305(95)00584-Z. [DOI] [PubMed] [Google Scholar]
- 16.Compton P, Zamdborg L, Thomas P, Kelleher N. On the scalability and requirements of whole protein mass spectrometry. Anal Chem. 2011;83:6868–74. doi: 10.1021/ac2010795. [DOI] [PMC free article] [PubMed] [Google Scholar]
- 17.Zhou H, Ning Z, Starr A, Abu-Farha M, Figeys D. Advancements in top-down proteomics. Anal Chem. 2012;84:720–34. doi: 10.1021/ac202882y. [DOI] [PubMed] [Google Scholar]
- 18.Armirotti A, Damonte G. Achievements and perspectives of top-down proteomics. Proteomics. 2010;10:3566–76. doi: 10.1002/pmic.201000245. [DOI] [PubMed] [Google Scholar]
- 19.Ahlf D, Thomas P, Kelleher N. Developing top down proteomics to maximize proteome and sequence coverage from cells and tissues. Curr Opin Chem Biol. 2013;17:787–94. doi: 10.1016/j.cbpa.2013.07.028. [DOI] [PMC free article] [PubMed] [Google Scholar]
- 20.Siuti N, Kelleher N. Decoding protein modifications using top-down mass spectrometry. Nat Methods. 2007;4:817–21. doi: 10.1038/nmeth1097. [DOI] [PMC free article] [PubMed] [Google Scholar]
- 21.Tran J, Doucette A. Rapid and effective focusing in a carrier ampholyte solution isoelectric focusing system: a proteome prefractionation tool. J Proteome Res. 2008;7:1761–66. doi: 10.1021/pr700677u. [DOI] [PubMed] [Google Scholar]
- 22.Kelleher N, Taylor S, Grannis D, Kinsland C, Chiu H, et al. Efficient sequence analysis of the six gene products (7–74 kDa) from the Escherichia coli thiamine biosynthetic operon by tandem high-resolution mass spectrometry. Protein Sci. 1998;7:1796–801. doi: 10.1002/pro.5560070815. [DOI] [PMC free article] [PubMed] [Google Scholar]
- 23.Lee S, Berger S, Martinovic S, Pasa-Tolic L, Anderson G, et al. Direct mass spectrometric analysis of intact proteins of the yeast large ribosomal subunit using capillary LC/FTICR. PNAS. 2002;99:5942–47. doi: 10.1073/pnas.082119899. [DOI] [PMC free article] [PubMed] [Google Scholar]
- 24.Shen Y, Tolic N, Zhao R, Pasa-Tolic L, Li L, et al. High-throughput proteomics using high-efficiency multiple-capillary liquid chromatography with on-line high-performance ESI FTICR mass spectrometry. Anal Chem. 2001;73:3011–21. doi: 10.1021/ac001393n. [DOI] [PubMed] [Google Scholar]
- 25.Martinovic S, Berger S, Pasa-Tolic L, Smith R. Separation and detection of intact noncovalent protein complexes from mixtures by on-line capillary isoelectric focusing-mass spectrometry. Anal Chem. 2000;72:5356–60. doi: 10.1021/ac0004557. [DOI] [PubMed] [Google Scholar]
- 26.Meng F, Cargile B, Patrie S, Johnson J, McLoughlin S, Kelleher N. Processing complex mixtures of intact proteins for direct analysis by mass spectrometry. Anal Chem. 2002;74:2923–29. doi: 10.1021/ac020049i. [DOI] [PubMed] [Google Scholar]
- 27.Simpson D, Ahn S, Pasa-Tolic L, Bogdanov B, Mottaz H, et al. Using size exclusion chromatography-RPLC and RPLC-CIEF as two-dimensional separation strategies for protein profiling. Electrophoresis. 2006;27:2722–33. doi: 10.1002/elps.200600037. [DOI] [PMC free article] [PubMed] [Google Scholar]
- 28.Ouvry-Patat S, Torres M, Quek H, Gelfand C, O’Mullan P, et al. Free-flow electrophoresis for top-down proteomics by Fourier transform ion cyclotron resonance mass spectrometry. Proteomics. 2008;8:2798–808. doi: 10.1002/pmic.200800079. [DOI] [PubMed] [Google Scholar]
- 29.Smith R, Wahl J, Goodlett D, Hofstadler S. Capillary electrophoresis/mass spectrometry. Anal Chem. 1993;65:574A–84A. [Google Scholar]
- 30.Valaskovic G, Kelleher N, McLafferty F. Attomole protein characterization by capillary electrophoresis-mass spectrometry. Science. 1996;273:1199–202. doi: 10.1126/science.273.5279.1199. [DOI] [PubMed] [Google Scholar]
- 31.Li Y, Compton P, Tran J, Ntai I, Kelleher N. Optimizing capillary electrophoresis for top-down proteomics of 30–80 kDa proteins. Proteomics. 2014;14:1158–64. doi: 10.1002/pmic.201300381. [DOI] [PMC free article] [PubMed] [Google Scholar]
- 32.Zhao Y, Riley N, Sun L, Hebert A, Yan X, et al. Coupling capillary zone electrophoresis with electron transfer dissociation and activated ion electron transfer dissociation for top-down proteomics. Anal Chem. 2015;87:5422–29. doi: 10.1021/acs.analchem.5b00883. [DOI] [PMC free article] [PubMed] [Google Scholar]
- 33.Tran J, Doucette A. Gel-eluted liquid fraction entrapment electrophoresis: an electrophoretic method for broad molecular weight range proteome separation. Anal Chem. 2008;80:1568–73. doi: 10.1021/ac702197w. [DOI] [PubMed] [Google Scholar]
- 34.Tran J, Doucette A. Multiplexed size separation of intact proteins in solution phase for mass spectrometry. Anal Chem. 2009;81:6201–9. doi: 10.1021/ac900729r. [DOI] [PubMed] [Google Scholar]
- 35.Catherman A, Durbin K, Ahlf D, Early B, Fellers R, et al. Large-scale top-down proteomics of the human proteome: membrane proteins, mitochondria, and senescence. Mol Cell Proteom. 2013;12:3465–73. doi: 10.1074/mcp.M113.030114. [DOI] [PMC free article] [PubMed] [Google Scholar]
- 36.Tran JC, Zamdborg L, Ahlf D, Lee J, Catherman A, et al. Mapping intact protein isoforms in discovery mode using top-down proteomics. Nature. 2011;480:254–58. doi: 10.1038/nature10575. [DOI] [PMC free article] [PubMed] [Google Scholar]
- 37.Ahlf D, Compton P, Tran J, Early B, Thomas P, Kelleher N. Evaluation of the compact high-field Orbitrap for top-down proteomics of human cells. J Proteome Res. 2012;11:4308–14. doi: 10.1021/pr3004216. [DOI] [PMC free article] [PubMed] [Google Scholar]
- 38.Catherman A, Li M, Tran J, Durbin K, Compton P, et al. Top down proteomics of human membrane proteins from enriched mitochondrial fractions. Anal Chem. 2013;85:1880–88. doi: 10.1021/ac3031527. [DOI] [PMC free article] [PubMed] [Google Scholar]
- 39.Ntai I, Kim K, Fellers R, Skinner O, Smith AD, IV, et al. Applying label-free quantitation to top down proteomics. Anal Chem. 2014;86:4961–68. doi: 10.1021/ac500395k. [DOI] [PMC free article] [PubMed] [Google Scholar]
- 40.Kim K, Compton P, Tran J, Keleher N. Online matrix removal platform for coupling gel-based separations to whole protein electrospray ionization mass spectrometry. J Proteome Res. 2015;14:2199–206. doi: 10.1021/pr501331q. [DOI] [PMC free article] [PubMed] [Google Scholar]
- 41.Zinnel NF, Pai P-J, Russell DH. Ion mobility-mass spectrometry (IM-MS) for top-down proteomics: Increased dynamic range affords increased sequence coverage. Anal Chem. 2012;84:3390–97. doi: 10.1021/ac300193s. [DOI] [PubMed] [Google Scholar]
- 42.Xiu L, Valeja S, Alpert A, Jin S, Ge Y. Effective protein separation by coupling hydrophobic interaction and reverse phase chromatography for top-down proteomics. Anal Chem. 2014;86:7899–906. doi: 10.1021/ac501836k. [DOI] [PMC free article] [PubMed] [Google Scholar]
- 43.Valeja S, Xiu L, Gregorich Z, Guner H, Jin S, Ge Y. Three dimensional liquid chromatography coupling ion exchange chromatography/hydrophobic interaction chromatography/reverse phase chromatography for effective protein separation in top-down proteomics. Anal Chem. 2015;87:5363–71. doi: 10.1021/acs.analchem.5b00657. [DOI] [PMC free article] [PubMed] [Google Scholar]
- 44.Denisov E, Damoc E, Lange O, Makarov A. Orbitrap mass spectrometry with resolving powers above 1,000,000. Int J Mass Spectrom. 2012;325–27:80–85. [Google Scholar]
- 45.Patrie S, Charlebois J, Whipple D, Kelleher N, Hendrickson C, et al. Construction of a hybrid quadrupole/Fourier transform ion cyclotron resonance mass spectrometer for versatile MS/MS above 10 kDa. J Am Soc Mass Spectrom. 2004;15:1099–108. doi: 10.1016/j.jasms.2004.04.031. [DOI] [PubMed] [Google Scholar]
- 46.Tolmachev A, Robinson E, Wu S, Pasa-Tolic L, Smith R. FT-ICR MS optimization for the analysis of intact proteins. Int J Mass Spectrom. 2009;281:32–38. doi: 10.1016/j.ijms.2008.10.010. [DOI] [PMC free article] [PubMed] [Google Scholar]
- 47.Hu Q, Noll R, Li H, Makarov A, Hardman M, Cooks R. The Orbitrap: a new mass spectrometer. J Mass Spectrom. 2005;40:430–43. doi: 10.1002/jms.856. [DOI] [PubMed] [Google Scholar]
- 48.Makarov A, Denisov E, Kholomeev A, Balschun W, Lange O, et al. Performance evaluation of a hybrid linear ion trap/Orbitrap mass spectrometer. Anal Chem. 2006;78:2113–20. doi: 10.1021/ac0518811. [DOI] [PubMed] [Google Scholar]
- 49.Michalski A, Damoc E, Hauschild J, Lange O, Wieghaus A, et al. Mass spectrometry-based proteomics using Q Exactive, a high-performance benchtop quadrupole Orbitrap mass spectrometer. Mol Cell Proteom. 2011;10:M111. doi: 10.1074/mcp.M111.011015. 011015. [DOI] [PMC free article] [PubMed] [Google Scholar]
- 50.Macek B, Waanders L, Olsen J, Mann M. Top-down protein sequencing and MS3 on a hybrid linear quadrupole ion trap-Orbitrap mass spectrometer. Mol Cell Proteom. 2006;5:949–58. doi: 10.1074/mcp.T500042-MCP200. [DOI] [PubMed] [Google Scholar]
- 51.Boyne M, II, Pesavento J, Mizzen C, Kelleher N. Precise characterization of human histones in the H2A gene family by top down mass spectrometry. J Proteome Res. 2006;5:248–53. doi: 10.1021/pr050269n. [DOI] [PubMed] [Google Scholar]
- 52.Thomas C, Kelleher N, Mizzen C. Mass spectrometric characterization of human histone H3: a bird’s eye view. J Proteome Res. 2006;5:240–47. doi: 10.1021/pr050266a. [DOI] [PubMed] [Google Scholar]
- 53.Siuti N, Roth MJ, Mizzen CA, Kelleher NL, Pesavento JJ. Gene-specific characterization of human histone H2B by electron capture dissociation. J Proteome Res. 2006;5:233–39. doi: 10.1021/pr050268v. [DOI] [PubMed] [Google Scholar]
- 54.Wynne C, Fenselau C, Demirev P, Edewards N. Top-down identification of protein biomarkers in bacteria with unsequenced genomes. Anal Chem. 2009;81:9633–42. doi: 10.1021/ac9016677. [DOI] [PubMed] [Google Scholar]
- 55.Wynne C, Edwards N, Fenselau C. Phyloproteomic classification of unsequenced organisms by top-down identification of bacterial proteins using capLC-MS/MS on an Orbitrap. Proteomics. 2010;10:3631–43. doi: 10.1002/pmic.201000172. [DOI] [PubMed] [Google Scholar]
- 56.Fornelli L, Parra J, Hartmer R, Stoermer C, Lubeck M, Tsybin Y. Top-down analysis of 30–80 kDa proteins by electron transfer dissociation time-of-flight mass spectrometry. Anal Bioanal Chem. 2013;405:8505–14. doi: 10.1007/s00216-013-7267-5. [DOI] [PubMed] [Google Scholar]
- 57.Chamot-Rooke J, Mikaty G, Malosse C, Soyer M, Dumont A, et al. Posttranslational modification of pili upon cell contact triggers N. meningitidis dissemination. Science. 2011;331:778–82. doi: 10.1126/science.1200729. [DOI] [PubMed] [Google Scholar]
- 58.Zhurov K, Fornelli L, Wodrich M, Laskay U, Tsybin Y. Principles of electron capture and transfer dissociation mass spectrometry applied to peptide and protein structure analysis. Chem Soc Rev. 2012;42:5014–30. doi: 10.1039/c3cs35477f. [DOI] [PubMed] [Google Scholar]
- 59.McAlister G, Phanstiel D, Good D, Berggren W, Coon J. Implementation of electron-transfer dissociation on a hybrid linear ion trap–Orbitrap mass spectrometer. Anal Chem. 2007;79:3525–34. doi: 10.1021/ac070020k. [DOI] [PMC free article] [PubMed] [Google Scholar]
- 60.Fornelli L, Damoc E, Thomas P, Kelleher N, Aizikov K, et al. Analysis of intact monoclonal antibody IgG1 by electron transfer dissociation Orbitrap FTMS. Mol Cell Proteom. 2012;11:1758–67. doi: 10.1074/mcp.M112.019620. [DOI] [PMC free article] [PubMed] [Google Scholar]
- 61.Mao Y, Valeja S, Rouse J, Hendrickson C, Marshall A. Top-down structural analysis of an intact monoclonal antibody by electron capture dissociation–Fourier transform ion cyclotron resonance–mass spectrometry. Anal Chem. 2013;85:4239–46. doi: 10.1021/ac303525n. [DOI] [PubMed] [Google Scholar]
- 62.Ge Y, Rybakova I, Xu Q, Moss R. Top-down high-resolution mass spectrometry of cardiac myosin binding protein C revealed that truncation alters protein phosphorylation state. PNAS. 2009;106:12658–63. doi: 10.1073/pnas.0813369106. [DOI] [PMC free article] [PubMed] [Google Scholar]
- 63.Riley N, Westphall M, Coon J. Activated ion electron transfer dissociation for improved fragmentation of intact proteins. Anal Chem. 2015;87:7109–16. doi: 10.1021/acs.analchem.5b00881. [DOI] [PMC free article] [PubMed] [Google Scholar]
- 64.Cannon J, Cammarata M, Robotham S, Cotham V, Shaw J, et al. Ultraviolet photodissociation for characterization of whole proteins on a chromatographic time scale. Anal Chem. 2014;86:2185–92. doi: 10.1021/ac403859a. [DOI] [PMC free article] [PubMed] [Google Scholar]
- 65.Warnke S, von Helden G, Pagel K. Analyzing the higher order structure of proteins with conformer-selective ultraviolet photodissociation. Proteomics. 2015;15:2804–12. doi: 10.1002/pmic.201400480. [DOI] [PubMed] [Google Scholar]
- 66.Dang X, Young N. Ultraviolet photodissociation enhances top-down mass spectrometry as demonstrated on green fluorescent protein variants. Proteomics. 2014;14:1128–29. doi: 10.1002/pmic.201400114. [DOI] [PubMed] [Google Scholar]
- 67.Shaw J, Li W, Holden D, Zhang Y, Griep-Raming J, et al. Complete protein characterization using top-down mass spectrometry and ultraviolet photodissociation. J Am Chem Soc. 2013;135:12646–51. doi: 10.1021/ja4029654. [DOI] [PMC free article] [PubMed] [Google Scholar]
- 68.Senko M, Remes P, Canterbury J, Mathur R, Song Q, et al. Novel parallelized quadrupole/linear ion trap/Orbitrap tribrid mass spectrometer improving proteome coverage and peptide identification rates. Anal Chem. 2013;85:11710–14. doi: 10.1021/ac403115c. [DOI] [PubMed] [Google Scholar]
- 69.Brunner A, Lossl P, Liu F, Huguet R, Mullen C, et al. Benchmarking multiple fragmentation methods on an Orbitrap fusion for top-down phospho-proteoform characterization. Anal Chem. 2015;87:4152–58. doi: 10.1021/acs.analchem.5b00162. [DOI] [PubMed] [Google Scholar]
- 70.Zheng Y, Fornelli L, Compton P, Sharma S, Canterbury J, et al. Unabridged analysis of human histone H3 by differential top-down mass spectrometry reveals hypermethylated proteoforms from MMSET/NSD2 overexpression. Mol Cell Proteom. 2016;15:776–90. doi: 10.1074/mcp.M115.053819. [DOI] [PMC free article] [PubMed] [Google Scholar]
- 71.Levy M, Gucinski A, Boyne M., II Primary sequence confirmation of a protein therapeutic using top down MS/MS and MS3. Anal Chem. 2015;87:6995–99. doi: 10.1021/acs.analchem.5b01113. [DOI] [PubMed] [Google Scholar]
- 72.Coelho Graça D, Hartmer R, Jabs W, Beris P, Clerici L, et al. Identification of hemoglobin variants by top-down mass spectrometry using selected diagnostic product ions. Anal Bioanal Chem. 2015;407:2837–45. doi: 10.1007/s00216-015-8525-5. [DOI] [PubMed] [Google Scholar]
- 73.Acosta-Martin AE, Coelho Graça D, Antinori P, Clerici L, Hartmer R, et al. Quantitative mass spectrometry analysis of intact hemoglobin a2 by precursor ion isolation and detection. Anal Chem. 2013;85:7971–75. doi: 10.1021/ac401782t. [DOI] [PubMed] [Google Scholar]
- 74.Shevchenko A, Wilm M, Vorm O, Mann M. Mass spectrometric sequencing of proteins from silver-stained polyacrylamide gels. Anal Chem. 1996;68:850–58. doi: 10.1021/ac950914h. [DOI] [PubMed] [Google Scholar]
- 75.Washburn MP, Wolters D, Yates JR., 3rd Large-scale analysis of the yeast proteome by multidimensional protein identification technology. Nat Biotechnol. 2001;19:242–47. doi: 10.1038/85686. [DOI] [PubMed] [Google Scholar]
- 76.Wisniewski JR, Zougman A, Nagaraj N, Mann M. Universal sample preparation method for proteome analysis. Nat Methods. 2009;6:359–62. doi: 10.1038/nmeth.1322. [DOI] [PubMed] [Google Scholar]
- 77.Bunger M, Cargile B, Ngunjiri A, Bundy J, Stephenson JL., Jr Automated proteomics of E. coli via top-down electron-transfer dissociation mass spectrometry. Anal Chem. 2008;80:1459–67. doi: 10.1021/ac7018409. [DOI] [PubMed] [Google Scholar]
- 78.Ferguson J, Wenger C, Metcalf W, Kelleher N. Top-down proteomics reveals novel protein forms expressed in Methanosarcina acetivorans. J Am Soc Mass Spectrom. 2009;20:1743–50. doi: 10.1016/j.jasms.2009.05.014. [DOI] [PMC free article] [PubMed] [Google Scholar]
- 79.Meng F, Du Y, Miller L, Patrie S, Robinson D, Kelleher N. Molecular-level description of proteins from Saccharomyces cerevisiae using quadrupole FT hybrid mass spectrometry for top down proteomics. Anal Chem. 2004;76:2852–58. doi: 10.1021/ac0354903. [DOI] [PubMed] [Google Scholar]
- 80.Kellie JF, Catherman AD, Durbin KR, Tran JC, Tipton JD, et al. Robust analysis of the yeast proteome under 50 kDa by molecular-mass-based fractionation and top-down mass spectrometry. Anal Chem. 2011;84:209–15. doi: 10.1021/ac202384v. [DOI] [PMC free article] [PubMed] [Google Scholar]
- 81.Roth M, Parks B, Ferguson J, Boyne M, II, Kelleher N. “Proteotyping”: population proteomics of human leukocytes using top down mass spectrometry. Anal Chem. 2008;80:2857–66. doi: 10.1021/ac800141g. [DOI] [PMC free article] [PubMed] [Google Scholar]
- 82.Pesavento J, Mizzen C, Kelleher N. Quantitative analysis of modified proteins and their positional isomers by tandem mass spectrometry: human histone H4. Anal Chem. 2006;78:4271–80. doi: 10.1021/ac0600050. [DOI] [PubMed] [Google Scholar]
- 83.Zabrouskov V, Ge Y, Schwartz J, Walker J. Unraveling molecular complexity of phosphorylated human cardiac troponin I by top down electron capture dissociation/electron transfer dissociation mass spectrometry. Mol Cell Proteom. 2008;7:1838–49. doi: 10.1074/mcp.M700524-MCP200. [DOI] [PubMed] [Google Scholar]
- 84.Ayaz-Guner S, Zhang J, Li L, Walker J, Ge Y. In vivo phosphorylation site mapping in mouse cardiac troponin I by high-resolution top-down electron capture dissociation mass spectrometry: Ser22/23 are the only sites basally phosphorylated. Biochemstry. 2009;48:8161–70. doi: 10.1021/bi900739f. [DOI] [PMC free article] [PubMed] [Google Scholar]
- 85.Dong X, Sumandea C, Chen Y, Garcia-Cazarin M, Zhang J, et al. Augmented phosphorylation of cardiac troponin I in hypertensive heart failure. J Biol Chem. 2012;287:848–57. doi: 10.1074/jbc.M111.293258. [DOI] [PMC free article] [PubMed] [Google Scholar]
- 86.Zhang J, Dong X, Hacker T, Ge Y. Deciphering modifications in swine cardiac troponin I by top-down high-resolution tandem mass spectrometry. J Am Soc Mass Spectrom. 2010;21:940–48. doi: 10.1016/j.jasms.2010.02.005. [DOI] [PMC free article] [PubMed] [Google Scholar]
- 87.Xu F, Xu Q, Dong X, Guy M, Guner H, et al. Top-down high-resolution electron capture dissociation mass spectrometry for comprehensive characterization of post-translational modifications in Rhesus monkey cardiac troponin I. Int J Mass Spectrom. 2011;305:95–102. [Google Scholar]
- 88.Du Y, Parks B, Sohn S, Kwast K, Kelleher N. Top-down approaches for measuring expression ratios of intact yeast proteins using Fourier transform mass spectrometry. Anal Chem. 2006;78:686–94. doi: 10.1021/ac050993p. [DOI] [PubMed] [Google Scholar]
- 89.Parks B, Jiang L, Thomas P, Wenger C, Roth M, et al. Top-down proteomics on a chromatographic time scale using linear ion trap Fourier transform hybrid mass spectrometers. Anal Chem. 2007;79:7984–91. doi: 10.1021/ac070553t. [DOI] [PMC free article] [PubMed] [Google Scholar]
- 90.Collier T, Hawkridge A, Georgianna D, Payne G, Muddiman D. Top-down identification and quantification of stable isotope labeled proteins from Aspergillus flavus using online nano-flow reversed-phase liquid chromatography coupled to a LTQ-FTICR mass spectrometer. Anal Chem. 2008;80:4994–5001. doi: 10.1021/ac800254z. [DOI] [PMC free article] [PubMed] [Google Scholar]
- 91.Ong SE, Blagoev B, Kratchmarova I, Kristensen DB, Steen H, et al. Stable isotope labeling by amino acids in cell culture, SILAC, as a simple and accurate approach to expression proteomics. Mol Cell Proteom. 2002;1:376–86. doi: 10.1074/mcp.m200025-mcp200. [DOI] [PubMed] [Google Scholar]
- 92.Collier T, Sarkar P, Rao B, Muddiman D. Quantitative top-down proteomics of SILAC labeled human embryonic stem cells. J Am Soc Mass Spectrom. 2010;21:879–89. doi: 10.1016/j.jasms.2010.01.031. [DOI] [PubMed] [Google Scholar]
- 93.Thompson A, Schafer J, Kuhn K, Kiele S, Schwarz J, et al. Tandem mass tags: a novel quantification strategy for comparative analysis of complex protein mixtures by MS/MS. Anal Chem. 2003;75:1895–904. doi: 10.1021/ac0262560. [DOI] [PubMed] [Google Scholar]
- 94.Hung C, Tholey A. Tandem mass tag protein labeling for top-down identification and quantification. Anal Chem. 2012;84:161–70. doi: 10.1021/ac202243r. [DOI] [PubMed] [Google Scholar]
- 95.Wiener M, Sachs J, Deyanova E, Yates N. Differential mass spectrometry: a label-free LC–MS method for finding significant differences in complex peptide and protein mixtures. Anal Chem. 2004;76:6085–96. doi: 10.1021/ac0493875. [DOI] [PubMed] [Google Scholar]
- 96.Mazur M, Cardasis H, Spellman D, Liaw A, Yates N, Hendrickson R. Quantitative analysis of intact apolipoproteins in human HDL by top-down differential mass spectrometry. PNAS. 2010;107:7728–33. doi: 10.1073/pnas.0910776107. [DOI] [PMC free article] [PubMed] [Google Scholar]
- 97.Gomez SM, Nishio JN, Faull KF, Whitelegge JP. The chloroplast grana proteome defined by intact mass measurements from liquid chromatography mass spectrometry. Mol Cell Proteom. 2002;1:46–59. doi: 10.1074/mcp.m100007-mcp200. [DOI] [PubMed] [Google Scholar]
- 98.Ryan C, Souda P, Halgand F, Wong D, Loo J, et al. Confident assignment of intact mass tags to human salivary cystatins using top-down Fourier-transform ion cyclotron resonance mass spectrometry. J Am Soc Mass Spectrom. 2010;21:908–17. doi: 10.1016/j.jasms.2010.01.025. [DOI] [PMC free article] [PubMed] [Google Scholar]
- 99.Cabras T, Pisano E, Boi R, Olianas A, Manconi B, et al. Age-dependent modifications of the human salivary secretory protein complex. J Proteome Res. 2009;8:4126–34. doi: 10.1021/pr900212u. [DOI] [PubMed] [Google Scholar]
- 100.Castagnola M, Messana I, Inzitari R, Fanali C, Cabras T, et al. Hypo-phosphorylation of salivary peptidome as a clue to the molecular pathogenesis of autism spectrum disorders. J Proteome Res. 2008;7:5327–32. doi: 10.1021/pr8004088. [DOI] [PubMed] [Google Scholar]
- 101.Wu S, Brown J, Tolic N, Meng D, Liu X, et al. Quantitative analysis of human salivary gland-derived intact proteome using top-down mass spectrometry. Proteomics. 2014;14:1211–22. doi: 10.1002/pmic.201300378. [DOI] [PubMed] [Google Scholar]
- 102.Edwards RL, Griffiths P, Bunch J, Cooper HJ. Top-down proteomics and direct surface sampling of neonatal dried blood spots: diagnosis of unknown hemoglobin variants. J Am Soc Mass Spectrom. 2012;23:1921–30. doi: 10.1007/s13361-012-0477-9. [DOI] [PubMed] [Google Scholar]
- 103.Edwards RL, Griffiths P, Bunch J, Cooper HJ. Compound heterozygotes and beta-thalassemia: top-down mass spectrometry for detection of hemoglobinopathies. Proteomics. 2014;14:1232–38. doi: 10.1002/pmic.201300316. [DOI] [PubMed] [Google Scholar]
- 104.Mao P, Wang D. Top-down proteomics of a drop of blood for diabetes monitoring. J Proteome Res. 2014;13:1560–69. doi: 10.1021/pr401074t. [DOI] [PMC free article] [PubMed] [Google Scholar]
- 105.Demirev PA, Feldman AB, Kowalski P, Lin JS. Top-down proteomics for rapid identification of intact microorganisms. Anal Chem. 2005;77:7455–61. doi: 10.1021/ac051419g. [DOI] [PubMed] [Google Scholar]
- 106.Hummel M, Wigger T, Brockmeyer J. Characterization of mustard 2S albumin allergens by bottom-up, middle-down, and top-down proteomics: a consensus set of isoforms of Sin a 1. J Proteome Res. 2015;14:1547–56. doi: 10.1021/pr5012262. [DOI] [PubMed] [Google Scholar]
- 107.Lagrain B, Brunnbauer M, Rombouts I, Koehler P. Identification of intact high molecular weight glutenin subunits from the wheat proteome using combined liquid chromatography-electrospray ionization mass spectrometry. PLOS ONE. 2013;8:e58682. doi: 10.1371/journal.pone.0058682. [DOI] [PMC free article] [PubMed] [Google Scholar]
- 108.Petris LD, Orre L, Kanter L, Pernemalm M, Koyi H, et al. Tumor expression of S100A6 correlates with survival of patients with stage I non-small-cell lung cancer. Lung Cancer. 2009;63:410–17. doi: 10.1016/j.lungcan.2008.06.003. [DOI] [PubMed] [Google Scholar]
- 109.Zhang J, Guy MJ, Norman HS, Chen Y-C, Xu Q, et al. Top-down quantitative proteomics identified phosphorylation of cardiac troponin I as a candidate biomarker for chronic heart failure. J Proteome Res. 2011;10:4054–65. doi: 10.1021/pr200258m. [DOI] [PMC free article] [PubMed] [Google Scholar]
- 110.Desiderio C, D’Angelo L, Rossetti D, Iavarone F, Giardina B, et al. Cerebrospinal fluid top-down proteomics evidenced the potential biomarker role of LVV- and VV-hemorphin-7 in posterior cranial fossa pediatric brain tumors. Proteomics. 2012;12:2158–66. doi: 10.1002/pmic.201100499. [DOI] [PubMed] [Google Scholar]
- 111.Cabras T, Pisano E, Montaldo C, Giuca M, Iavarone F, et al. Significant modifications of the salivary proteome potentially associated with complications of Down syndrome revealed by top-down proteomics. Mol Cell Proteom. 2013;12:1844–52. doi: 10.1074/mcp.M112.026708. [DOI] [PMC free article] [PubMed] [Google Scholar]
- 112.Laouirem S, Faouder JL, Alexandrov T, Mestivier D, Leger T, et al. Progression from cirrhosis to cancer is associated with early ubiquitin post-translational modifications: identification of new biomarkers of cirrhosis at risk of malignancy. J Pathol. 2014;234:452–63. doi: 10.1002/path.4398. [DOI] [PubMed] [Google Scholar]
- 113.Iavarone F, Melis M, Platania G, Cabras T, Manconi B, et al. Characterization of salivary proteins of schizophrenic and bipolar disorder patients by top-down proteomics. J Proteom. 2014;103:15–22. doi: 10.1016/j.jprot.2014.03.020. [DOI] [PubMed] [Google Scholar]
- 114.Ye H, Mandal R, Catherman A, Thomas P, Kelleher N, et al. Top-down proteomics with mass spectrometry imaging: a pilot study towards discovery of biomarkers for neurodevelopmental disorders. PLOS ONE. 2014;9:e92831. doi: 10.1371/journal.pone.0092831. [DOI] [PMC free article] [PubMed] [Google Scholar]
- 115.Kellie JF, Higgs RE, Ryder JW, Major A, Beach TG, et al. Quantitative measurement of intact α-synuclein proteoforms from post-mortem control and Parkinson’s disease brain tissue by intact protein mass spectrometry. Sci Rep. 2014;4:5797. doi: 10.1038/srep05797. [DOI] [PMC free article] [PubMed] [Google Scholar]
- 116.Martelli C, Iavarone F, D’Angelo L, Arba M, Vincenzoni F, et al. Integrated proteomic platforms for the comparative characterization of medulloblastoma and pilocytic astrocytoma pediatric brain tumors: a preliminary study. Mol BioSyst. 2015;11:1668–83. doi: 10.1039/c5mb00076a. [DOI] [PubMed] [Google Scholar]
- 117.Savaryn JP, Catherman AD, Thomas PM, Abecassis MM, Kelleher NL. The emergence of top-down proteomics in clinical research. Genome Med. 2013;5:53. doi: 10.1186/gm457. [DOI] [PMC free article] [PubMed] [Google Scholar]