

Abstract
Studies using arterial spin labeling (ASL) have shown that individuals with chronic fatigue syndrome (CFS) have decreased regional cerebral blood-flow, which may be associated with changes in functional neural networks. Indeed, recent studies indicate disruptions in functional connectivity (FC) at rest in chronically fatigued patients including perturbations in static FC (sFC) i.e., average FC at rest between several brain regions subserving neurocognitive, motor, and affect-related networks. Whereas sFC often provides information of functional network reorganization in chronic illnesses, investigations of temporal changes in functional connectivity between multiple brain areas may shed light on the dynamic characteristics of brain network activation associated with such maladies. We used ASL fMRI in 19 CFS patients and 15 healthy controls (HC) to examine both static and dynamic changes in FC among several a priori selected brain regions during a fatiguing cognitive task. HC showed greater increases than CFS in static FC (sFC) between insula and temporo- occipital structures and between precuneus and thalamus/striatum. Furthermore, inferior frontal gyrus connectivity to cerebellum, occipital, and temporal structures declined in HC but increased in CFS. Patients also showed lower dynamic FC (dFC) between hippocampus and right superior parietal lobule. Both sFC and dFC correlated with task related fatigue increases. These data provide the first evidence that perturbations in static and dynamic FC may underlie chronically fatigued patients’ report of task-induced fatigue. Further research will determine whether such changes in sFC and dFC are also characteristic for other fatigued individuals, including patients with chronic pain, cancer, and multiple sclerosis.
Keywords: arterial spin labeling, chronic fatigue, dynamic functional connectivity, MRI
1. Introduction
Studies examining functional connectivity (FC), or correlated basal activity among brain regions, have highlighted large-scale interactions among brain regions during task performance and wakeful rest (Hermundstad et al, 2013). The literature largely focuses on average FC over the course of a task (dynamic FC) or resting-state scan (static FC). However, there is increased interest in characterizing the temporal properties of this coherence among brain regions (dynamic FC). Observed changes in dFC potentially reflect variations in cognitive state (Chang et al, 2010), more accurately representing the dynamic nature of the brain (Tagliazucchi et al, 2015).
Fatigue, or the feeling of tiredness and lack of energy, is a common clinical symptom associated with many medical and psychological conditions (Cook et al, 2007). In particular, severe and persistent fatigue that does not improve following rest is the hallmark feature of chronic fatigue syndrome (CFS); (Fukuda et al, 1994). CFS patients tend to experience fatigue related to both physical and mental functioning (De Lange et al, 2004).
Studies examining mental fatigue have found that, despite showing similar accuracy to healthy controls (HC) during challenging cognitive tasks, CFS patients show more extensive activation of task-related brain regions (Cook et al, 2007; Lange et al, 2005). Mental fatigue in CFS has been associated with decreased activation in basal ganglia structures, potentially representing disrupted function in cortico-basal circuitry (Boissoneault et al, 2016; Miller et al, 2014). As a result, central nervous system (CNS) dysfunction is thought to be a principal component of CFS symptoms (Holgate et al, 2011).
To better understand CNS functioning in patients with CFS, regional cerebral blood flow (rCBF) has been measured using arterial spin labeling fMRI (ASL). Studies have shown that individuals with CFS have lower global rCBF (Biswal et al, 2011; Costa et al, 1995; Yoshiuchi et al, 2006), which may be indicative of reduced metabolic function of cerebral tissue (Petcharunpaisan et al, 2010) and changes in functional neural networks (Bullmore et al, 2012).
ASL has several advantages over blood oxygenation level dependent (BOLD) fMRI when used for resting state FC analysis, including better correspondence to underlying patterns of neuronal activity and lack of increasing noise at low frequencies (Biswal et al, 2011; Fernandez-Seara et al, 2015). Building on previous studies using BOLd fMRI (Gay et al., 2016), we have demonstrated differences in sFC between CFS and healthy controls during a resting-state ASL fMRI (Boissoneault et al, 2016). Seed brain regions associated with CFS symptomatology, such as memory (parahippocampal gyrus), motor skills (pallidum), emotional processing (anterior cingulate cortex [ACC]), and higher-order neurocognitive functions (ACC, angular gyrus, and superior frontal gyrus), were used to assess intrinsic resting-state FC. CFS patients showed greater sFC of superior frontal gyrus, ACC, precuneus, and angular gyrus to regions such as precuneus, right postcentral gyrus, supplementary motor area, posterior cingulate gyrus, and thalamus than healthy controls (Boissoneault et al, 2016). We also observed decreased sFC in ACC, parahippocampal gyrus, and pallidum to regions including right insula, right precentral gyrus, and hippocampus. Remarkably, sFC of the parahippocampal gyrus and ACC correlated with fatigue in CFS patients.
While sFC provided useful information about potential functional network reorganization underlying CFS, measuring the temporal dynamics of these networks could help improving the understanding of cerebral fatigue mechanisms. This ASL study examined dFC among brain regions associated with cognitive and emotional functioning in CFS during a fatiguing cognitive task, in addition to sFC. We also measured whether dFC was associated with fatigue ratings.
2. Methods
2.1 Participants
CFS participants met Centers for Disease Control criteria for chronic fatigue syndrome (Fukuda et al, 1994) and were excluded from study if they reported a history of any other condition (including psychiatric illness) confounding CFS diagnosis. HC participants were excluded if they reported a history of chronic fatigue, chronic pain, or mental illness. Individuals with contraindications for MRI (e.g., ferromagnetic implants, pregnancy, and claustrophobia) were also excluded from both the CFS and HC groups. Qualifying individuals were asked to get a full night’s sleep (≥ 6 hours), refrain from drinking caffeinated beverages on the day of the imaging session, not consume alcohol or other psychoactive substances in the 24 hours prior to the study day, and not use any medications except anti-hypertensives and/or vitamins.
Written informed consent was collected before the study procedures or collection of any data. The University of Florida Institutional Review Board approved all procedures and the study protocol conformed to the ethical guidelines of the 1975 Declaration of Helsinki.
2.2 Clinical and Affective Measures
During screening, participants completed the Pennebaker Inventory of Limbic Languidness, a questionnaire designed to measure individual somatic focus (Pennebaker, 1983) and reported perceived role and physical function ranging from “no function” to “no impairment in function” using mechanical visual analog scales (VAS; 0–100). Immediately prior to scanning, all participants also rated their overall pain, depression, anxiety, and fatigue. These VAS ranged from “no pain/depression/anxiety/fatigue at all” to “most intense pain/depression/anxiety/fatigue imaginable” (Price et al, 1994).
2.3 Fatigue Induction Protocol
The Paced auditory serial addition test (PASAT; (Gronwall, 1977)) is a well-validated cognitive task of auditory information processing speed and flexibility, as well as calculation ability (Tagliazucchi et al, 2015). It has good psychometric properties including high levels of internal consistency and test-retest reliability (Tombaugh, 2006). Critically, the PASAT has been successfully used as a cognitive challenge in functional neuroimaging studies of fatigue (Cook et al, 2007). In order to ensure standardization of presentation, auditory stimuli consisting of single- or double-digit numbers were computer-generated and presented in pseudo-random order at two different interstimulus intervals (ISI). During the first 3 minutes of the PASAT, stimuli were presented with an ISI of 3 seconds. During the subsequent 9 minutes, the ISI was decreased to 2 seconds. Subjects added each number to the preceding one and determined whether they summed to 13 (target value). Across the duration of the PASAT, 35% of number combinations added to 13. Performance feedback (i.e., correct vs. incorrect) was provided after each subject response. Subjects indicated their response (yes or no) using a key pad. They continuously rated their overall fatigue on an electronic VAS from 0 (“no fatigue”) to 100 (“most intense fatigue imaginable”) for the duration of the scan using a scroll wheel placed in their other hand. The scale was visible during the entire scan on a large computer screen and subjects were instructed to adjust their ratings if fatigue changed. The PASAT and VAS were implemented and presented using PsychoPy (Peirce, 2007; Peirce, 2009) running on a Dell Latitude laptop (Dell Inc., Round Rock, TX, USA).
2.4 Image Acquisition
Neuroimaging data were collected using a whole body Philips Achieva 3T scanner and a 32-channel head coil (Koninklijke Philips N.V., Amsterdam, Netherlands. Participants were put in a supine position head-first. Scanning sessions included a T1-weighted structural MRI scan and two scans utilizing pseudo-continuous ASL protocols (Dai et al, 2008; Wu et al, 2007): one resting state scan (see results reported in (Boissoneault et al, 2016), and one 12 minute PASAT scan and a 6-minute recovery period.
Whole brain structural images were acquired using a three-dimensional (3D) T1-weighted magnetization-prepared rapid gradient-echo (MP-RAGE) sequence with a field-of-view (FOV) of 240 mm, in-plane resolution of 1mm × 1mm, 176 contiguous sagittal slices of 1mm thickness, and TR/TE/flip angle = 7.2ms/3.2ms/8°. ASL data were acquired using a two-dimensional (2D) pseudo-continuous ASL (pCASL) technique with a field-of-view (FOV) of 230 mm, in-plane resolution of 3.2mm × 3.2mm, 20 axial slices of 6mm thickness, 1mm interslice gap, and TR/TE/flip angle= 4s/11ms/90°. Arterial spin labeling was applied at a plane which was 30.5 mm inferior to the lowest imaging slice with a labeling time of 1500ms, and a post labeling delay time of 1800 ms. Structural MRIs required 4 minutes and 34 seconds. The task-based scan required 18 minutes, producing 135 pairs of control and tagged images. Analyses in the current report used only those scan pairs collected during PASAT performance, resulting in 90 pairs of control and tagged images spanning 12 minutes.
2.5 Preprocessing Protocol
Imaging data processing and analyses were performed using MATLAB 2015a (MathWorks, Natick, MA, USA), SPM12 (Wellcome Department of Cognitive Neurology, UK), and ASLtbx (Wang et al, 2008). pCASL scans were corrected for subject motion using a rigid body 6-parameter algorithm included in SPM12. To minimize contamination from potential spurious motion artifacts due to arterial spin labeling, tagged and control images were motion corrected independently (Wang et al, 2008; Wang, 2012). Functional images corresponding to PASAT performance were then coregistered to the T1-weighted images and spatially smoothed with a Gaussian filter of 6 mm full-width-half-maximum (FWHM) kernel to decrease noise for subsequent image subtraction. Tagged and control pairs were subtracted to create 90 perfusion-weighted images for each slice. The perfusion-weighted time series of each slice was then averaged to create one mean image of cerebral perfusion. The mean perfusion weighted image was used to create a map of CBF using ASLtbx, quantified as ml/100g/min (Wang et al, 2008). Parameters used for the calculation of CBF estimates in this study have been previously published (Boissoneault et al, 2016). Four-dimensional CBF images were masked to remove out-of-brain voxels and normalized to the SPM12 MNI template.
2.6 Functional Connectivity Analyses
Preprocessing (i.e., motion correction, co-registration, subtracting, CBF estimation, smoothing, normalization, and masking) was completed before data were input to CONN. ASL data were not convolved with the hemodynamic response function (HRF). After data was preprocessed the Conn toolbox was used, including noise reduction and low-pass filtering (Whitfield-Gabrieli et al, 2012), for both sFC and dFC analyses. Prior to FC analyses, signal from white matter and the ventricles were removed from the data using linear regression using the CompCor algorithm (see (Behzadi et al, 2007) for a description of this technique), reducing spurious spatial correlations due to physiological noise. This is relevant because the CBF signal in the ventricles and the white matter is affected by the cardiac and the respiratory cycle, respectively (Fernandez-Seara et al, 2015). This approach has been shown to be appropriate for ASL data, and is at least as effective as denoising with physiological data (Behzadi et al, 2007). Finally, CBF time series signals were filtered using a low pass (< .07 Hz) filter.
Two sets of FC analysis were then performed (i.e., sFC and dFC). In both sets, a priori ROIs (i.e., insula, inferior frontal gyrus [IFG], middle frontal gyrus [MFG], superior frontal gyrus [SFG], parahippocampal gyrus [PaHcG], anterior cingulate cortex [ACC], angular gyrus [AG], posterior cingulate cortex [PCC], hippocampus, precuneus, caudate nucleus, pallidum, and postcentral gyrus [PCG]) were used. Because we did not have hemisphere-specific hypotheses, bilateral pairs of ROIs were used as seeds, resulting in 13 total ROIs for static and dynamic FC analyses. Bilateral ROIs were generated from the main effect of the left and right hemisphere time series for each region. ROIs were defined as 10mm spheres based on the Harvard-Oxford cortical and subcortical structural atlases (Desikan et al., 2006; Goldstein et al., 2007). For sFC analysis, a seed-to-voxel approach was used. As implemented in CONN, an ROI-to-ROI approach was used for dFC analysis. Type I error was controlled at both the ROI and family level (i.e., static vs. functional FC) through the use of false discovery rate (FDR) correction (p<.05; Benjamini and Hochberg, 1995).
2.7 Static FC Analysis
To examine changes in sFC from the beginning to the end of the PASAT, we performed seed-to-voxel sFC analyses producing Fisher’s r-to-z transformed correlation maps for each participant and seed ROI. Then, differential change in sFC as a result of PASAT performance was assessed using 2 (group: HC vs. CFS) X 2 (time: first 3 vs. last 3 minutes of PASAT) ANOVA. This approach allowed the determination of regions where changes in static FC from the beginning to the end of the cognitive task differed between CFS subjects and controls. These time frames were chosen in order to maximize differences in fatigue ratings. FC values (mean z-scores) for significant clusters were extracted using the REX toolbox.
2.8 Dynamic FC Analysis
To examine dFC over the course of the PASAT, data were entered into the Conn toolbox’s Dynamic FC analytic pipeline. This analysis uses an extension of the PsychoPhysiological Interaction (PPI) model (for review, see O’Reilly et al., 2012) to calculate changes in the correlation between ROI pairs for specific time points (Nieto-Castanon, 2014). Temporal modulation factors (i.e., observed dynamic changes in functional connectivity) were determined from ROI-ROI connectivity matrices. Time periods were defined using a sliding window of 64 seconds (i.e., 8 dynamic volumes), which parsed the PASAT time series into 11 time periods. Temporal modulation factors were used in standard PPI analyses, yielding ROI-ROI loading matrices (i.e., β-weight of the PPI term) associated with each factor. In this context, greater positive (or negative) β-weights indicate PASAT task engagement over time was associated with greater change in the relationship between seed ROIs and other brain regions. These β-weights are operationalized as dFC for purposes of this report. Second-level analyses were then used to test within-group differences of time across the entire duration of the PASAT. Group-level statistics were performed on ROI-ROI dFC values. Specifically, we completed independent-samples t-tests to examine dFC differences between HC and CFS for all 13 seed ROIs.
2.9 Association Between Neuroimaging and Behavioral Data
SPSS 22 (IBM Corp., Armonk, NY, USA) was used for all statistical analyses with behavioral data. Following descriptive statistics for demographic variables, potential differences in degree of fatigue induction were assessed using 2 (group: HC vs. CFS) X 2 (time: average fatigue ratings over the first vs. last 3 minutes of the PASAT) repeated measures analysis of variance. Characterization of the relationship between individuals’ sFC (i.e., slope of seed-to-cluster z-scores), dFC values, and relevant clinical and psychosocial factors was conducted using Pearson’s r correlation matrices because measures were not significantly skewed or kurtosed.
3. Results
3.1 Demographics and Psychosocial Variables
Demographic and psychosocial characteristics of the 19 CFS and 15 HC participants (100% women) are illustrated in Table 1. Independent t-tests indicated HC and CFS were appropriately age matched (t32 = −0.094, p = .93). CFS were significantly higher than HC for anxiety (t20.04 = −5.30, p < .0001), fatigue (t25.87 = −8.23, p < .0001), pain (t18.17 = −7.79, p < .0001), and depression (t30.29 = −3.82, p = .001.).
Table 1.
Demographic and Psychosocial Characteristics
|
|
||
|---|---|---|
| HC (n=15) Mean (SD) |
CFS (n=19) Mean (SD) |
|
| Age (years) | 47.87 (12.14) | 48.26 (12.22) |
| Fatigue Symptom Duration (years) | - | 12.38 (9.56) |
| Anxiety (0–100 VAS) | 2.67 (6.11) | 38.58 (28.71)a |
| Fatigue (0–100 VAS) | 6.53 (8.91) | 49.32 (20.32)a |
| Pain (0–100 VAS) | 0.47 (1.36) | 40.47 (22.33)a |
| Depression (0–100 VAS) | 4.47 (15.67) | 32.11 (26.11)a |
| PILL Total Score | 80.33 (19.57) | 136.88 (32.68)a |
| Physical Function (0–100 VAS) | 95.40 (6.94) | 52.64 (24.18)b |
| Role Function (0–100 VAS) | 91.67 (26.16) | 8.82 (26.42)b |
CFS > HC (p<.05)
HC > CFS (p<.05)
PILL: Pennebaker Inventory of Limbic Languidness
3.2 In-Scanner Fatigue Ratings
Results of repeated measures ANOVA indicated a significant effect of time on in-scanner fatigue ratings (F1,32=132.40, p < .0001), with mean fatigue ratings rising from 9.1 (SD=12.5) in the first quarter of the PASAT to 50.0 (SD=25.4) in the last quarter. A significant effect of group (F1,32=9.42, p = 0.004) indicated fatigue ratings were higher among CFS patients (MHC=20.5, SD=15.0 vs MCFS=36.6, SD=15.4) than HC. The group X time interaction approached but did not achieve significance (F1,32=3.57, p = 0.07). These results suggest that although CFS patients had higher fatigue scores overall, but the slope of fatigue was not significantly different between groups
3.3 Static Functional Connectivity Analysis
Analyses indicated that of our 13 a priori selected ROIs, 3 demonstrated significant group X time interactions for FC from the beginning to the end of the PASAT (Table 2). These clusters retained their significance following FDR correction for 13 family-wise hypothesis tests. These interactions provide evidence for differing slopes in static FC as a result of task performance between groups. First, connectivity of insula to a cluster including right middle temporal gyrus, right superior lateral occipital cortex, and right angular gyrus tended to increase from the beginning to the end of the PASAT in HC, but decreased slightly in CFS (Figure 1). The same pattern was apparent for FC of precuneus to a cluster including left pallidum, left thalamus, left putamen, left caudate, and left nucleus accumbens (Figure 2). In contrast, FC of the IFG to a large cluster spanning bilateral lingual gyrus, cerebellar vermis, bilateral cerebellum, bilateral parahippocampal gyrus and brainstem tended to decrease in HC but increased slightly in CFS (Figure 3). Greater increases in IFG connectivity were associated with greater changes in fatigue rating as a result of PASAT performance (r = 0.53, p = 0.001; Figure 4). However, precuneus and insula FC were not significantly associated with fatigue ratings (ps > 0.49).
Table 2.
Seed regions differing in connectivity between the first and last three minutes of the PASAT in CFS (seed-to-voxel)
| Seed Region | Cluster Coordinates | Cluster Size | Cluster Regions | Voxels in Region | % Coverage | Cluster p- value (<.05 FDR) | FDR- corrected p-value | HC Connectivity Δ Mean (SD) | CFS Connectivity Δ Mean (SD) |
|---|---|---|---|---|---|---|---|---|---|
| Insula | 44, −58, 12 | 211 | Right Middle Temporal Gyrus | 63 | 5 | .01 | .04 | .25 (.14) | −.07 (.20) |
| Right Superior Lateral Occipital | 48 | 2 | |||||||
| Cortex | 17 | 1 | |||||||
| Right Angular Gyrus | 83 | - | |||||||
| Not assigned or less than 1% coverage | |||||||||
| Precuneus | −12, 04, −02 | 157 | Left Pallidum | 104 | 34 | .007 | .04 | .25 (.18) | −.17 (.23) |
| Left Thalamus | 25 | 2 | |||||||
| Left Putamen | 24 | 3 | |||||||
| Left Caudate | 3 | 1 | |||||||
| Left Accumbens | 1 | 1 | |||||||
| Not assigned or less than 1% coverage | 94 | - | |||||||
| Inferior Frontal Gyrus | 12, −36, −12 | 769 | Right Lingual Gyrus | 219 | .000002 | .000025 | −.26 (.18) | .06 (.24) | |
| Vermis | 166 | 37 | |||||||
| Left Cerebellum | 124 | 14 | |||||||
| Right Cerebellum | 140 | 47 | |||||||
| Right Parahippocampal Gyrus | 37 | 12 | |||||||
| Brainstem | 29 | 1 | |||||||
| Left Lingual Gyrus | 28 | 2 | |||||||
| Left Parahippocampal Gyrus | 13 | 3 | |||||||
| Not assigned or less than 1% coverage | 13 | - |
Figure 1.

Axial, sagittal, and coronal views (centered at 47, −59, 14) indicating the location of a 211-voxel cluster where the slope of static FC with bilateral insula differed significantly between HC and CFS participants from the beginning to the end of the PASAT. This cluster included right middle temporal gyrus, right superior lateral occipital cortex, and right angular gyrus.
Figure 2.

Axial, sagittal, and coronal views (centered at −12, 2, 0) illustrating a 157-voxel cluster including left pallidum, left thalamus, left putamen, left caudate, and left nucleus accumbens where the slope of static FC with precuneus differed significantly between HC and CFS participants from the beginning to the end of the PASAT.
Figure 3.
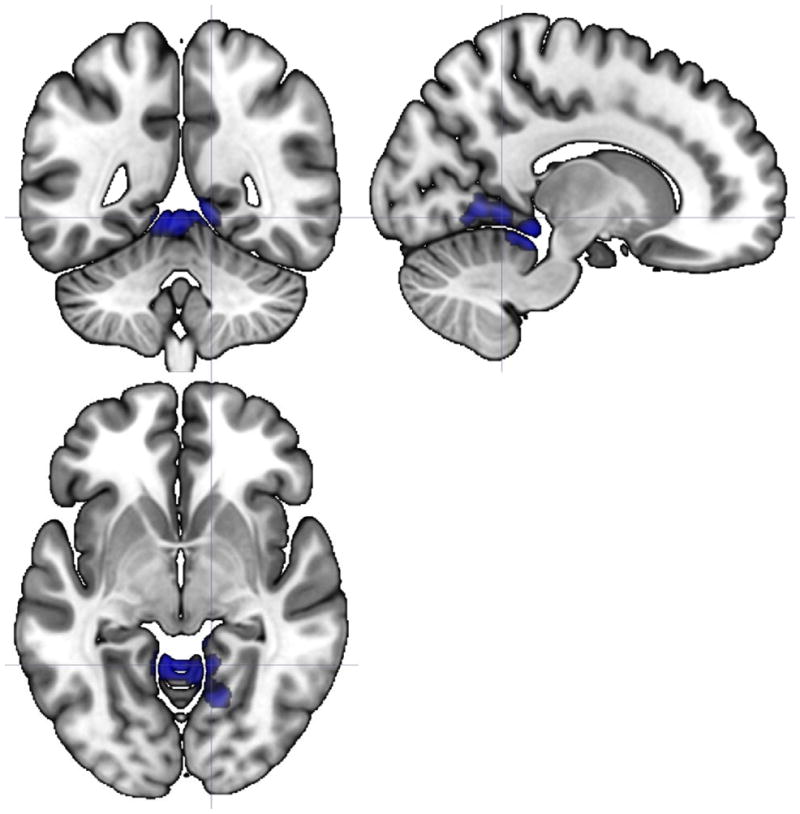
Axial, sagittal, and coronal views (centered at 13, −49, −5) illustrating a 779-voxel cluster where the slope of static FC with inferior frontal gyrus differed significantly between HC and CFS participants from the beginning to the end of the PASAT. Regions included in the cluster were bilateral lingual gyrus, bilateral cerebellum and vermis, bilateral parahippocampal gyrus, and brainstem.
Figure 4.

Scatterplot demonstrating the significant correlation between inferior frontal gyrus connectivity with the significant cluster shown in Figure 3 and change in fatigue following PASAT completion (r = 0.53, p = 0.001).
3.4 Dynamic Functional Connectivity Analysis
Analyses indicated HC had significantly higher dFC than CFS for connectivity between hippocampus and right superior parietal lobule (Table 3). Across all participants, dynamic FC for these regions was significantly correlated with changes in fatigue from the first to the last time period of the PASAT, with greater values being associated with less fatigue (r = −0.49, p = 0.004; Figure 5). No other regions showed significant differences in dynamic FC between HC and CFS.
Table 3.
Seed regions differing in dynamic functional connectivity between HC and CFS (ROI-to-ROI)
| Seed Region | Significant ROIs | ROI p-Value (p<.05 FDR) | FDR-corrected p-value | HC Dynamic FC Mean (SD) | CFS Dynamic FC Mean (SD) |
|---|---|---|---|---|---|
| Hippocampus | Right Superior Parietal Lobule | .003 | .04 | .038 (.03) | −.012 (.03) |
Figure 5.

Scatterplot demonstrating the significant correlation between dynamic FC of hippocampus with right superior parietal lobule and change in fatigue following PASAT completion (r = −.49, p = 0.004).
4. Discussion
4.1 Overview
Advances in functional neuroimaging have highlighted the dynamic nature of brain activity (Hutchison et al, 2013). sFC and dFC analyses provide complementary measures of interactions among brain regions (Kaiser et al, 2015), leading to a better understanding of brain function (Hutchison et al, 2013). Whereas sFC provides information about the magnitude (i.e., strength) of stable connections over time, dFC measures the amount of variability between connections (Kaiser et al, 2015).
The present study examined both sFC and dFC in individuals with CFS and HC during a mentally fatiguing task (i.e., PASAT). A priori seed ROIs were chosen based on previous research implicating these regions in CFS symptomology (Boissoneault et al, 2016). First, we identified group (i.e., HC, CFS) X time (i.e., comparing static FC from the beginning to the end of the PASAT) interaction effects in the strength of static FC, as well as the association between changes in static FC and increasing mental fatigue. Second, we identified between-group differences in dFC, with HC showing greater positive influence of task performance over time on functional connectivity than CFS.
4.2 Static FC
Our results indicated that sFC showed distinct changes during the PASAT in participants with CFS and controls in three seed regions including the insula, precuneus, and IFG. Within the patient sample, the bilateral insula seed ROI was associated with decreased static FC to the right lateralized middle temporal gyrus, superior lateral occipital cortex, and angular gyrus, whereas HC showed an increase in the coherence of these regions. Prolonged mental fatigue in HC has been associated with increased activation of the visual cortex (Ishii et al, 2013). Similarly, the precuneus seed ROI was associated with decreased static FC to left lateralized pallidum, thalamus, putamen, caudate, and nucleus accumbens in CFS and increased static FC to these regions in HC. The precuneus has been described as a key region for switching among cognitive states (Utevsky et al, 2014), as well as engaged during goal-directed attention (Behrmann et al, 2004) and source memory retrieval (Cavanna et al, 2006). Additionally, basal ganglia are thought to act as a gating mechanism during attention switching (van Schouwenburg et al, 2015). These sFC results therefore suggest that HC possibly use compensatory mechanisms towards the end of the mentally fatiguing task. In contrast, FC of the IFG to a large cluster spanning bilateral lingual gyrus, cerebellar vermis, bilateral cerebellum, bilateral parahippocampal gyrus and brainstem tended to decrease in HC but increased slightly in CFS. Interestingly, altered functional activation for several of these regions during PASAT performance in CFS participants has been previously reported (Cook et al., 2007).
Taken together, analyses suggest that changes in sFC associated with performance of a fatiguing task differ significantly between participants with CFS and HC. We speculate that these differences in sFC changes may reflect a failure of compensatory mechanisms in CFS patients over the course of a cognitive task, which results in higher levels of fatigue over time. This possibility is supported by the finding that greater increases in IFG FC to cerebellar, occipital, and temporal structures (which tended to decrease in HC, but not CFS) correlated with greater changes in fatigue ratings over the course of the task (Figure 4).
4.3 Differences in Dynamic FC Between Groups
Our results suggested that over time, task engagement in PASAT resulted in greater positive association between hippocampus and right superior parietal lobule for HC. In contrast, the opposite pattern was noted for CFS participants. Previous research indicates decreased activation of the hippocampus during a fatiguing test battery involving working memory and inhibitory function was linked to HPA-axis dysfunction and greater fatigue ratings (Klaassen et al., 2013). Aberrant activation of the hippocampus during extended PASAT performance in CFS patients has also been noted (Cook et al., 2007). Given the hypothesized role of the hippocampus in maintaining alertness and arousal via its connection to limbic structures (Sforza et al., 2016) and the role of the SPL in attentional function (Vincent et al, 2008), it stands to reason that greater positive coherence between these regions over time may help to maintain alertness, while greater negative coherence may be associated with fatigue. This potential explanation is supported by our results showing that although mean dFC between these hippocampus and right SPL was just slightly negative in CFS, those participants with stronger negative dFC (i.e., stronger anticorrelation between hippocampus and right SPL as a function of time) reported the highest increases in fatigue as a result of PASAT task performance.
4.4 Study Strengths
To our knowledge, results from the present study provide the first evidence that fatigue-inducing cognitive activity, implemented with a neuropsychological task involving sustained cognitive effort (PASAT), is associated with alterations in patterns of FC between brain regions associated with aspects of CFS symptomatology. As illustrated by analyses of in-scanner fatigue ratings, this procedure was effective at increasing fatigue in both CFS and HC. Thus, the noted differences in sFC and dFC metrics between CFS and HC are unlikely to be the result of differential efficacy of fatigue induction.
The use of ASL to characterize functional connectivity is a significant strength of our study. The majority of studies utilizing FC approaches have relied on blood-oxygenation level dependent (BOLD) fMRI. However, ASL has several advantages over BOLD for FC analysis, including a flat noise spectrum, lower sensitivity to motion and low-frequency artifacts, and strong correspondence with underlying neuronal activity (Chen et al, 2015; Fernandez-Seara et al, 2015).
The use of both sFC and dFC measures represents another significant strength of this study. As discussed in the introduction, sFC is thought to reflect the strength of connectivity between examined regions whereas dFC reflects the degree to task performance over time modulates the correspondence between regions. The use of dFC analysis across the duration of PASAT performance in this study allowed consideration of how degree of change in FC between regions underlying aspects of CFS symptomatology relates to the experience of fatigue.
4.5 Limitations
Though informative regarding functional neural correlates of fatigue and related perturbations associated with CFS, our data do have certain limitations. For instance, because this study is cross sectional, it is unclear whether perturbations in sFC and dFC during fatigue induction predated or resulted from CFS. In addition, although evidence suggests fatigue is best modeled experimentally as a single factor (Buckner et al, 2008), it is possible that alternative fatigue-inducing strategies (e.g., prolonged physical exertion) may produce differential results. However, we note that fatigue induction by requiring prolonged cognitive effort may have particular relevance to CFS patients given frequent reports of cognitive and memory difficulties in this population. Another concern is that the differential effect of PASAT task performance on sFC between HC and CFS participants may be due to factors other than task related fatigue, including the increase in stimulus frequency after 3 minutes, working memory load, or others. Although the significant correlation between IFG connectivity and change in fatigue ratings provides some confidence that the detected effects of on sFC are relevant to the experience of fatigue, this possibility should be investigated in future studies. Finally, measures of education level were not available for the reported sample. This may be construed as a limitation because education level and working memory capacity are often related. We note, however, that we focused explicitly on the experience of fatigue and not cognitive performance per se; thus, we believe this is a minor concern for the present report.
5. Conclusions
Taken together, our results indicate that the dFC analysis of ASL fMRI data may be a promising approach for elucidating perturbations in brain network characteristics underlying CFS, or the experience of fatigue in general. We found that CFS participants demonstrated differential change in sFC, which correlated with fatigue, between several brain regions associated with working memory, sensory function, and motor function from the beginning to the end of a fatiguing cognitive task compared to HC. In addition, CFS participants showed lower dFC between the hippocampus and right superior parietal lobule. Like sFC, dFC also correlated with their task related fatigue. To our knowledge, these data provide the first evidence that lower dFC between memory and attention-related regions may underlie CFS patients’ report of task-induced fatigue. Further research is needed to determine whether behavioral and pharmacological treatments for CFS may help normalize sFC and dFC abnormalities for this population.
Acknowledgments
This study was supported by NIH grant R01 NR014049-01 and NIH/NCATS Clinical and Translational Science grants UL1 TR000064. The expert assistance of Yesenia E. Lucas and Ricky J. Madhavan is gratefully acknowledged.
Footnotes
Disclosure: None of the authors have any financial or other relationships that might result in a conflict of interest.
Reference List
- Behrmann M, Geng JJ, Shomstein S. Parietal cortex and attention. Curr Opin Neurobiol. 2004;14:212–217. doi: 10.1016/j.conb.2004.03.012. [DOI] [PubMed] [Google Scholar]
- Behzadi Y, Restom K, Liau J, Liu TT. A component based noise correction method (CompCor) for BOLD and perfusion based fMRI. Neuroimage. 2007;37:90–101. doi: 10.1016/j.neuroimage.2007.04.042. [DOI] [PMC free article] [PubMed] [Google Scholar]
- Biswal B, Kunwar P, Natelson BH. Cerebral blood flow is reduced in chronic fatigue syndrome as assessed by arterial spin labeling. J Neurol Sci. 2011;301:9–11. doi: 10.1016/j.jns.2010.11.018. [DOI] [PMC free article] [PubMed] [Google Scholar]
- Boissoneault J, et al. Abnormal resting state functional connectivity in patients with chronic fatigue syndrome: An arterial spin-labeling fMRI study. Magn Reson Imaging. 2016;34:603–618. doi: 10.1016/j.mri.2015.12.008. [DOI] [PMC free article] [PubMed] [Google Scholar]
- Benjamini Y, Hochberg Y. Controlling the False Discovery Rate - a Practical and Powerful Approach to Multiple Testing. Journal of the Royal Statistical Society Series B-Methodological. 1995;57:289–300. [Google Scholar]
- Buckner RL, Andrews-Hanna JR, Schacter DL. The brain’s default network: anatomy, function, and relevance to disease. Ann N Y Acad Sci. 2008;1124:1–38. doi: 10.1196/annals.1440.011. [DOI] [PubMed] [Google Scholar]
- Bullmore E, Sporns O. The economy of brain network organization. Nat Rev Neurosci. 2012;13:336–349. doi: 10.1038/nrn3214. [DOI] [PubMed] [Google Scholar]
- Cavanna AE, Trimble MR. The precuneus: a review of its functional anatomy and behavioural correlates. Brain. 2006;129:564–583. doi: 10.1093/brain/awl004. [DOI] [PubMed] [Google Scholar]
- Chang C, Glover GH. Time-frequency dynamics of resting-state brain connectivity measured with fMRI. Neuroimage. 2010;50:81–98. doi: 10.1016/j.neuroimage.2009.12.011. [DOI] [PMC free article] [PubMed] [Google Scholar]
- Chen JJ, Jann K, Wang DJ. Characterizing Resting-State Brain Function Using Arterial Spin Labeling. Brain Connect. 2015;5:527–542. doi: 10.1089/brain.2015.0344. [DOI] [PMC free article] [PubMed] [Google Scholar]
- Cook DB, O’Connor PJ, Lange G, Steffener J. Functional neuroimaging correlates of mental fatigue induced by cognition among chronic fatigue syndrome patients and controls. Neuroimage. 2007;36:108–122. doi: 10.1016/j.neuroimage.2007.02.033. [DOI] [PubMed] [Google Scholar]
- Costa DC, Tannock C, Brostoff J. Brainstem perfusion is impaired in chronic fatigue syndrome. QJM. 1995;88:767–773. [PubMed] [Google Scholar]
- Dai W, Garcia D, deBazelaire C, Alsop DC. Continuous flow-driven inversion for arterial spin labeling using pulsed radio frequency and gradient fields. Magn Reson Med. 2008;60:1488–1497. doi: 10.1002/mrm.21790. [DOI] [PMC free article] [PubMed] [Google Scholar]
- De Lange FP, et al. Neural correlates of the chronic fatigue syndrome--an fMRI study. Brain. 2004;127:1948–1957. doi: 10.1093/brain/awh225. [DOI] [PubMed] [Google Scholar]
- Desikan RS, Ségonne F, Fischl B, Quinn BT, Dickerson BC, Blacker D, Buckner RL, Dale AM, Maguire RP, Hyman BT, Albert MS, Killiany RJ. An automated labeling system for subdividing the human cerebral cortex on MRI scans into gyral based regions of interest. Neuroimage. 2006 Jul 1;31(3):968–80. doi: 10.1016/j.neuroimage.2006.01.021. [DOI] [PubMed] [Google Scholar]
- Fernandez-Seara MA, et al. Resting state functional connectivity of the subthalamic nucleus in Parkinson’s disease assessed using arterial spin-labeled perfusion fMRI. Hum Brain Mapp. 2015;36:1937–1950. doi: 10.1002/hbm.22747. [DOI] [PMC free article] [PubMed] [Google Scholar]
- Fukuda K, et al. The chronic fatigue syndrome: a comprehensive approach to its definition and study. International Chronic Fatigue Syndrome Study Group. Ann Intern Med. 1994;121:953–959. doi: 10.7326/0003-4819-121-12-199412150-00009. [DOI] [PubMed] [Google Scholar]
- Gay CW, et al. Abnormal Resting-State Functional Connectivity in Patients with Chronic Fatigue Syndrome: Results of Seed and Data-Driven Analyses. Brain Connect. 2016;6:48–56. doi: 10.1089/brain.2015.0366. [DOI] [PMC free article] [PubMed] [Google Scholar]
- Goldstein JM, Seidman LJ, Makris N, Ahern T, O’Brien LM, Caviness VS, Jr, Kennedy DN, Faraone SV, Tsuang MT. Hypothalamic abnormalities in schizophrenia: sex effects and genetic vulnerability. Biol Psychiatry. 2007 Apr 15;61(8):935–45. doi: 10.1016/j.biopsych.2006.06.027. [DOI] [PubMed] [Google Scholar]
- Gronwall DM. Paced auditory serial-addition task: a measure of recovery from concussion. Percept Mot Skills. 1977;44:367–373. doi: 10.2466/pms.1977.44.2.367. [DOI] [PubMed] [Google Scholar]
- Hermundstad AM, et al. Structural foundations of resting-state and task-based functional connectivity in the human brain. Proc Natl Acad Sci U S A. 2013;110:6169–6174. doi: 10.1073/pnas.1219562110. [DOI] [PMC free article] [PubMed] [Google Scholar]
- Holgate ST, Komaroff AL, Mangan D, Wessely S. Chronic fatigue syndrome: understanding a complex illness. Nat Rev Neurosci. 2011;12:539–544. doi: 10.1038/nrn3087. [DOI] [PubMed] [Google Scholar]
- Hutchison RM, et al. Dynamic functional connectivity: promise, issues, and interpretations. Neuroimage. 2013;80:360–78. doi: 10.1016/j.neuroimage.2013.05.079. Epub;%2013 May 24.: 360–378. [DOI] [PMC free article] [PubMed] [Google Scholar]
- Ishii A, et al. Neural effects of prolonged mental fatigue: a magnetoencephalography study. Brain Res. 2013;1529:105–112. doi: 10.1016/j.brainres.2013.07.022. [DOI] [PubMed] [Google Scholar]
- Kaiser RH, et al. Dynamic Resting-State Functional Connectivity in Major Depression. Neuropsychopharmacology. 2015:10. doi: 10.1038/npp.2015.352. [DOI] [PMC free article] [PubMed] [Google Scholar]
- Klaassen EB, de Groot RH, Evers EA, Nicolson NA, Veltman DJ, Jolles J. Cortisol and induced cognitive fatigue: effects on memory activation in healthy males. Biol Psychol. 2013;94:167–174. doi: 10.1016/j.biopsycho.2013.05.015. [DOI] [PubMed] [Google Scholar]
- Lange G, et al. Objective evidence of cognitive complaints in Chronic Fatigue Syndrome: A BOLD fMRI study of verbal working memory. Neuroimage. 2005;26:513–524. doi: 10.1016/j.neuroimage.2005.02.011. [DOI] [PubMed] [Google Scholar]
- Miller AH, et al. Decreased Basal Ganglia Activation in Subjects with Chronic Fatigue Syndrome: Association with Symptoms of Fatigue. PLoS ONE. 2014;9:e98156. doi: 10.1371/journal.pone.0098156. [DOI] [PMC free article] [PubMed] [Google Scholar]
- Nieto-Castanon A. CONN change log: CONN14k. 2014 Retrieved 6/20/2016, 2016, from http://www.nitrc.org/frs/shownotes.php?release_id=2733.
- O’Reilly JX, Woolrich MW, Behrens TE, Smith SM, Johansen-Berg H. Tools of the trade: psychophysiological interactions and functional connectivity. Soc Cogn Affect Neurosci. 2012;7:604–609. doi: 10.1093/scan/nss055. [DOI] [PMC free article] [PubMed] [Google Scholar]
- Peirce JW. PsychoPy--Psychophysics software in Python. J Neurosci Methods. 2007;162:8–13. doi: 10.1016/j.jneumeth.2006.11.017. [DOI] [PMC free article] [PubMed] [Google Scholar]
- Peirce JW. Generating Stimuli for Neuroscience Using PsychoPy. Front Neuroinform. 2009;2:10. doi: 10.3389/neuro.11.010.2008. [DOI] [PMC free article] [PubMed] [Google Scholar]
- PENNEBAKER J. The psychology of physical symptoms. New York: Springer Verlag; 1983. [Google Scholar]
- Petcharunpaisan S, Ramalho J, Castillo M. Arterial spin labeling in neuroimaging. World J Radiol. 2010;2:384–398. doi: 10.4329/wjr.v2.i10.384. [DOI] [PMC free article] [PubMed] [Google Scholar]
- Price DD, Bush FM, Long S, Harkins SW. A comparison of pain measurement characteristics of mechanical visual analogue and simple numerical rating scales. Pain. 1994;56:217–226. doi: 10.1016/0304-3959(94)90097-3. [DOI] [PubMed] [Google Scholar]
- Sforza E, Celle S, Saint-Martin M, Barthelemy JC, Roche F. Hippocampus volume and subjective sleepiness in older people with sleep-disordered breathing: a preliminary report. J Sleep Res. 2016;25:190–193. doi: 10.1111/jsr.12367. [DOI] [PubMed] [Google Scholar]
- Shigihara Y, et al. Two types of mental fatigue affect spontaneous oscillatory brain activities in different ways. Behav Brain Funct. 2013;9:2–9. doi: 10.1186/1744-9081-9-2. [DOI] [PMC free article] [PubMed] [Google Scholar]
- Tagliazucchi E, Laufs H. Multimodal imaging of dynamic functional connectivity. Front Neurol. 2015;6S:10. doi: 10.3389/fneur.2015.00010. [DOI] [PMC free article] [PubMed] [Google Scholar]
- Tanaka M, Ishii A, Watanabe Y. Neural effect of mental fatigue on physical fatigue: a magnetoencephalography study. Brain Res. 2014;1542:49–55. doi: 10.1016/j.brainres.2013.10.018. [DOI] [PubMed] [Google Scholar]
- Utevsky AV, Smith DV, Huettel SA. Precuneus is a functional core of the default-mode network. J Neurosci. 2014;34:932–940. doi: 10.1523/JNEUROSCI.4227-13.2014. [DOI] [PMC free article] [PubMed] [Google Scholar]
- van Schouwenburg MR, den Ouden HE, Cools R. Selective attentional enhancement and inhibition of fronto-posterior connectivity by the basal ganglia during attention switching. Cereb Cortex. 2015;25:1527–1534. doi: 10.1093/cercor/bht345. [DOI] [PubMed] [Google Scholar]
- Vincent JL, Kahn I, Snyder AZ, Raichle ME, Buckner RL. Evidence for a frontoparietal control system revealed by intrinsic functional connectivity. J Neurophysiol. 2008;100:3328–3342. doi: 10.1152/jn.90355.2008. [DOI] [PMC free article] [PubMed] [Google Scholar]
- Wang Z. Improving cerebral blood flow quantification for arterial spin labeled perfusion MRI by removing residual motion artifacts and global signal fluctuations. Magn Reson Imaging. 2012;30:1409–1415. doi: 10.1016/j.mri.2012.05.004. [DOI] [PMC free article] [PubMed] [Google Scholar]
- Wang Z, et al. Empirical optimization of ASL data analysis using an ASL data processing toolbox: ASLtbx. Magn Reson Imaging. 2008;26:261–269. doi: 10.1016/j.mri.2007.07.003. [DOI] [PMC free article] [PubMed] [Google Scholar]
- Whitfield-Gabrieli S, Nieto-Castanon A. Conn: a functional connectivity toolbox for correlated and anticorrelated brain networks. Brain Connect. 2012;2:125–141. doi: 10.1089/brain.2012.0073. [DOI] [PubMed] [Google Scholar]
- Wu WC, Fernandez-Seara M, Detre JA, Wehrli FW, Wang J. A theoretical and experimental investigation of the tagging efficiency of pseudocontinuous arterial spin labeling. Magn Reson Med. 2007;58:1020–1027. doi: 10.1002/mrm.21403. [DOI] [PubMed] [Google Scholar]
- Yoshiuchi K, Farkas J, Natelson BH. Patients with chronic fatigue syndrome have reduced absolute cortical blood flow. Clin Physiol Funct Imaging. 2006;26:83–86. doi: 10.1111/j.1475-097X.2006.00649.x. [DOI] [PubMed] [Google Scholar]