Abstract
Objective
Restricting dietary methionine to 0.17% produces a series of physiological responses through coordinated transcriptional effects in liver and adipose tissue. The goal of the present work was to determine the threshold concentrations above and below 0.17% at which the beneficial responses to 0.17% dietary methionine are preserved.
Methods
Diets were formulated to restrict methionine to different degrees, followed by evaluation of the transcriptional and physiological responses to the different diets.
Results
Restriction of dietary methionine to 0.25%, but not 0.34%, was partially effective in reproducing the metabolic phenotype produced by restriction of methionine to 0.17%, while restriction of methionine to 0.12% reproduced the responses produced by restriction to 0.17% but failed to support growth and caused excessive weight loss. Restriction beyond 0.12% initiated responses characteristic of essential amino acid deprivation including food aversion and rapid weight loss.
Conclusions
Restriction of dietary methionine to levels above 0.25% was without effect while restriction to levels below 0.12% produced responses characteristic of essential amino acid deprivation. In addition, although restriction of dietary methionine to 0.12% does not evoke essential amino acid deprivation responses, it provides insufficient methionine to support growth. The ideal range of dietary methionine restriction is from 0.17% to 0.25%.
Keywords: essential amino acid, nutrient sensing, obesity, lipid, FGF21
Introduction
Dietary methionine restriction is accomplished using diets formulated from elemental amino acids that reduce methionine content from control levels of 0.86% to restricted levels of 0.17%. The diets also lack cysteine so cysteine and its downstream metabolites, glutathione and taurine, must be formed through the trans-sulfuration pathway. (1, 2). The initial description of methionine (Met) restriction showed that diets containing 0.17% Met increased lifespan by 30% in Fischer 344 rats (3). Although longevity was the primary endpoint of these studies (4–6), recent studies have expanded their focus to the short-term metabolic effects of Met restriction (7–9). With rare exception (10–12), most contemporary studies examining effects of Met restriction use a Met concentration of 0.17%. The assumption is that restriction of Met to 0.17% is optimal for increasing both longevity and short-term metabolic effects. Given that an important goal of our work is to develop therapeutic tools based on the biology of Met restriction, a key objective of the present work is to identify upper and lower thresholds of Met restriction where metabolic responses are optimal.
Diets completely devoid of single essential amino acids (EAA) like Met produce a well-documented series of responses including food aversion, increased energy expenditure (EE), rapid loss of body weight (BW) and adiposity, and death (13–18). In contrast, responses evoked by dietary Met restriction are fundamentally different, increasing both metabolic health and lifespan (4–12, 19, 20). Two important unresolved questions include (1) what is the upper threshold for dietary Met above 0.17% where beneficial metabolic effects are initially detected?, and (2) at what concentrations of Met below 0.17% are the counterproductive effects of EAA deprivation initiated? Using a combination of in vivo and ex vivo phenotyping approaches and carefully formulated diets, we report that a range of dietary Met concentration between 0.12% and 0.25% is the effective range for dietary Met restriction.
Materials and Methods
Animals and Diets
Experiments were reviewed and approved by the Institutional Animal Care and Use Committee of Pennington Biomedical based on guidelines established by the Animal Welfare Act, National Research Council, and Public Health Service Policy on humane use of laboratory animals.
Four experiments were conducted using male C57BL6/J mice obtained from Jackson Laboratory (Bar Harbor, ME). Mice in Experiments 1, 2, and 4 were 5 weeks of age and 18 weeks in Experiment 3. Mice were single-housed in shoebox cages with corncob bedding and given control (CON) diet containing 0.86%Met until randomized to either CON or Met-restricted diets. Diets containing 0.86%, 0.34%, 0.25%, 0.17%, 0.12%, 0.08%, 0.04%, or 0% Met were formulated as extruded pellets (Dyets Inc, Bethlehem, PA) and provided ad libitum in each experiment. The energy content of all diets was 15.96 kJ/g, with 18.9% from fat (provided as corn oil), 64.9% from carbohydrates, and 14.8% from a custom mixture of L-amino acids. Met-restricted diets were supplemented with L-glutamic acid to compensate for the reduced Met content. Water was provided ad libitum in all experiments. Room temperature was 22–23°C and lights were on 12 hr/day from 7am to 7pm. Food consumption was assessed at various intervals in each experiment by weighing the unconsumed and wasted food.
In Experiments 1,2 and 4, body composition was assessed at baseline and weekly thereafter using nuclear magnetic resonance spectroscopy (Bruker Mini Spec, Billerika, MA). Energy expenditure (EE) was measured using indirect calorimeters from either Columbus Instruments (Columbus, OH) or TSE (Chesterfield, MO). Respiratory exchange ratio was calculated as the ratio between VCO2 produced to VO2 consumed. EE, expressed as kJ/hr, was calculated as VO2 * [3.815 + (1.232 * RER) * 4.1868]. Body composition was measured immediately prior to and upon exit from the calorimeters and extrapolated over the period of EE measurement.
Mice were euthanized after a 4 hour fast using CO2-induced narcosis and decapitation. Inguinal white adipose tissue (IWAT), brown adipose tissue (BAT), and liver were harvested and snap frozen. Trunk blood and serum were collected for analysis.
RNA Isolation
Total RNA was isolated using RNeasy Mini Kits (QIAGEN, Valencia, CA). cDNA obtained by reverse transcription was used for RT-PCR (Applied Biosystems, Foster City, CA) of target genes and cyclophilin using primers listed in Table 1.
Table 1.
Quantitative PCR Primer Sequences
| Target Gene | Forward (5′ to 3′) | Reverse (5′ to 3′) |
|---|---|---|
| Scd1 | GTGCCGTGGGCGAGGGCTTC | AGCCCAAAGCTCAGCTACTCTT |
| Fasn | TCCTGGAACGAGAACACGATCT | GAGACGTGTCACTCCTGGACTTG |
| Asns | GGGGGCCTGGACTCGAGCTT | TTGCCACCTTTCTAGCGGCCA |
| Vldlr | TGAGCAGTGTGGCCGTCAGC | TCGGCAGGTTCGAGAAGGGCAG |
| Fgf21 | TGACACCCAGGATTTGAATGAC | GCAGCCAATGATGTGTGCTTAC |
| Leptin | TGCCTTCCCAAAATGTGCTG | TGATTCTTGGGAGCCTGGTG |
| Ucp1 | GATCCAAGGTGAAGGCCAGG | GTTGACAAGCTTTCTGTGGTGG |
| Bmp8b | CTGTCCCATCCTTGTCGTCG | AGCAGGGATCTGGGTTAGGT |
Insulin Tolerance Test
Insulin was administered via intraperitoneal injections after a 4-hour fast at a dose of 0.75 units per kg body weight. Blood glucose was measured with an OneTouch Ultra blood glucometer at 15-minute intervals for 60 min and the area under the glucose curve was determined.
Serum Analyses
Serum insulin and FGF21 were analyzed via ELISA (Insulin, Millipore, Billerica, MA; FGF21 – R&D Systems, Minneapolis, MN).
Experiment 1
Diets containing 0.34% Met, 0.17% Met, or 0.86% Met (CON) were fed to eight mice per group for 7 weeks, followed by measurement of EE for 1 week by IDC. Mice were returned to their home cage for 24 hours prior to tissue harvest. All mice received the diet to which they were initially assigned for the duration of the experiment.
Experiment 2
To further identify the upper threshold for Met restriction where responses are first detected, diets containing 0.25% Met, 0.17% Met, or CON levels of 0.86% Met were fed to eight mice per group for 8 weeks. Thereafter, EE was measured for 3 days. Mice were returned to their home cage for 1 week prior to insulin tolerance tests (ITT). Mice were allowed to recover for 1 week prior to tissue collection.
Experiment 3
To determine if concentrations of dietary Met below 0.12% Met producedEAA deprivation responses, diets were formulated containing 0% Met, 0.04%, 0.08% Met, and 0.86% Met. Mice were randomized to the 4 diets (8 mice per group) and cumulative food consumption and BW change were measured at 2 day intervals. The study was terminated prematurely because BW loss in all but the CON 0.86% Met group exceeded 20% by day 8.
Experiment 4
To identify the lower threshold of dietary Met where beneficial responses are retained but negative responses of EAA deprivation are avoided, diets containing 0.12% Met, 0.17% Met, or CON levels of 0.86% Met were provided after a one week adaptation to the CON diet. Thereafter, BW and composition were determined prior to randomization of 8 mice per group to the 3 diets to compare the acute effects of 0.17% Met and 0.12% Met diets on EE over 14 days. Thereafter, mice were fed their respective diets for another 5 weeks prior to measurement of EE again for 1 week prior to tissue harvest.
Statistical Analyses
BW, tissue composition, food intake, water intake, and gene expression data were analyzed using a one-way analysis of variance and multiple t tests with the Holm-Sidak correction. For indirect calorimetry, group differences were compared by analysis of covariance, using least squares means that accounted for variation in EE attributable to differences in lean mass, fat mass, activity, and food intake between dietary groups as described previously (21). Insulin tolerance among groups was compared based on the area under the glucose clearance curves. Protection against Type I errors was set at 5% (α = 0.05).
Results
Experiment 1
Restricting Met from control levels of 0.86% to 0.17% reduced BW and adiposity, and increased food intake (Figs. 1A–1C) as before (9). Mice on the 0.17% Met diet increased water intake by 2-fold over the first two weeks of the study, and maintained the increase for the duration (Fig. 1D). In contrast, restricting Met to 0.34% produced no effects on BW, adiposity or food intake relative to the CON diet (Figs 1A–1C). The only indication of an effect of 0.34% Met was a small but significant 20–30% increase in water intake during weeks 2–4, but not for the remainder of the study (Fig. 1D).
Figure 1. Physiological Data for Experiment 1.
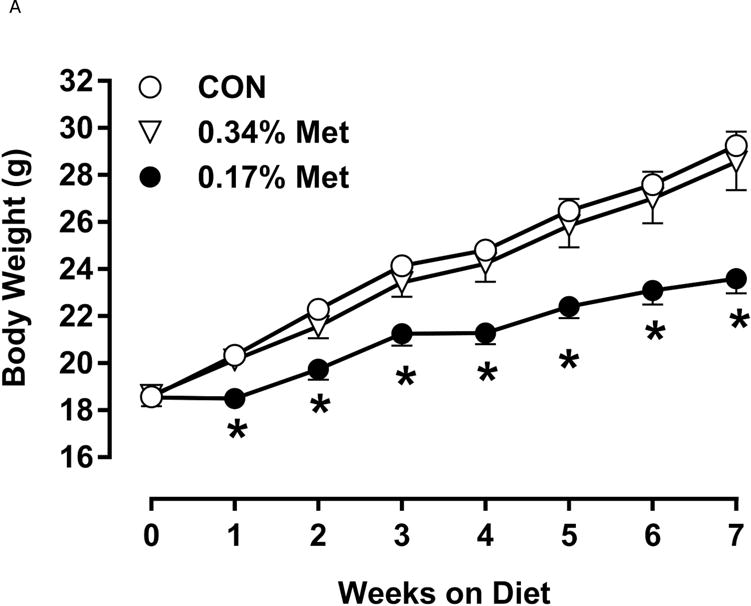
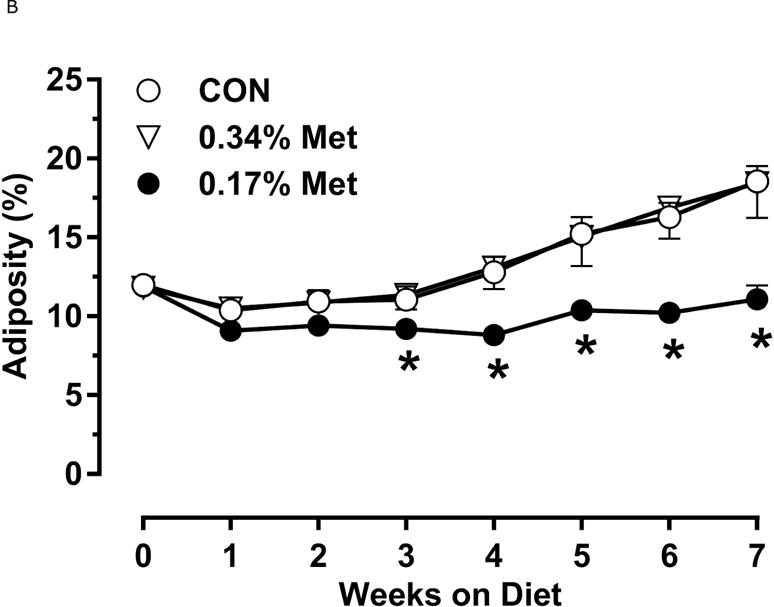
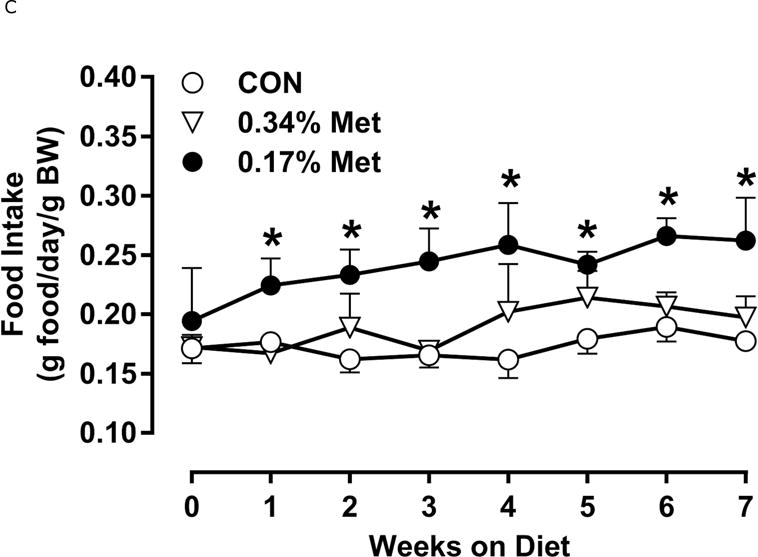
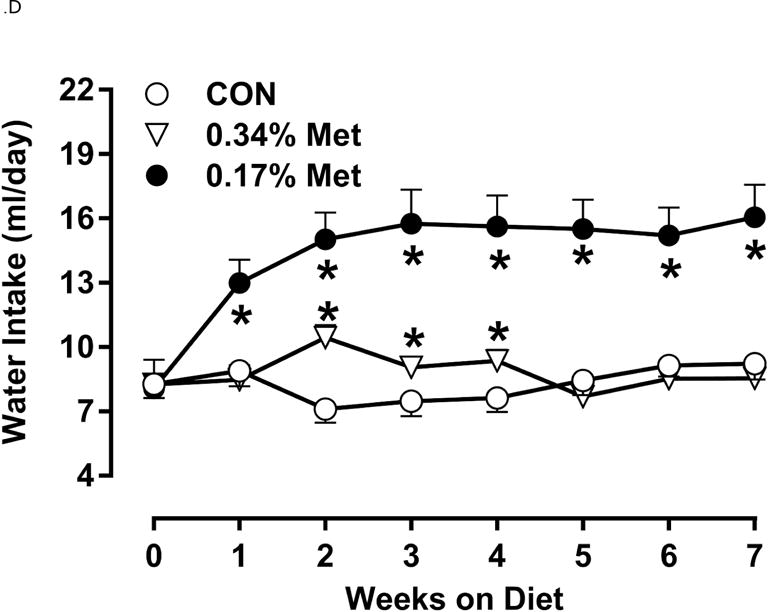
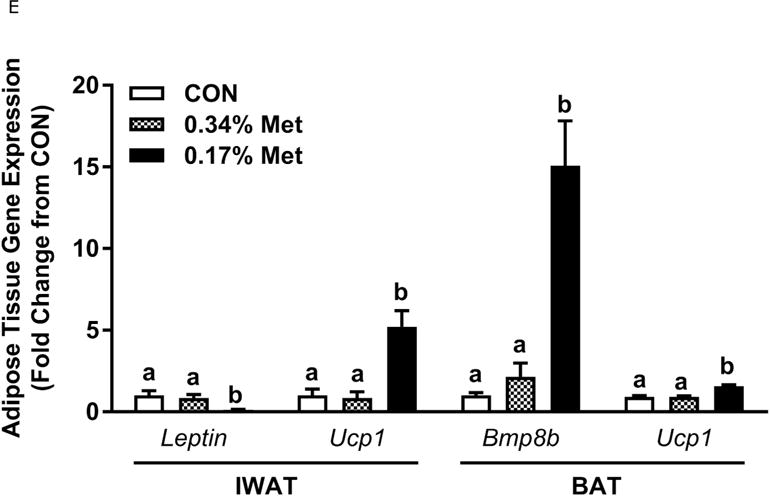
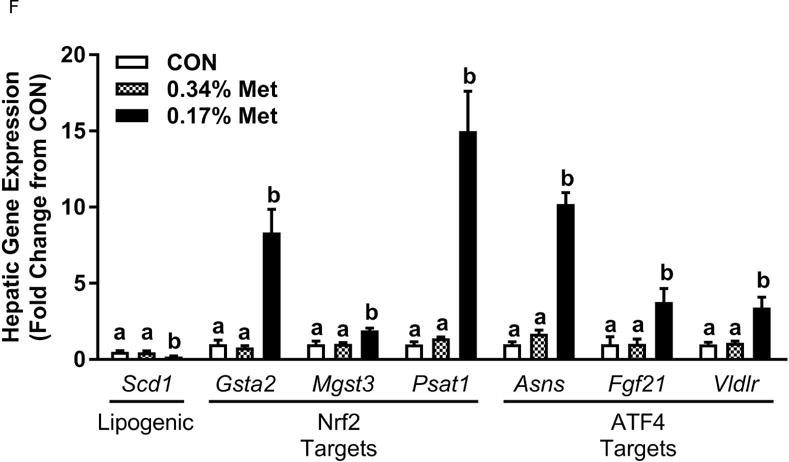
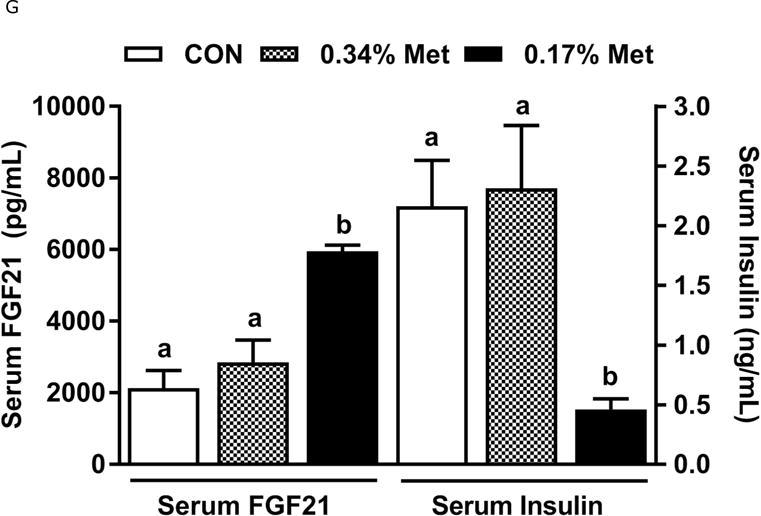
Body weight (A), food (B) and water (C) intake, and adiposity (D) were measured at weekly intervals over the course of the entire study. Adipose tissue (E) and hepatic (F) gene expression were measured via qPCR and expressed as the fold change between MR and CON. Serum metabolites FGF21 and insulin (G) were measured via ELISA, while serum and hepatic triglyceride content (H) were analyzed via colorimetric assays. CON – control; MR – Met restricted diets; IWAT – inguinal white adipose tissue; BAT – brown adipose tissue; Scd1 – stearoyl CoA desaturase 1; Nrf2 – Nuclear factor erythroid 2-related factor 2; Gsta2 – Glutathione S-Transferase α2; Mgst3 – Microsomal Glutathione S-Transferase 3; Psat1 – Phosphoserine Aminotransferase 1; ATF4 – Activating Transcription Factor 4; Asns – asparagine synthase; Vldlr – very low density lipoprotein receptor; Fgf21 – fibroblast growth factor 21; Ucp1 – uncoupling protein 1; Bmp8b–bone morphogenetic protein 8b. All values are expressed as mean ± SEM. * indicates significant difference from CON at p < 0.05; groups not sharing a common letter are significantly different at p < 0.05.
The transcriptional effects of the diets in adipose tissue and liver are illustrated in Figs. 1E–1F. Relative to CON, 0.17% Met reduced leptin mRNA and increased Ucp1 mRNA in IWAT, and simultaneously increased thermogenic markers, Bmp8b and Ucp1 mRNA in BAT (Fig. 1E). The 0.34% Met diet was without effect in either tissue (Fig. 1E). In liver, 0.17% Met faithfully reproduced its previously reported reduction in hepatic Scd1 mRNA, and activation of NRF2 and ATF4 target genes (22, 23) (Fig. 1F). The 0.34% Met diet failed to decrease hepatic Scd1 mRNA or increase Gsta2, Mgst3, Psat1, Asns, Fgf21, or Vldlr mRNA (Fig. 1F). A similar pattern emerged for circulating biomarkers, with 0.17% Met increasing serum FGF21 and reducing fasting insulin as before (20, 23) (Fig. 1G). In contrast, 0.34% Met failed to increase serum FGF21 or reduce fasting insulin (Fig. 1G). These findings illustrate that 0.34% Met reproduces none of the biological responses produced by 0.17% Met.
Experiment 2
To further refine the threshold for biological efficacy, we tested the efficacy of restricting Met to 0.25%. Over 8 weeks, 0.25% Met produced a nonsignificant decrease in BW (Fig. 2A). In contrast, both 0.25% Met and 0.17% Met decreased adiposity to similar extents relative to CON (Fig. 2B). The 0.25% Met diet was also effective in increasing food and water intake above CON levels, although not to the extent of 0.17% Met (Figs. 2C–2D). For both variables, 0.25% Met showed intermediate efficacy between CON and 0.17% Met diets.
Figure 2. Physiological Data for Experiment 2.
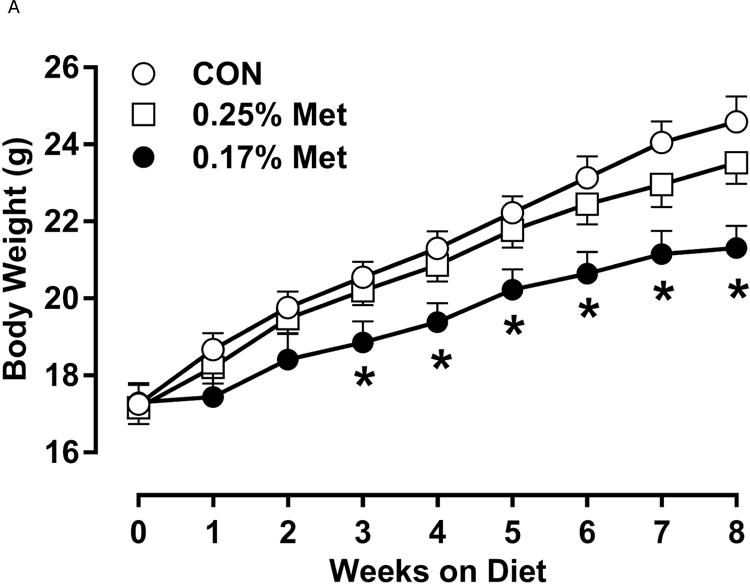
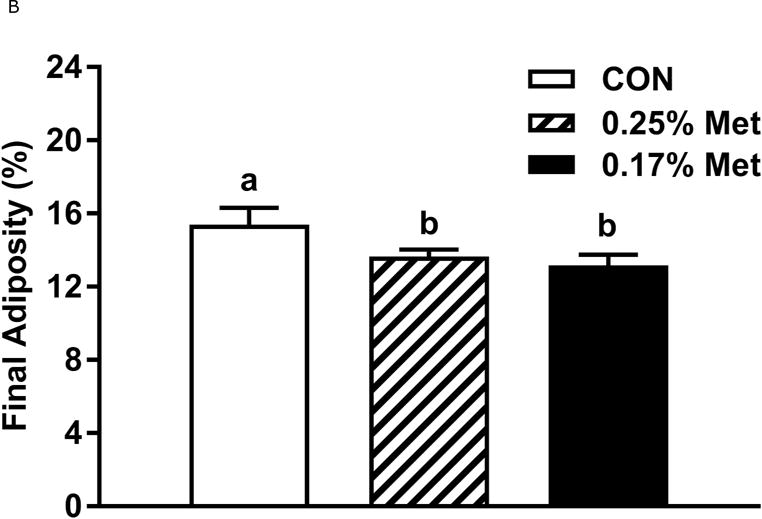
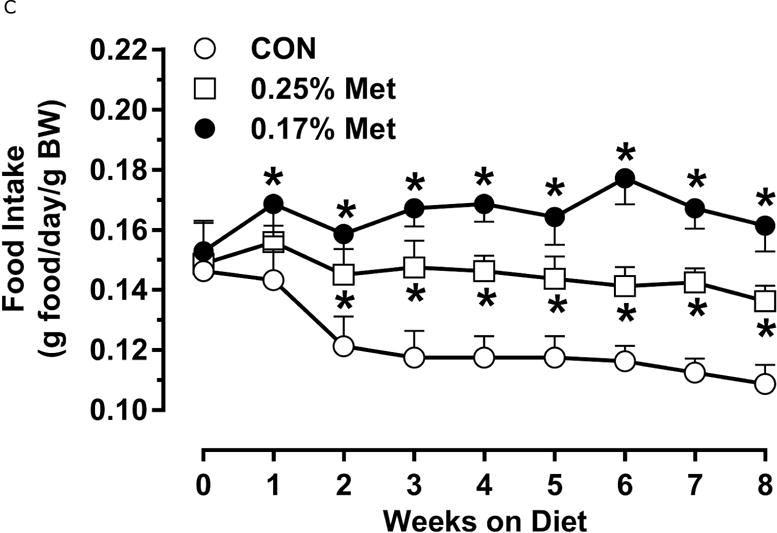
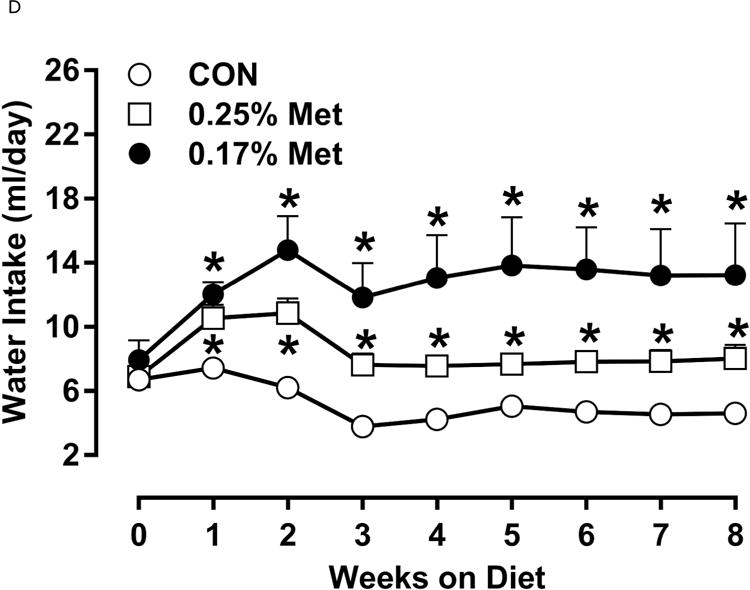
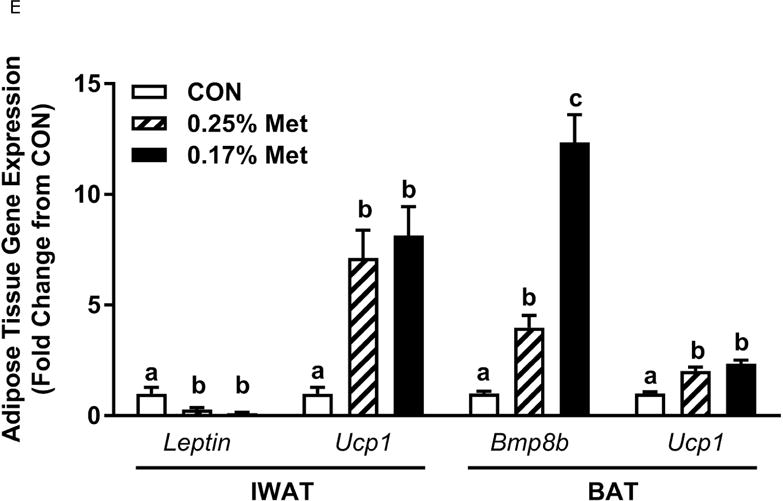
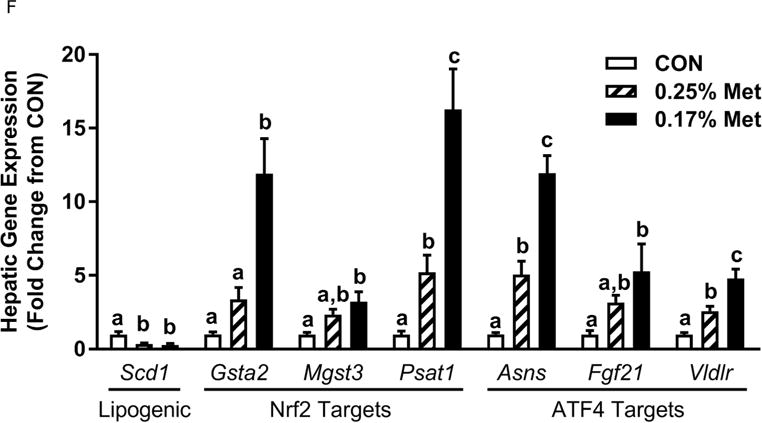
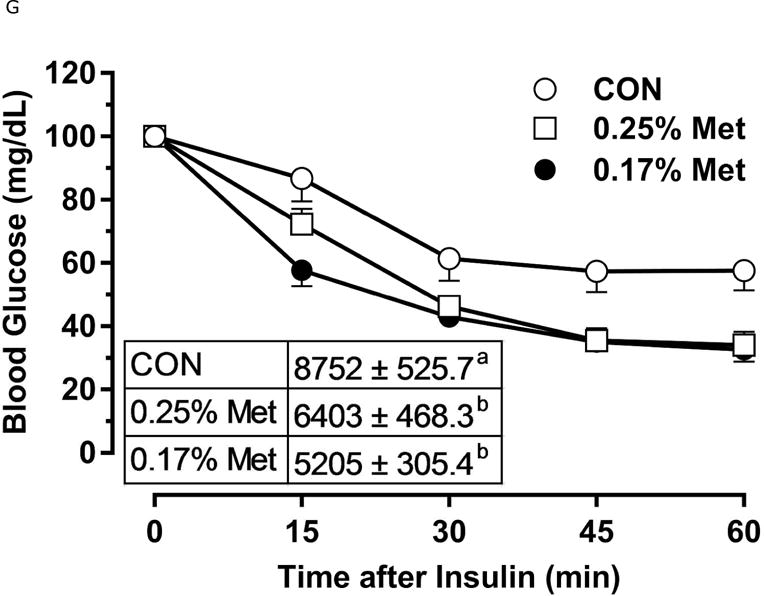
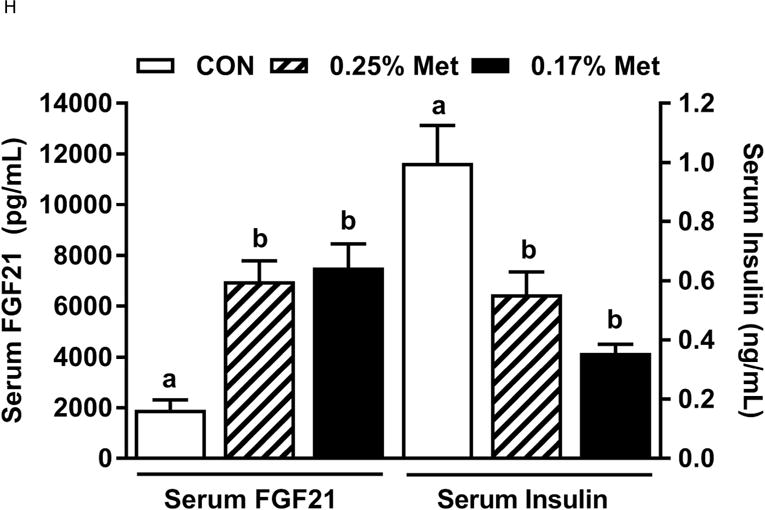
Body weight (A), food (B) and water (C) intake were measured at weekly intervals over the course of the entire study. Adiposity (D) is expressed as the mean body fat percentage following the 8 week dietary intervention. Adipose tissue (E) and hepatic (F) gene expression were measured via qPCR and expressed as the fold change between MR and CON. For the insulin tolerance test (G), blood glucose was determined via a standard blood glucometer in 15-minute intervals following an i.p. injection of insulin. Serum metabolites FGF21 and insulin were measured via ELISA (H). CON – control; MR – Met restricted diets; IWAT – inguinal white adipose tissue; BAT – brown adipose tissue; Scd1 – stearoyl CoA desaturase 1; Nrf2 – Nuclear factor erythroid 2-related factor 2; Gsta2 – Glutathione S-Transferase α2; Mgst3 – Microsomal Glutathione S-Transferase 3; Psat1 – Phosphoserine Aminotransferase 1; ATF4 – Activating Transcription Factor 4; Asns – asparagine synthase; Vldlr – very low density lipoprotein receptor; Fgf21 – fibroblast growth factor 21; Ucp1 – uncoupling protein 1; Bmp8b – bone morphogenetic protein 8b. All values are expressed as mean ± SEM. * indicates significant difference from CON at p < 0.05; groups not sharing a common letter are significantly different at p < 0.05.
The 0.25% Met diet was effective in recapitulating many but not all of the transcriptional effects of 0.17% Met. For example, 0.25% and 0.17% Met produced comparable reductions in leptin mRNA and increases in Ucp1 mRNA in IWAT (Fig. 2E). The 0.25% and 0.17% Met diets also increased BAT Ucp1 mRNA comparably. However, the BAT Bmp8b mRNA increase in the 0.25% Met group was significantly less than the increase produced by 0.17% Met (Fig. 2E). In liver, 0.25% Met and 0.17% Met produced concentration-dependent increases in NRF2 and ATF4 target genes (Fig. 2F). In contrast, both diets produced nearly identical reductions in hepatic Scd1 mRNA (Fig. 1E). With insulin sensitivity, both the 0.25% Met and 0.17% Met diets enhanced insulin-dependent glucose clearance (Fig. 2G). Glucose clearance curves showed that the response to the 0.25% Met diet was intermediate between CON and 0.17% Met diets (Fig. 2G inset). Lastly, the Met-restricted diets produced comparable increases in serum FGF21 and decreases in fasting insulin (Fig. 2H). Collectively, this experiment shows that the upper threshold for biological efficacy of Met restriction is 0.25% Met.
Experiments 3 and 4
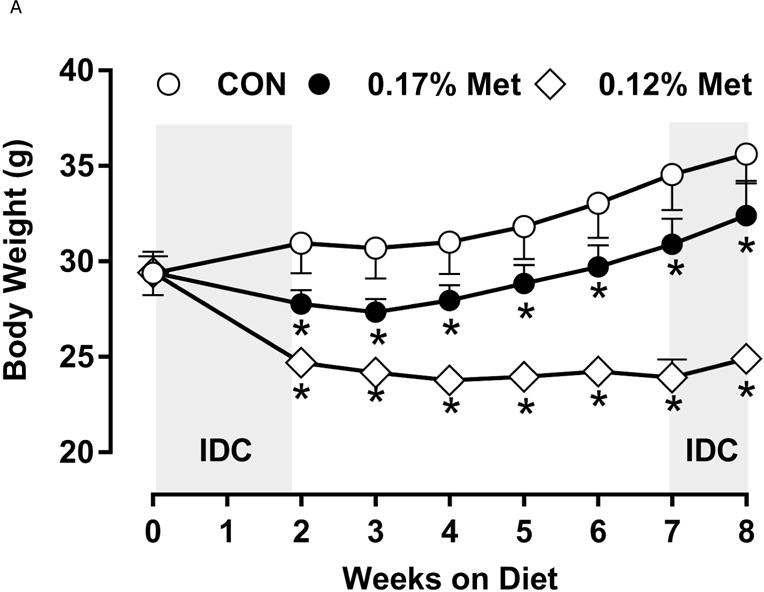
A significant remaining objective was to identify the lower threshold of Met restriction where food aversive/weight loss responses produced by EAA deprivation would be engaged. Based on lifespan extension in mice after restricting Met between 0.12% to 0.15% (10, 11), we ultimately compared the metabolic responses of 0.17% Met and 0.12% Met after initially examining responses to levels below 0.12% in Experiment 3. Experiment 3 used Met concentrations spanning the range 0% to 0.08% and were terminated prematurely at day 8 because of rapid weight loss exceeding 20% of BW resulting from reduced consumption of these diets (data not shown). Therefore, to determine whether restricting Met beyond 0.17% produced more robust biological responses than those produced by 0.17% Met while avoiding responses characteristic of EAA deprivation, a lower threshold of 0.12% Met was tested in Experiment 4. Mice consuming the 0.12% Met diet for 8 weeks weighed significantly less than mice on either the CON or 0.17% Met diets, and the BWs of mice consuming the 0.17% Met diet were intermediate between CON and 0.12% Met (Fig 3A). The key difference was that the 0.12% Met group lost ~4 g of BW over the study while the mice in the 0.17% Met group gained ~3 g (Fig. 3A). Adiposity followed a similar pattern in that the percentage of body fat in mice on the 0.17% Met didn’t change over the study, while adiposity of mice in the 0.12% Met group decreased from 20% to ~16% (Fig. 3B). Adiposity in the CON group increased from 20% to 28% over the same period (Fig. 3B). Interestingly, both food and water intake were increased to same extent in mice on the 0.17% and 0.12% Met diets (Figs. 3D–3E). Together, these findings show that the 0.12% Met diet is no more effective than the 0.17% Met diet in increasing energy intake, but is significantly more effective in producing loss of BW and adiposity. Comparison of lean mass among the three groups reveals an important distinction between the 0.12% Met and 0.17% Met diets in how they affected BW. Fig. 3C shows that lean mass was essentially constant over the 8 week study in the CON and 0.17% Met groups, whereas mice in the 0.12% Met group lost a significant amount of lean (Fig. 3C) and fat mass (Fig. 3B) during the study. Thus, although the 0.12% diet did not evoke food aversive responses (Fig. 3D), their loss of lean mass over time, despite their hyperphagia, suggests that 0.12% Met provides insufficient Met to support growth or even maintenance of BW. Addition of small amounts of cysteine to the diet may spare sufficient Met to prevent this response (see below).
Figure 3. Physiological Data for Experiment 3.
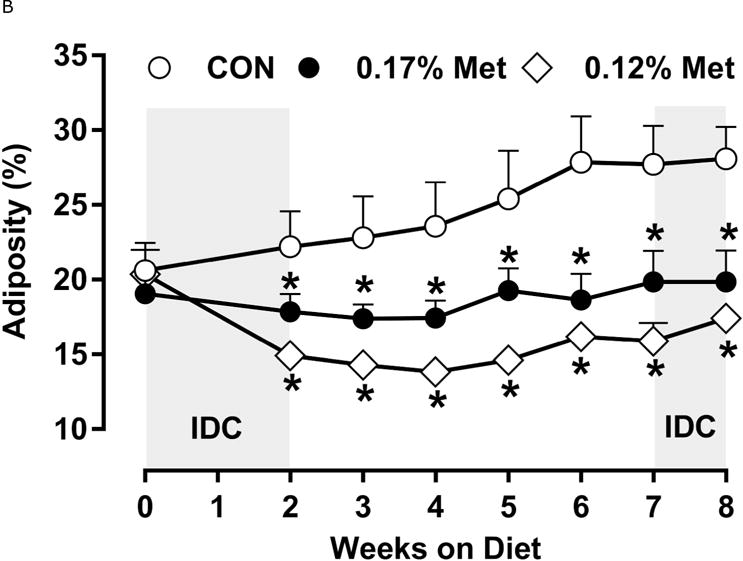
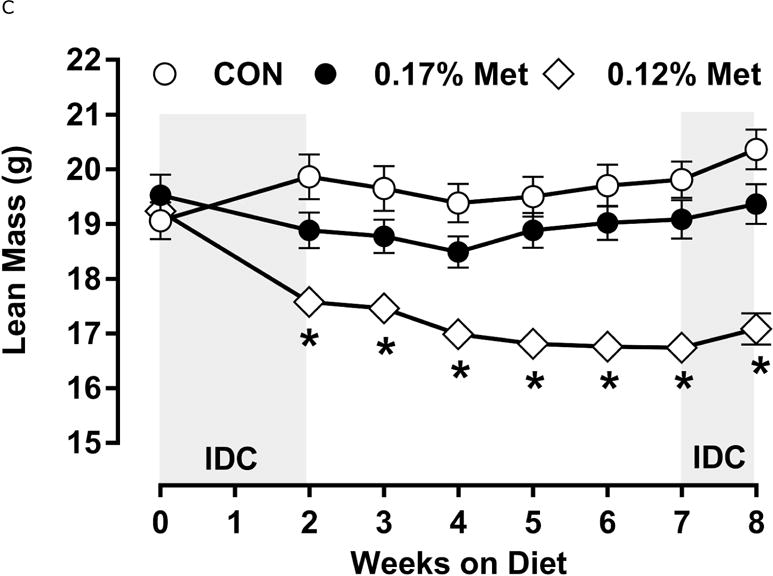
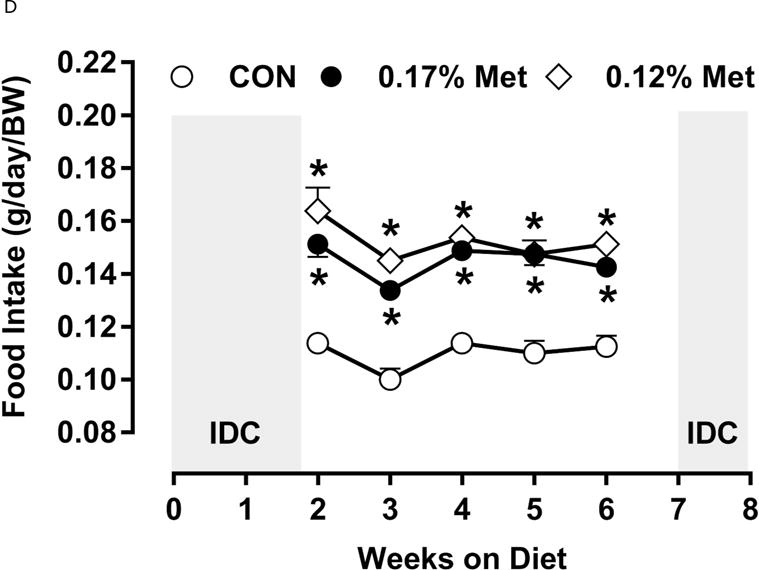
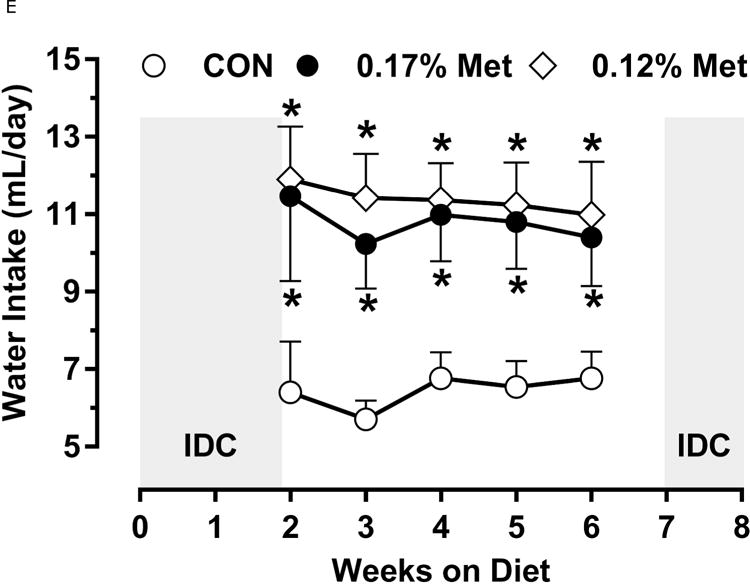
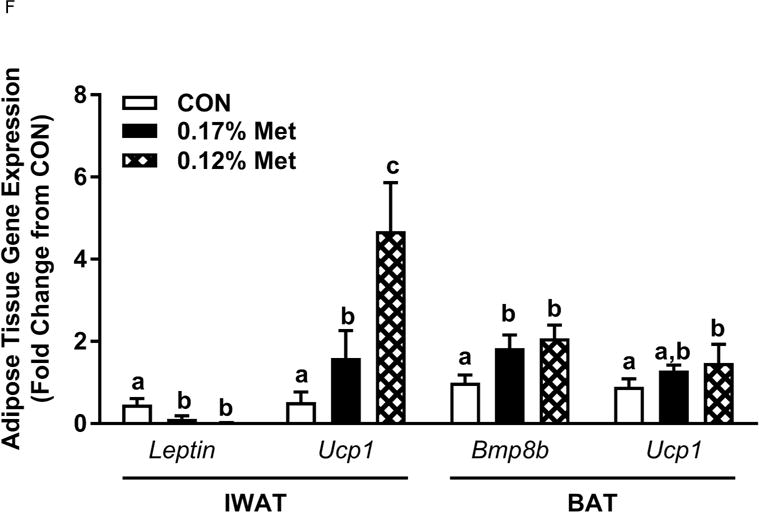
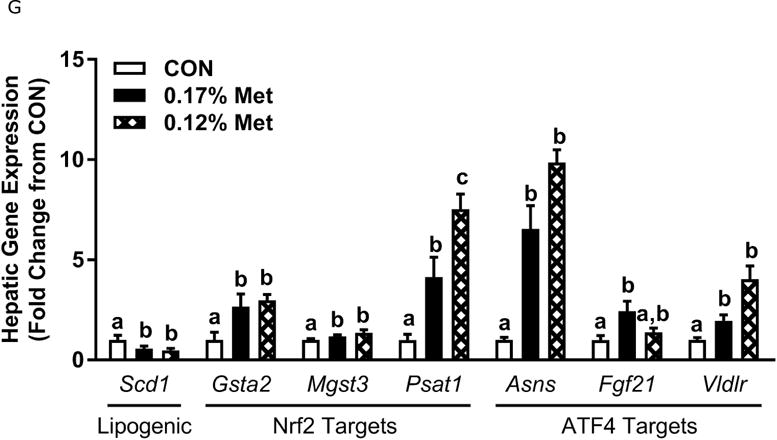
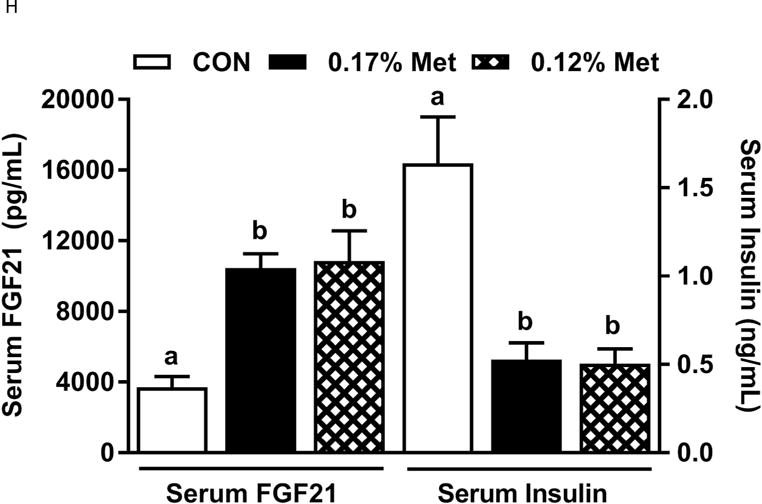
Body weight (A), adiposity (B), lean mass (C), food intake (D), and water intake (E) were measured at weekly intervals over the course of the study. Expression of selected genes in adipose tissue (F) and liver (G) were measured via qPCR and expressed as the fold change of the MR group over the CON group. Serum metabolites FGF21 and insulin (H) were measured via ELISA. CON – control; MR – Met restricted diets; IDC – indirect calorimetry; IWAT – inguinal white adipose tissue; BAT – brown adipose tissue; Scd1 – stearoyl CoA desaturase 1; Nrf2 – Nuclear factor erythroid 2-related factor 2; Gsta2 – Glutathione S-Transferase α2; Mgst3 – Microsomal Glutathione S-Transferase 3; Psat1 – Phosphoserine Aminotransferase 1; ATF4 – Activating Transcription Factor 4Asns – asparagine synthase; Vldlr – very low density lipoprotein receptor; Fgf21 – fibroblast growth factor 21; Ucp1 – uncoupling protein 1; Bmp8b – bone morphogenetic protein 8b. All values are expressed as mean ± SEM. Means annotated with an asterisk differ from CON at p < 0.05. In panels F and G, means not sharing a common letter differ at p < 0.05.
The 0.17% Met and 0.12% Met diets produced comparable decreases in leptin mRNA in IWAT and increases in thermogenic genes in BAT (Fig. 3F). The exception was IWAT Ucp1 mRNA, where the 0.12% Met diet produced a more substantial increase in IWAT Ucp1 mRNA than the 0.17% Met diet (Fig. 3F). In the liver, the two Met-restricted diets produced comparable decreases in Scd1 mRNA, and increases in two of the three NRF2 target genes and ATF4 target genes (Fig. 3G). The lone exception was Psat1, where the 0.12% Met diet produced a slightly larger induction than the 0.17% Met diet (Fig. 3G). Lastly, the 0.12% Met and 0.17% Met diets produced nearly identical increases in serum FGF21 and decreases in fasting insulin (Fig. 3H). Taken together, these data indicate that while 0.12% Met effectively replicates many of the effects of 0.17% Met, it does not further amplify any of the effects except loss of BW, lean mass and adiposity.
Experiments 1, 2 and 4
Energy expenditure (EE) was measured by indirect calorimetry at the end of Experiments 1 and 2, and at the beginning and end of Experiment 4. Figs. 4A, 4B illustrate that daytime and nighttime EE did not differ between mice on the 0.34% Met and CON diets, but were significantly increased in the 0.17% Met group. In Experiment 2, EE in the 0.25% Met group was significantly higher than the CON group and intermediate between CON and 0.17% Met groups (Figs. 4C, 4D). The average 24 hour EE over 2 days in the 0.17% Met group was 26% higher than the CON group while the increase in the 0.25% Met group averaged 15% (Fig. 4D). In Experiment 4, measures of EE after introduction of the 0.12% Met and 0.17% Met diets illustrate that by day 4, nighttime EE in both Met-restricted groups was significantly higher than the CON group (Fig. 4E). Measurements of EE over the subsequent 10 days showed that the diet-induced increases in EE in the 0.12% Met and 0.17% Met groups were comparable during this period (Fig. 4E). Collectively, these findings show that restricting Met to 0.17% produced the most robust increase in EE. Moreover, after 7 weeks on the respective diets, the 0.17% Met diet increased EE by 20%, while the increase in the 0.12% Met group was 14% (Fig. 4F).
Figure 4. Evaluation of Energy Expenditure.
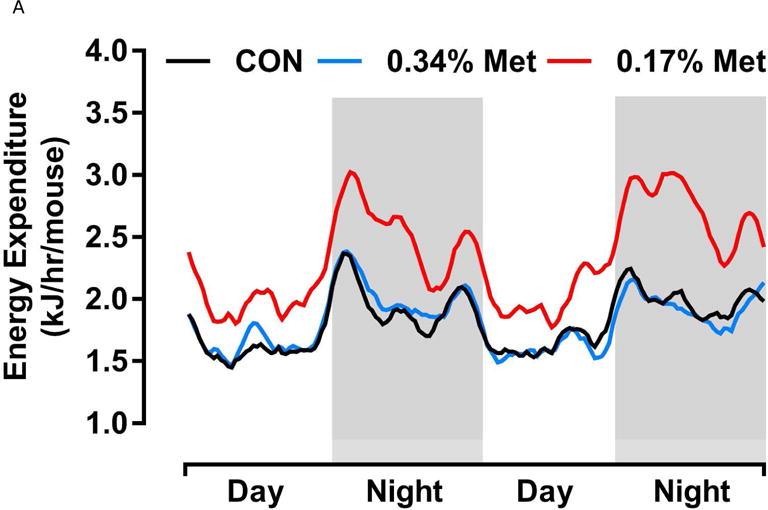
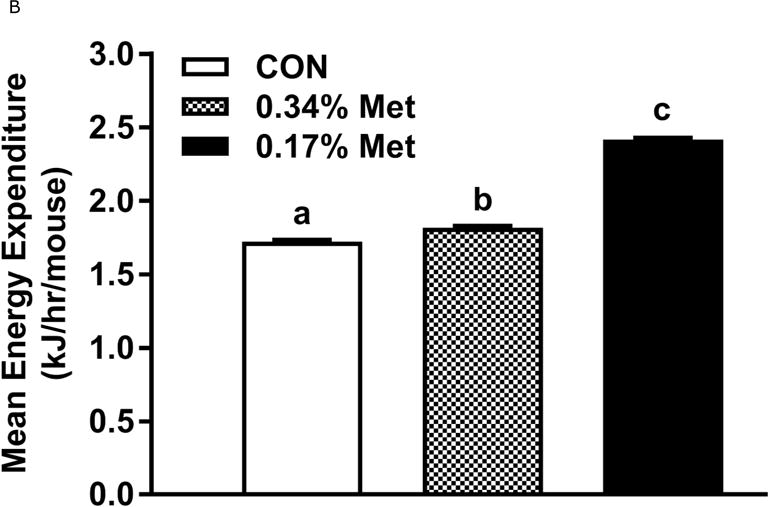
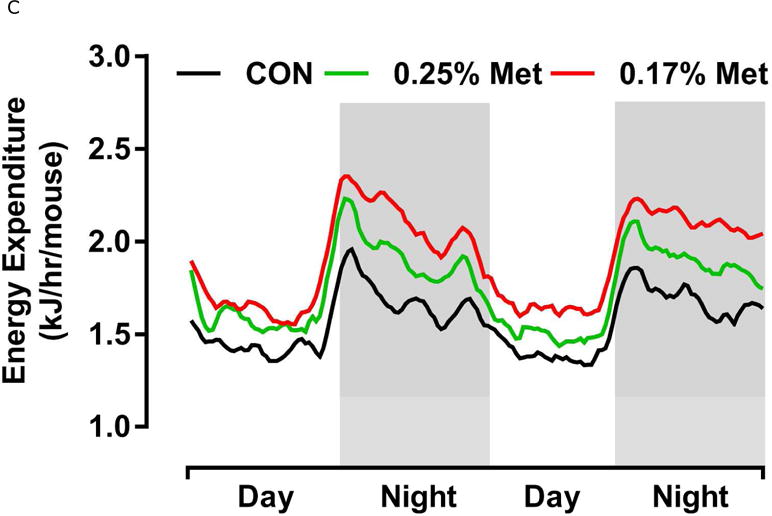
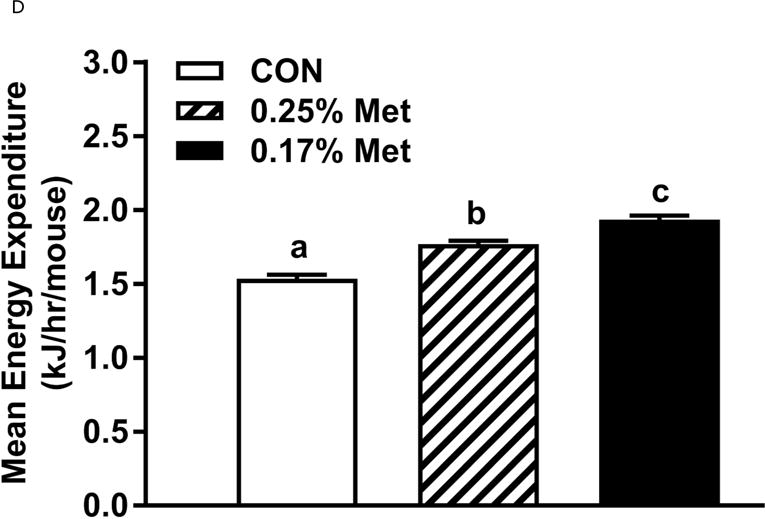
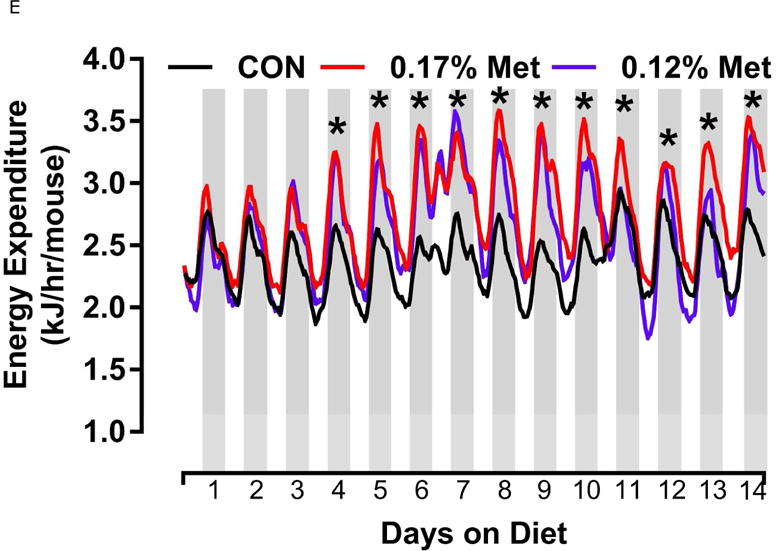
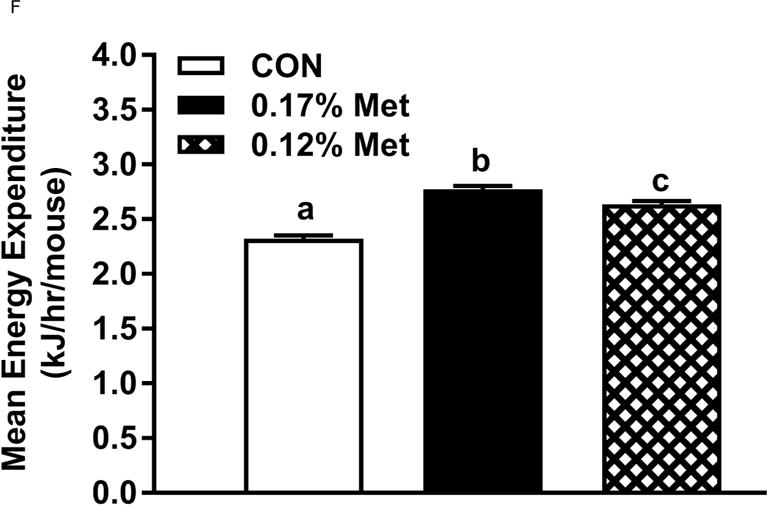
Energy expenditure (EE) was analyzed via indirect calorimetry (IDC). In experiments 1 (A, B) and 2 (C, D), animals were placed in indirect calorimeter chambers for 2 days after consuming either the CON or Met-restricted diets for 8 weeks. In experiment 3 (E, F), 24 mice were equilibrated in the indirect calorimetry chambers for 1 week while consuming the CON diet. On day 0, 8 mice were kept on the CON diet, 8 mice were assigned to the 0.17% Met group, and 8 mice were assigned to the 0.12% Met group. EE was measured in each animal for the following 14 days. Panel 3E shows the average EE of the mice in each group for the first two weeks of the study. EE was measured for 3 days in the 3 groups after 8 weeks on the respective diets and 3F shows the average EE for the 3 dietary groups. Means not sharing a common letter differ at p < 0.05.
Methionine Intake by Dietary Group
Absolute and relative Met intakes were calculated for Experiments 1, 2, and 4 to assess the impact of the compensatory hyperphagia in some groups. Met intake was reduced in all Met-restricted groups compared to CON (Table 2). The reduction in Met intake produced by the 0.34% Met diet was without notable effects, while the Met reductions observed in the 0.25% Met group (Experiment 2), the 0.17% Met group (Experiments 1,2,4), and the 0.12% Met group (Experiment 4) were either partially or fully effective in producing the phenotypic profile (Table 2). Our findings indicate that there is a very precise threshold of reduced Met intake that must be reached for induction of these responses. A range of Met intake of 5–7 mg Met intake/mouse appears to be the ideal range, with intake of Met at 4 mg/mouse being insufficient to maintain lean body mass and BW.
Table 2.
Methionine Intake by Diet
| Experiment 1 | |||
|---|---|---|---|
| CON | 0.34% Met | 0.17% Met | |
| Met Intake (mg/mouse) | 33.3 ± 1.82a | 12.9 ± 0.48b | 8.3 ± 0.59c |
|
| |||
| Met Intake (mg Met/g BW) | 1.38 ± 0.070a | 0.55 ± 0.021b | 0.39 ± 0.025c |
|
| |||
| Experiment 2 | |||
| CON | 0.25% Met | 0.17% Met | |
|
| |||
| Met Intake (mg/mouse) | 22.5 ± 0.51a | 7.4 ± 0.13b | 5.2 ± 0.14c |
|
| |||
| Met Intake (mg Met/g BW) | 1.14 ± 0.023a | 0.38 ± 0.003b | 0.28 ± 0.005c |
|
| |||
| Experiment 4 | |||
| CON | 0.17% Met | 0.12% Met | |
|
| |||
| Met Intake (mg/mouse) | 29.5 ± 0.61a | 6.94 ± 0.17b | 4.44 ± 0.19c |
|
| |||
| Met Intake (mg Met/g BW) | 0.95 ± 0.28a | 0.25 ± 0.004b | 0.18 ± 0.005c |
Average Met intake per mouse for Experiments 1, 2, and 4, expressed as absolute Met intake and corrected for body weight. Values are expressed as mean ± SEM. Groups not sharing a common letter within experiment are significantly different at p < 0.05.
Discussion
Dietary Met restriction produces a coordinated series of biochemical and physiological responses that improve biomarkers of metabolic health, limit fat accumulation, reduce tissue and circulating lipid levels, remodel WAT, and enhance overall insulin sensitivity in rats and mice (4, 7, 9, 19, 20). Individual components of the phenotype become evident soon after initiation of Met restriction. As part of an overarching goal to develop therapeutic diets to treat metabolic disease in domestic animals and humans, the goal of the present work is to identify the range of dietary Met concentrations on either side of 0.17% that reproduce these beneficial effects.
The goal of our initial experiments was to identify the upper threshold of Met restriction that reproduced some or all of the effects of 0.17% Met. Preliminary studies showed that restriction of Met by up to 50% from CON Met levels had no discernible effect on any component of the metabolic phenotype. These findings suggested the threshold was much closer to 0.17% Met so our initial experiment tested the efficacy of 0.34% Met, a doubling of the amount of Met in the 0.17% diet. The findings of Experiment 1 showed that the responses to 0.34% Met did not differ from the CON group (Fig. 1). In Experiment 2, we reduced the amount of Met to 0.25% and found that this concentration, depending on endpoint, was either partially or fully effective in reproducing each component of the phenotype observed with 0.17% Met (Fig. 2). Although the reduction in BW produced by 0.25% Met compared to the CON group was not significant, the reduction in adiposity produced by this diet was comparable to that produced by 0.17% Met (Fig. 2B). The apparent dichotomy of this finding is explained by the intermediate effect of 0.25% Met on energy intake and EE relative to 0.17% Met. Transcriptional responses to 0.25% Met in liver and adipose tissue were indicative of intermediate efficacy in that this degree of Met restriction either partially or fully reproduced the changes in gene expression produced by 0.17% Met. Comparable decreases in fasting insulin and improvements in glucose tolerance support the view that these improvements in metabolic status are not secondary to effects of 0.25% Met’s effect on growth. Viewed together, the findings from Experiment 2 make a compelling case that diets formulated to provide a range of Met between 0.17% and 0.25% would be effective in producing the desired metabolic effects without untoward effects on BW.
Our second objective was to identify the lower threshold of Met restriction that retained the metabolic effects of 0.17% while avoiding the detrimental effects of EAA deprivation on BW and lean mass. The findings from Experiment 3 with Met concentrations below 0.1% were not reported because all concentrations caused food aversion, rapid weight loss, and had to be stopped by day 8 because of excessive weight loss. In Experiment 4, we chose to evaluate the efficacy of 0.12% Met compared to 0.17% Met to test whether 0.12% Met would producemore robust metabolic responses. The 0.12% Met produced no greater increase in food intake than 0.17% Met and no greater increase in EE, but a far greater loss of BW and lean mass, and a slightly greater loss of adiposity. The biochemical and molecular responses between these two diets were comparable, supporting the interpretation that 0.12% Met did not produce more robust transcriptional responses than 0.17% Met. In contrast, we interpret the greater loss of BW and leanness produced by 0.12% Met as a failure to provide sufficient Met to support protein synthesis and growth. The 0.17% Met diet may also limit growth to some extent in young growing animals whereas the 0.25% Met diet produced minimal limitation of growth.
A previously unexplored area of dietary Met restriction is the degree to which hyperphagia in Met-restricted groups compensates for reduced dietary Met content. Both absolute Met intake per mouse and body weight-adjusted Met intake are presented in Table 2. The mice on all Met-restricted diets consumed significantly less Met when compared to the CON group. However, as the phenotype produced by the 0.34% Met diet did not differ from CON, the present works suggests that the effective range is 4 to 7 mg Met/mouse/day.
Considered together, the present findings make a compelling case that limiting Met to a range of 0.17% to 0.25% is most effective in increasing EE, limiting fat deposition, reducing de novo synthesis of hepatic triglyceride, and improving insulin sensitivity, while diets providing only 0.12% Met would be no more effective than 0.17% in improving these metabolic biomarkers but would include negative effects on BW and lean mass. Achieving the desirable range of 0.17% to 0.25% Met with natural sources of protein would also require consideration of their cysteine content, because as shown previously (22), addition of small amounts of cysteine (e.g., 0.2%) to the Met restricted diet fully reversed essentially all metabolic effects of Met restriction. Given the Met-sparing effect of dietary cysteine (1, 2) and the narrow range of concentrations where Met restriction is effective, it seems likely that even small amounts of dietary cysteine would counteract the effects of 0.25% Met. Perhaps with 0.17% Met, a small amount of cysteine (e.g., 0.05%) would not be counterproductive. It also seems likely that the negative effects of the 0.12% Met diet on BW and lean body mass could be counteracted by small amounts of cysteine without negating the positive metabolic effects. It will be important in future studies to carefully examine how much cysteine each degree of Met restriction will tolerate while still retaining their positive metabolic effects. This information will be critical to developing effective therapeutic diets based on Met restriction.
What is already known about this subject?
Restriction of dietary methionine to 0.17% reduces adiposity, enhances browning of white adipose tissue, increases energy expenditure, decreases hepatic lipogenic genes and improves insulin sensitivity.
Upper and lower concentrations of dietary methionine that recapitulate the beneficial responses produced by 0.17% methionine have not been established.
The concentrations of dietary methionine restriction where the responses of essential amino deprivation begin have not been identified.
What does your study add?
A range of dietary methionine spanning 0.12% to 0.25% was effective in producing the previously documented metabolic phenotype produced by restriction of methionine to 0.17%.
Restriction of methionine to levels above 0.25% was without effect while restriction to 0.12% had negative effects on body weight and composition, but did not induce food aversion that is seen with essential amino acid deprivation.
Dietary levels of methionine below 0.10% produced responses characteristic of essential amino acid deprivation.
Acknowledgments
The authors thank Nancy Van, Kelly Dille, and Mollye Baker for assistance with animal husbandry, tissue processing, and analyzing transcriptional responses.
This work was supported in part by ADA 1-12-BS-58 (TWG) and NIH DK-096311 (TWG). This work also made use of the Genomics Core Facility supported by NIH P20-GM103528 (TWG) and NIH 2P30 DK072476. This research project used the Transgenic and Animal Phenotyping core facilities that are supported in part by the NORC (NIH 2P30 DK072476) center grant from the NIH. DW was supported by NIH NRSA 1 F32 DK098918 and LAF was supported by an ADA mentor-based postdoctoral fellowship award (ADA 7-13-MI-05).
Abbreviations
- Asns
Asparagine Synthetase
- ATF4
Activating Transcription Factor 4
- BAT
Brown adipose tissue
- Bmp8b
Bone Morphogenic Protein 8b
- BW
Body weight
- CON
Control Diet
- EAA
Essential amino acids
- EE
Energy expenditure
- FGF21
Fibroblast growth factor 21
- Gsta2
Glutathione S-Transferase Alpha 2
- IDC
Indirect calorimetry
- ITT
Insulin tolerance test
- IWAT
Inguinal white adipose tissue
- Met
Methionine
- Mgst3
Microsomal Glutathione S-Transferase 3
- NMR
Nuclear magnetic resonance
- NRF2
Nuclear Factor Erythroid 2–Related Factor 2
- Psat1
Phosphoserine Aminotransferase 1
- RER
Respiratory exchange ratio
- Scd1
Stearoyl CoA Desaturase-1
- Ucp1
Uncoupling Protein-1
- Vldlr
Very Low Density Lipoprotein Receptor
Footnotes
Disclosure: The authors have no conflicts of interest to disclose.
Contributions
LAF, DW, KPS, and TWG contributed to the writing and editing of the manuscript; DW, KPS, AP, and LAF conducted animal experiments and associated mRNA and metabolite measurements; LAF analyzed the data and produced illustrations.
Reference List
- 1.Finkelstein JD, Martin JJ, Harris BJ. Methionine metabolism in mammals. The methionine-sparing effect of cystine. J Biol Chem. 1988;263(24):11750–4. [PubMed] [Google Scholar]
- 2.Martinov MV, Vitvitsky VM, Banerjee R, Ataullakhanov FI. The logic of the hepatic methionine metabolic cycle. Biochim Biophys Acta. 2010;1804(1):89–96. doi: 10.1016/j.bbapap.2009.10.004. [DOI] [PMC free article] [PubMed] [Google Scholar]
- 3.Orentreich N, Matias JR, DeFelice A, Zimmerman JA. Low methionine ingestion by rats extends life span. J Nutr. 1993;123(2):269–74. doi: 10.1093/jn/123.2.269. [DOI] [PubMed] [Google Scholar]
- 4.Malloy VL, Krajcik RA, Bailey SJ, Hristopoulos G, Plummer JD, Orentreich N. Methionine restriction decreases visceral fat mass and preserves insulin action in aging male Fischer 344 rats independent of energy restriction. Aging Cell. 2006;5(4):305–14. doi: 10.1111/j.1474-9726.2006.00220.x. [DOI] [PubMed] [Google Scholar]
- 5.Richie JP, Jr, Leutzinger Y, Parthasarathy S, Malloy V, Orentreich N, Zimmerman JA. Methionine restriction increases blood glutathione and longevity in F344 rats. FASEB J. 1994;8(15):1302–7. doi: 10.1096/fasebj.8.15.8001743. [DOI] [PubMed] [Google Scholar]
- 6.Zimmerman JA, Malloy V, Krajcik R, Orentreich N. Nutritional control of aging. Exp Gerontol. 2003;38(1–2):47–52. doi: 10.1016/s0531-5565(02)00149-3. [DOI] [PubMed] [Google Scholar]
- 7.Hasek BE, Stewart LK, Henagan TM, et al. Dietary methionine restriction enhances metabolic flexibility and increases uncoupled respiration in both fed and fasted states. Am J Physiol Regul Integr Comp Physiol. 2010;299:R728–R739. doi: 10.1152/ajpregu.00837.2009. [DOI] [PMC free article] [PubMed] [Google Scholar]
- 8.Perrone CE, Mattocks DA, Hristopoulos G, Plummer JD, Krajcik RA, Orentreich N. Methionine restriction effects on 11β-HSD1 activity and lipogenic/lipolytic balance in F344 rat adipose tissue. J Lipid Res. 2008;49(1):12–23. doi: 10.1194/jlr.M700194-JLR200. [DOI] [PubMed] [Google Scholar]
- 9.Plaisance EP, Henagan TM, Echlin H, et al. Role of ß-adrenergic receptors in the hyperphagic and hypermetabolic responses to dietary methionine restriction. Am J Physiol Regul Integr Comp Physiol. 2010;299:R740–R750. doi: 10.1152/ajpregu.00838.2009. [DOI] [PMC free article] [PubMed] [Google Scholar]
- 10.Sun L, Sadighi Akha AA, Miller RA, Harper JM. Life-span extension in mice by preweaning food restriction and by methionine restriction in middle age. J Gerontol A Biol Sci Med Sci. 2009;64(7):711–22. doi: 10.1093/gerona/glp051. [DOI] [PMC free article] [PubMed] [Google Scholar]
- 11.Miller RA, Buehner G, Chang Y, Harper JM, Sigler R, Smith-Wheelock M. Methionine-deficient diet extends mouse lifespan, slows immune and lens aging, alters glucose, T4, IGF-I and insulin levels, and increases hepatocyte MIF levels and stress resistance. Aging Cell. 2005;4(3):119–25. doi: 10.1111/j.1474-9726.2005.00152.x. [DOI] [PMC free article] [PubMed] [Google Scholar]
- 12.Malloy VL, Perrone CE, Mattocks DA, et al. Methionine restriction prevents the progression of hepatic steatosis in leptin-deficient obese mice. Metabolism. 2013;62(11):1651–61. doi: 10.1016/j.metabol.2013.06.012. [DOI] [PubMed] [Google Scholar]
- 13.Maurin AC, Jousse C, Averous J, et al. The GCN2 kinase biases feeding behavior to maintain amino acid homeostasis in omnivores. Cell Metab. 2005;1(4):273–7. doi: 10.1016/j.cmet.2005.03.004. [DOI] [PubMed] [Google Scholar]
- 14.Hao S, Sharp JW, Ross-Inta CM, et al. Uncharged tRNA and sensing of amino acid deficiency in mammalian piriform cortex. Science. 2005;307(5716):1776–8. doi: 10.1126/science.1104882. [DOI] [PubMed] [Google Scholar]
- 15.Guo F, Cavener DR. The GCN2 eIF2alpha kinase regulates fatty-acid homeostasis in the liver during deprivation of an essential amino acid. Cell Metab. 2007;5(2):103–14. doi: 10.1016/j.cmet.2007.01.001. [DOI] [PubMed] [Google Scholar]
- 16.Anthony TG, McDaniel BJ, Byerley RL, et al. Preservation of liver protein synthesis during dietary leucine deprivation occurs at the expense of skeletal muscle mass in mice deleted for eIF2 kinase GCN2. J Biol Chem. 2004;279(35):36553–61. doi: 10.1074/jbc.M404559200. [DOI] [PubMed] [Google Scholar]
- 17.Cheng Y, Zhang Q, Meng Q, et al. Leucine deprivation stimulates fat loss via increasing CRH expression in the hypothalamus and activating sympathetic nervous system. Mol Endocrinol. 2011;25(9):1624–35. doi: 10.1210/me.2011-0028. [DOI] [PMC free article] [PubMed] [Google Scholar]
- 18.Cheng Y, Meng Q, Wang C, et al. Leucine deprivation decreases fat mass by stimulation of lipolysis in white adipose tissue and upregulation of uncoupling protein 1 (UCP1) in brown adipose tissue. Diabetes. 2010;59(1):17–25. doi: 10.2337/db09-0929. [DOI] [PMC free article] [PubMed] [Google Scholar]
- 19.Hasek BE, Boudreau A, Shin J, et al. Remodeling the integration of lipid metabolism between liver and adipose tissue by dietary methionine restriction in rats. Diabetes. 2013;62:3362–72. doi: 10.2337/db13-0501. [DOI] [PMC free article] [PubMed] [Google Scholar]
- 20.Stone KP, Wanders D, Orgeron M, Cortez CC, Gettys TW. Mechanisms of increased in vivo insulin sensitivity by dietary methionine restriction in mice. Diabetes. 2014;63:3721–33. doi: 10.2337/db14-0464. [DOI] [PMC free article] [PubMed] [Google Scholar]
- 21.Wanders D, Burk DH, Cortez CC, et al. UCP1 is an essential mediator of the effects of methionine restrictin on energy balance but not insulin sensitivity. FASEB Journal. 2015;29:2603–15. doi: 10.1096/fj.14-270348. (June 2015) [DOI] [PMC free article] [PubMed] [Google Scholar]
- 22.Wanders D, Stone KP, Forney LA, et al. Role of GCN2-independent signaling through a non-canonical PERK/NRF2 pathway in the physiological responses to dietary methionine restriction. Diabetes. 2016;65(6):1499–510. doi: 10.2337/db15-1324. [DOI] [PMC free article] [PubMed] [Google Scholar]
- 23.Stone KP, Wanders D, Calderon LF, Spurgin SB, Scherer PE, Gettys TW. Compromised responses to dietary methionine restriction in adipose tissue but not liver of ob/ob mice. Obesity. 2015;23(9):1836–44. doi: 10.1002/oby.21177. [DOI] [PMC free article] [PubMed] [Google Scholar]


