

Abstract
Context
Identification of cancer patients with similar symptom profiles may facilitate targeted symptom management.
Objectives
To identify subgroups of breast cancer survivors based on differential experience of symptoms, examine change in subgroup membership over time, and identify relevant characteristics and quality of life (QOL) among subgroups.
Methods
Secondary analyses of data from 653 breast cancer survivors recruited within 8 months of diagnosis who completed questionnaires at five timepoints. Hidden Markov modeling was used to: 1) formulate symptom profiles based on prevalence and severity of eight symptoms commonly associated with breast cancer, and 2) estimate probabilities of changing subgroup membership over 18 months of follow-up. Ordinal repeated measures were used to: 3) identify patient characteristics related to subgroup membership, and 4) evaluate the relationship between symptom subgroup and QOL.
Results
A seven-subgroup model provided the best fit: 1) low symptom burden, 2) mild fatigue, 3) mild fatigue and mild pain, 4) moderate fatigue and moderate pain, 5) moderate fatigue and moderate psychological, 6) moderate fatigue, mild pain, mild psychological; and 7) high symptom burden. Seventy percent of survivors remained in the same subgroup over time. In multivariable analyses, chemotherapy and greater illness intrusiveness were significantly related to greater symptom burden, while not being married or partnered, no difficulty paying for basics, and greater social support were protective. Higher symptom burden was associated with lower QOL. Survivors who reported psychological symptoms had significantly lower QOL than did survivors with pain symptoms.
Conclusion
Cancer survivors can be differentiated by their symptom profiles.
Keywords: breast cancer, hidden Markov model, symptoms, quality of life, longitudinal
Introduction
Breast cancer patients commonly experience symptoms such as pain, depression, and fatigue as a consequence of their cancer or treatment, and these symptoms may persist, or develop, even after treatment ends.1 However, clinical and research evidence suggests individual variability in the symptoms patients experience.2-4 Additionally, although cancer patients frequently experience multiple co-occurring symptoms, these symptoms have traditionally been studied and treated in isolation.5
The study of multiple symptoms has become an area of active investigation and has diverged along two conceptually different lines. The first approach examines the clustering of symptoms to determine which symptoms cluster together.5,6 A second approach examines how patients reporting similar symptoms group together to form patient subgroups based on their specific symptom cluster.5 Patients may differ in terms of symptom severity and/or type of symptom. This approach focuses on individual variation among patients to determine if subgroups differ on clinical outcomes. The present study focuses on this second approach.
Latent class analysis (LCA) and cluster analysis (CA) are methods exemplifying this second approach2-4,9-12 and typically focus on symptom severity.4,9,10,12 Although these approaches can be useful for identifying patients with high symptom burden, they do not provide information on patients experiencing qualitatively different symptom profiles. Few researchers have studied the combination of symptom severity and symptom type.2-4
LCA, CA,6 path analysis,13 and cross-sectional comparisons of patient clusters at each timepoint14 have been used with longitudinal data. However, none of these methods provides insight into symptom subgroup transition. Patient transition from one symptom subgroup to another is particularly relevant for understanding the impact of beginning or ending treatment and/or response to an intervention. The application of methods suitable for longitudinal analysis of symptoms has appeared only recently in the literature. The hidden Markov model (HMM) is a longitudinal extension of latent class analysis that avoids separately analyzing repeatedly measured data by timepoint and is able to derive an entire trajectory of subgroup membership for each individual.15,16
The present study takes advantage of HMM analysis to examine symptom evolution based on previously identified important symptoms for cancer patients.1 The present analysis had four objectives. We used HMM to: 1) identify subgroups of breast cancer patients based on their symptom profiles, and 2) estimate the probability of an individual patient changing subgroup membership over 18 months. We further 3) examined sociodemographic factors, disease and treatment characteristics, and psychosocial factors for their association with subgroup membership in bivariate and multivariate analyses. Finally, we 4) evaluated the association between subgroup membership and quality of life (QOL).
Methods
Study Sample
This was a secondary analysis of a longitudinal study of age-related differences in adjustment to breast cancer.17 Details on study recruitment and eligibility are reported elsewhere. All sites obtained approval from their Institutional Review Boards. Data were collected at 5 timepoints: the first survey (administered within 8 months of breast cancer diagnosis), and 3, 6, 12, and 18 months following completion of the first survey. The self-administered questionnaire included questions on symptoms, sociodemographics, QOL, and psychosocial factors. A medical chart review was performed 1 year after the first survey to obtain treatment-related data.
Measures
Symptoms
Study participants completed a 39-item symptom checklist based on the Women's Health Initiative study18 and adapted from the Breast Cancer Prevention Trial Symptom Scale.19 For all symptoms, participants were first asked whether or not it occurred during the past month. If the symptom did occur, participants were asked if the symptom was mild (did not interfere with usual activities), moderate (interfered somewhat with usual activities), or severe (so bothersome that usual activities could not be performed). For the purpose of these analyses, we selected six symptoms common among cancer survivors and typically studied as part of a symptom cluster: fatigue or low energy level, restless sleep, general aches and pains, joint pains, feeling depressed, and difficulty concentrating.1
Quality of Life
The Functional Assessment of Cancer Therapy – Breast (FACT-B) was used to measure cancer-related QOL.20 The FACT-B consists of the FACT General (FACT-G) subscale (26 items) and the Breast-Specific Concerns (BSC) subscale (9 items). Items are based on a 5-point Likert scale and refer to the past 7 days. Items are summed, and higher scores reflect better QOL.
The following variables, some of which were time-varying, were evaluated for their association with symptom subgroups. Sociodemographic variables, all time-invariant, included age at diagnosis, race (White vs non-White), ability to pay for basics (very or somewhat hard versus not at all hard), educational level (high school or less versus more than high school) and marital/partner status. Cancer-related variables obtained from the medical chart included cancer stage (I, II, or II) as defined at diagnosis based on tumor size, lymph node status, and metastases,21 and two time-varying treatment variables: chemotherapy status (yes/no at given time point), and radiation (yes/no at given time point). Psychosocial factors included two measures that were both time-varying. The Illness Intrusiveness Ratings Scale assesses the degree to which breast cancer diagnosis and treatment affect 13 life areas: health, diet, paid work, active recreation, passive recreation, financial situation, relationship with spouse, sex life, family relations, other social relations, self-expression, religious expression, and community.22 Total scores range from 16–112, with higher scores indicating greater intrusiveness (coefficient α = 0.93). Social support was assessed by the RAND Social Support Scale,23 which contains 19 items measuring four aspects of support: emotional support, tangible support, affection, and social interaction. Mean score ranges from 1–5 (coefficient α = 0.97) with higher values indicating greater social support.
Statistical Analysis
To address our first objective, the HMM was used to delineate different symptom subgroups.15,24,25 Like LCA, the HMM uses multiple variables (in this case, symptoms) to form a symptom profile and determine the appropriate number of subgroups, K, for capturing both intraindividual and interindividual variation. The Bayesian Information Criterion (BIC) was used to determine K. Models with a range of K were tested and as recommended, the model with the lowest value of BIC value was selected.26 The HMM assumes that over the course of a study, people may change subgroup membership. The Markov assumption asserts that the likelihood of a person's transition to another subgroup or remaining within the same subgroup depends only on the subgroup membership at that specific timepoint. For the second objective of estimating probabilities of transitioning from one symptom subgroup to another, we used the HMM to derive summaries regarding the trajectories of the individuals in the different subgroups.
To address our third objective of examining the association between patient characteristics and symptom subgroup, we used descriptive statistics to evaluate the symptom subgroups at baseline in relation to the time-invariant characteristics and baseline levels of the time-varying characteristics. We also analyzed the association between symptom subgroup membership and the same patient characteristics evaluated simultaneously in a multivariable repeated-measures (longitudinal) model, with the above-described time-varying variables (chemotherapy status, radiation status, illness intrusiveness, and social support) included with the time-invariant variables (age, race, education, partner status, difficulty in paying for basics). An ordinal logistic repeated measures model with a first-order autoregressive correlation structure, which is consistent with the Markov assumption, was used to identify significant time-invariant and time-varying factors associated with symptom subgroup membership.
Finally, to address the fourth objective, we examined the longitudinal relationship between symptom subgroup and QOL, with symptom subgroup now becoming the primary independent variable of interest, and FACT-B score the dependent variable. The set of time-invariant and time-varying covariates included in this repeated measures model was the same as that used above for objective 3.
In multivariable analyses for the third and fourth objectives,, missing data were treated using the missing-at-random (MAR) principle. We used 2-sided statistical tests and 0.05 as the level of significance.
Results
Sample Characteristics
Out of 740 surveys mailed to women deemed eligible from chart reviews or telephone screening, 653 women completed baseline surveys and were determined eligible, for an initial response rate of 88%. A total of 565 women remained in the study by the final survey, for a retention rate of 86.5%. Completion of all parts of the survey questionnaires by women who responded to the survey was high: for instance, at baseline, 12 months, and 18 months, all respondents filled out the symptoms checklist. At 6 months, only one woman skipped this checklist.
Table 1, column 1 shows the characteristics of the total sample at baseline. The average age of the sample was 54.9 years. The majority (89.6%) was white, and most (87.4%) attained education beyond high school; 71.7% were married or partnered. Most of the sample had stage I (51.8%) or stage II (40.1%) breast cancer, and 36.3% had undergone mastectomy. Almost half of the women were actively receiving chemotherapy when the baseline survey was administered (46.6%); only 8.1% were actively receiving radiation therapy at that time.
Table 1. Sample Characteristics by Baseline Subgroup.
| Characteristic | Total sample | 1 Low Symptom Burden | 2 Mild Fatigue | 3 Mild Fatigue & Mild Pain | 4 Moderate Fatigue & Moderate Pain | 5 Moderate Fatigue & Moderate Psych | 6 Moderate Fatigue, Mild Pain & Psych | 7 High Symptom Burden | Overall p-value |
|---|---|---|---|---|---|---|---|---|---|
| n = 653 | n = 82 | n = 161 | n = 50 | n = 49 | n = 87 | n = 120 | n = 104 | ||
| Age, years; mean (SD) | 54.9 (12.6) | 62.7 (11.3) | 53.8 (11.3) | 62.8 (12.8) | 58.5 (14.3) | 50.3 (11.6) | 53.8 (12.4) | 50.4 (10.8) | <0.001 |
| Race (%) | 0.097 | ||||||||
| White | 89.6 | 92.7 | 91.3 | 94.0 | 83.7 | 88.5 | 92.5 | 82.7 | |
| Non-white | 10.4 | 7.3 | 8.7 | 6.0 | 16.3 | 11.5 | 7.5 | 17.3 | |
| Education (%) | 0.19 | ||||||||
| High school or less | 12.6 | 11.0 | 9.3 | 18.0 | 22.5 | 9.2 | 12.5 | 14.4 | |
| > High school | 87.4 | 89.0 | 90.7 | 82.0 | 77.6 | 90.8 | 87.5 | 85.6 | |
| Partner status (%) | 0.526 | ||||||||
| Married/partnered | 71.7 | 65.9 | 69.6 | 74.0 | 75.5 | 71.3 | 78.3 | 69.2 | |
| Not partnered | 28.3 | 34.2 | 30.4 | 26.0 | 24.5 | 28.7 | 21.7 | 33.7 | |
| Difficulty paying for basics (%) | <0.001 | ||||||||
| Yes | 18.5 | 8.5 | 10.6 | 18.0 | 14.3 | 28.7 | 17.5 | 33.7 | |
| No | 81.5 | 91.5 | 89.4 | 82.0 | 85.7 | 71.3 | 82.5 | 66.4 | |
| Cancer stage (%) | <0.001 | ||||||||
| Stage I | 51.8 | 73.2 | 59.0 | 50.0 | 55.1 | 56.3 | 50.0 | 21.2 | |
| Stage II | 40.1 | 19.5 | 32.3 | 42.0 | 36.7 | 37.9 | 43.3 | 67.3 | |
| Stage III | 8.1 | 7.3 | 8.7 | 8.0 | 8.2 | 5.8 | 6.7 | 11.5 | |
| Chemotherapy (%) | <0.001 | ||||||||
| Yes (active treatment) | 46.6 | 22.0 | 46.0 | 32.0 | 34.7 | 50.6 | 55.8 | 65.4 | |
| Yes (post treatment) | 13.2 | 7.3 | 14.3 | 16.0 | 16.3 | 9.2 | 14.2 | 15.4 | |
| No | 40.3 | 70.7 | 39.8 | 52.0 | 49.0 | 40.2 | 30.0 | 19.2 | |
| Radiation (%) | 0.17 | ||||||||
| Yes (active treatment) | 8.1 | 15.9 | 7.5 | 10.0 | 4.1 | 8.1 | 6.7 | 5.8 | |
| Yes (post treatment) | 17.0 | 32.9 | 14.9 | 28.0 | 22.5 | 13.8 | 13.3 | 6.7 | |
| No | 74.9 | 51.2 | 77.6 | 62.0 | 73.5 | 78.2 | 80.0 | 87.5 | |
| Mastectomy (%) | 36.3 | 15.9 | 42.2 | 26.0 | 26.5 | 32.2 | 39.2 | 52.9 | <0.001 |
| Illness intrusiveness, mean (SD) | 34.7 (16.9) | 18.3 (8.1) | 28.9 (13.2) | 25.5 (10.4) | 31.1 (14.5) | 43.2 (15.9) | 39.6 (15.2) | 49.6 (14.8) | <0.001 |
| Social support, mean (SD) | 4.3 (0.7) | 4.5 (0.6) | 4.4 (0.6) | 4.3 (0.7) | 4.3 (0.7) | 4.2 (0.7) | 4.3 (0.7) | 4.0 (0.8) | <0.001 |
Objective 1: Results from the HMM Analysis
A seven-subgroup model was identified as the best-fitting model using the BIC criterion. These results take into account both the probability of reporting a symptom (total bar) and whether the symptom was mild (green bar) or moderate/severe (red bar) (Figure 1). Subgroup 1 (low symptom burden) includes individuals with a low probability of endorsing any symptom. Subgroup 2 (mild fatigue) consists of women who reported mostly mild fatigue and restless sleep. Subgroup 3 (mild fatigue and mild pain) includes patients reporting mild fatigue and mild pain, but not the psychological symptoms. Subgroup 4 (moderate fatigue and moderate pain) is similar to Subgroup 3, but the symptoms were more severe. Subgroup 5 (moderate fatigue and moderate psychological) consists of women who reported fatigue and psychological symptoms, but not pain. Subgroup 6 (moderate fatigue and mild pain and mild psychological) is similar to Subgroup 2, but all symptoms had a higher prevalence and fatigue was more severe. Survivors in Subgroup 7 (high symptom burden) reported a high number of symptoms that all tended to be moderate to severe in nature. In general, fatigue was the most frequently reported symptom and was found to some degree in all subgroups. Pain was reported in five subgroups and was moderate to severe in two of them. Psychological symptoms were reported in four subgroups and were severe in two of them.
Figure. 1.
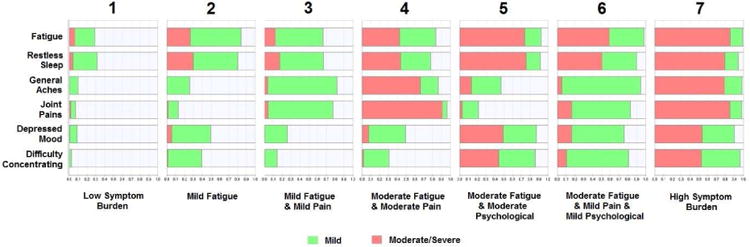
Symptom profiles for the seven patient subgroups. The green bar represents probability of reporting the symptom as mild. The red bar represents probability of reporting the symptom as moderate to severe.
Objective 2: Transition Probabilities and Subgroups
Table 2 shows the estimated transition probabilities between subgroups. Our model assumes that transition probabilities are uniform across consecutive time points. To determine whether women moved to a more or less burdened subgroup, we sought to further order the subgroups. Subgroup 1 clearly has less burden than subgroup 7, but rank ordering the intermediate subgroups is less apparent. To aid in ordinally ranking the subgroups, we created an overall symptom burden score for each subgroup by summing severity scores of the symptoms within each subgroup where 0=symptom not experienced, 1 = mild, 2 = moderate, and 4 = severe. A lower score equals less burden. The respective values of these scores for the seven subgroups were 7.0, 9.6, 9.8, 13.2, 13.7, 13.1, and 17.5. Based on these mean symptom burden scores, we considered subgroups 2 and 3 equally burdened and subgroups 4, 5, and 6 equally burdened.
Table 2. Transition Probabilities between Subgroups.
| Subgroup | 1 Low Symptom Burden | 2 Mild Fatigue | 3 Mild Fatigue & Mild Pain | 4 Moderate Fatigue & Moderate Pain | 5 Moderate Fatigue & Moderate Psych | 6 Moderate Fatigue & Mild Pain & Psych | 7 High Symptom Burden |
|---|---|---|---|---|---|---|---|
| 1 Low Symptom Burden | 0.88 (U) | 0.01 (W) | 0.08 (W) | 0.02 (W) | 0.00 (W) | 0.00 (W) | 0.00 (W) |
| 2 Mild Fatigue | 0.08 (I) | 0.73 (U) | 0.12 (N) | 0.00 (W) | 0.01 (W) | 0.06 (W) | 0.00 (W) |
| 3 Mild Fatigue & Mild Pain | 0.10 (I) | 0.03 (N) | 0.72 (U) | 0.11 (W) | 0.00 (W) | 0.03 (W) | 0.01 (W) |
| 4 Moderate Fatigue & Moderate Pain | 0.04 (I) | 0.07 (I) | 0.28 (I) | 0.53 (U) | 0.00 (N) | 0.07 (N) | 0.01 (W) |
| 5 Moderate Pain & Moderate Psychological | 0.00 (I) | 0.09 (I) | 0.00 (I) | 0.04 (N) | 0.59 (U) | 0.07 (N) | 0.20 (W) |
| 6 Moderate Fatigue & Mild Pain & Psychological | 0.00 (I) | 0.08 (I) | 0.07 (I) | 0.09 (N) | 0.00 (N) | 0.65 (U) | 0.10 (W) |
| 7 High Symptom Burden | 0.00 (I) | 0.01 (I) | 0.01 (I) | 0.03 (I) | 0.12 (I) | 0.16 (I) | 0.67 (U) |
U = unchanged or no transition; I = improved; W = worsened; N = not classified. Transition probabilities for each subgroup dyad are estimated under model assumption of uniform probability of transitioning from one timepoint to next consecutive time point. Each entry represents the probability of transitioning from the subgroup indicated by the row to the subgroup indicated by the column. Therefore, all entries in a row sum to 1.0.
Change in subgroup membership across consecutive timepoints is coded as unchanged (U), improved (I), and worsened (W) (Table 2). Transitions between equally burdened subgroups could not be classified (N). An average of 70% of women remained within the same subgroup over any two consecutive timepoints (70% is a weighted average of the transition probabilities on the diagonal in Table 2). The most stable subgroup was the low symptom burden state, with 88% of women in this group remaining in this subgroup. The probabilities of transition to an improved state were generally greater than those of moving towards a worsened state. For example, for subgroup 4, there was 0.39 probability of moving to an improved state, but only a 0.01 probability of moving to a worsened state. One-third of women in the highest symptom burden subgroup (subgroup 7) moved to a lower burden subgroup over consecutive timepoints. Women in subgroup 5 (fatigue and psychological) had the highest probability (20%) of moving to a more burdened subgroup (subgroup 7).
Figure 2 shows the percentage of women in each subgroup by timepoint. At baseline, the highest percentage of women (24.7%) were in subgroup 2. The lowest percentages of women were in subgroups 3 (7.6%) and 4 (7.5%). Subgroup 3 had the greatest increase in prevalence over time (from 7.7% to 21%), while the percentage of women in the least burdened subgroup (subgroup 1) also increased (12.6% to 18.1%). Subgroups 2 and 5 had a decrease in number of women over time.
Figure 2.

Prevalence of each subgroup by questionnaire timepoint. The sample sizes at timepoint 1 through 5 are N=653, 620, 614, 593, and 565.
Objective 3: Characteristics of Symptom Subgroups
Characteristics associated with baseline symptom subgroups are shown in Table 1. Greater symptom burden was significantly related to younger age, difficulty paying for basics, cancer stage II or III, active chemotherapy, mastectomy, greater illness intrusiveness, and lower social support. As part of our goal of examining subgroups with qualitatively (though not clearly quantitatively) different symptom profiles, we were particularly interested in comparing subgroups 4 and 5. While both subgroups experienced moderate levels of fatigue, subgroup 4 also had moderate pain, while subgroup 5 had moderate psychological symptoms. Women in subgroup 5 were significantly younger (p<.001) and had higher illness intrusiveness (p<.001) than those in subgroup 4.
For our ordinal repeated measures model where subgroup membership was treated as the ordered dependent variable, the model assumes equally-spaced subgroups. For this model, we therefore used our four categories of subgroups described under Objective 2. Subgroups 2 and 3 were combined to form a relatively low symptom group and subgroups 4, 5, and 6 were combined to form a moderate symptom group.
Table 3 shows the results of the multivariable longitudinal analysis of symptom subgroups on patient characteristics. Symptom subgroups were ranked from best to worst. The model quantified the odds of being in a higher-numbered (i.e., worse) symptom subgroup; thus, an odds ratio >1 for a characteristic (independent variable) indicates greater odds of being in a more burdened subgroup relative to the reference group for the characteristic. Current chemotherapy (compared to past; (odds ratio [OR], 2.01; 95% confidence interval [CI], 1.14– 3.01) and greater illness intrusiveness (OR, 1.09; 95% CI, 1.07–1.10) were positively and significantly related to higher symptom burden. Not being married or partnered (OR, 0.47; 95% CI, 0.25–0.90), having no difficulty paying for basics (OR, 0.17; 95% CI, 0.08–0.39), receiving no chemotherapy (vs being a past recipient; OR, 0.53; 95% CI, 0.30–0.93), and having greater social support (OR, 0.49; 95% CI, 0.39–0.62) were all significantly associated with lower odds of greater symptom burden.
Table 3. Multivariable Analysis of Predictors of Higher Symptom Burden Using Longitudinal Ordinal Logistic Regressiona.
| Characteristic | Odds Ratio | 95% CI | P value |
|---|---|---|---|
| Age | 1.00 | (0.98, 1.02) | 0.962 |
| Race (non-white versus white) | 1.06 | (0.40, 2.84) | 0.906 |
| Education (>high school vs. ≤high school) | 0.88 | (0.67, 1.15) | 0.339 |
| Marital status (not partnered vs. partnered) | 0.47 | (0.25, 0.90) | 0.022 |
| Paying for basics (no difficulty vs. difficulty) | 0.17 | (0.08, 0.39) | <0.0001 |
| Cancer stageb | 1.11 | (0.89, 1.77) | 0.677 |
| Chemotherapy (none vs. post treatment) | 0.53 | (0.30, 0.93) | 0.026 |
| Chemotherapy (current vs. post treatment) | 2.01 | (1.14, 3.01) | 0.001 |
| Radiation (none vs. post treatment) | 1.29 | (0.88, 1.88) | 0.190 |
| Radiation (current vs. post treatment) | 0.87 | (0.47, 1.61) | 0.662 |
| Illness intrusiveness | 1.09 | (1.07, 1.10) | <0.0001 |
| Social support | 0.49 | (0.39, 0.62) | <0.0001 |
Symptom subgroups ordered from 1-4; subgroups 2,3, and 4, 5 and 6 respectively combined into two single groups.
Cancer stage is treated as continuous.
Objective 4: Symptom Subgroup and Quality of Life
In the multivariable longitudinal analysis of the relationship between symptom subgroup membership and the dependent variable QOL, subgroup was treated as a seven-level nominal (i.e., non-ordinal) categorical independent variable, to allow for nonmonotonocity in parameter estimates. (Since the symptom subgroups were not ordered in this model, we used the original seven groups.) The global F-test for significant differences among the subgroups in mean estimated FACT-B scores was highly significant (p<0.0001). The least-squares adjusted FACT-B means from the model for the seven subgroups are shown in Table 4. The standard deviation of the FACT-B score was 19.8, and thus the difference of 21.4 between the low and high symptom burden subgroups is approximately 1 SD, which is considered a large effect size and clinically meaningful. The covariates illness intrusiveness and social support were both highly significant (p < 0.001) independent variables in the model. The estimated means, along with their confidence intervals, indicate that QOL for women with moderate psychological symptoms (subgroups 5 and 7) was significantly lower than that for all other subgroups.
Table 4. Regression of Quality of Life Outcome (FACT-B) on Symptom Subgroup, Adjusted for Covariatesa.
| Subgroup | FACT-B Score | |
|---|---|---|
|
| ||
| Least Squares Mean Estimate | 95% CI | |
| 1 Low symptom burden | 114.9 | (112.7, 117.1) |
| 2 Mild fatigue | 109.6 | (107.5, 111.6) |
| 3 Mild fatigue & mild pain | 111.8 | (109.7, 113.9) |
| 4 Moderate fatigue & moderate pain | 105.8 | (103.5, 108.1) |
| 5 Moderate fatigue & moderate psychological | 97.7 | (95.2, 100.1) |
| 6 Moderate fatigue, mild pain and psychological | 103.6 | (101.5, 105.6) |
| 7 High symptom burden | 93.5 | (91.3, 95.7) |
Adjusted for: age at diagnosis, race, education, marital/partner status, difficulty paying for basics, cancer stage, chemotherapy, radiation, illness intrusiveness, social support.
Discussion
In this large study of breast cancer survivors, we found seven subgroups of survivors based on symptom profiles. Similar to Miaskowksi,3 where all subgroups reported some level of fatigue, our subgroups varied in terms of symptom severity and types of symptoms, with some survivors also reporting pain and others experiencing psychological symptoms. The few other studies that have examined types of symptoms found subgroups distinguished by fatigue and pain2,4 and physical and psychological symptoms.3 Inconsistencies across studies in number and types of subgroups may be due to differences in symptoms assessed, sample sizes, and clinical characteristics of the samples. One commonality is that all studies reported a low-burdened group of patients who reported few symptoms with low severity and a high-burdened subgroup that experienced all symptoms with some severity.2-4,6,9-11
To our knowledge, this is the first study to use an HMM approach to examine transitions over time. HMM offers advantages over LCA and CA. Although the majority of survivors (70%) remained in the same subgroup, there were small percentages of women who transitioned to a worsened state in each consecutive timepoint, and about one-third of the women in the highest burdened state moved to a lower burdened state.
Identification of patient characteristics related to symptom burden is an important aspect of studying patient subgroups. In multivariable analyses, we found that greater financial strain, being partnered, current chemotherapy (compared to past chemotherapy), past chemotherapy (compared to no chemotherapy), greater illness intrusiveness, and lower social support were related to greater symptom burden. Our larger sample size and wider range of independent variables enabled us to identify more risk factors than were identified in other studies. Although others found lower income to be related to higher symptom burden,12 illness intrusiveness and social support have not been included in other studies. Similar to others,2,3 we found that younger women reported greater baseline symptom burden in bivariate analyses, but age was not related to symptom burden in multivariable analyses. Our other work has shown that higher levels of depressive symptoms among younger women can be explained largely by greater illness intrusiveness.27 We also found differences between women with different types of symptoms. Women who reported psychological symptoms were younger and reported more illness intrusiveness compared to those who reported pain symptoms.
Not surprisingly, greater symptom burden was associated with lower QOL; this has been consistently found by others.2-4,6,9,10,14 However, a novel finding from our study is that women who reported moderate to severe psychological symptoms had lower QOL than those with moderate to severe pain. To our knowledge, the only other study to examine the relationship between different symptom clusters and QOL14 also found that patients who reported more severe psychological symptoms had lower QOL than did those reporting physical symptoms. Our study could not determine whether the psychological symptoms preceded lower QOL or vice versa.
Our sample was mostly White and educated, which is a limitation. Although there is no reason to believe that sample composition would impact identification of the symptom subgroups, proportions in subgroups and transition probabilities would likely vary. Another limitation is the focus on six single-item symptoms. Consideration of a larger number of symptoms would likely yield different subgroups, as well as subgroups of small sample sizes. However, our focus was on the symptoms that are most frequently reported by breast cancer survivors.
An additional limitation is that women were enrolled in our study at varying lengths of time (within 8 months) following diagnosis and were not comparable with respect to treatment status at baseline. However, we considered treatment status in analyses. Further, as is nearly always the case in longitudinal research, some participants dropped out over time, and it is likely that such loss to follow-up was not random (e.g., we know that those with higher depression scores at baseline were more likely to drop out than those with lower scores.) Overall, however, our retention of participants was high, and thus we believe that the impact of data not missing at random is likely small.
The use of HMM to analyze subgroup transitions over time is an innovative strength of the present study. This approach to symptom subgroup transitions may be especially beneficial when transitions related to treatment status are of interest and/or in the context of a clinical trial where transitions are hypothesized. Other strengths of the study include a large sample size, allowing for the identification of more subgroups than were identified in other studies, and the differentiation between types of symptoms and symptom severity.
In conclusion, identification of a cancer survivor's symptom profile may help guide treatment recommendations. For example, ASCO guidelines provide different treatment algorithms for depression based on severity.28 Patients with moderate symptoms may be referred to individually guided self-help or group-based cognitive behavioral therapy. Those with more severe symptoms might be referred to individual therapy and/or pharmacologic treatment. Psychosocial interventions may also help with fatigue. There is limited evidence that pharmacological interventions reduce fatigue in patients post active treatment.29 Finally, the use of HMM to identify subgroup transitions facilitates a better understanding of how symptom profiles may change over time.
Acknowledgments
Disclosures: The work was supported by Department of Defense grant DAMD17-01-1-0447, NIH grant #1U01HL101066-01, and NSF grants SES-1229549 and SES-1424875. The sponsors played no role in study design; the collection, analysis, and interpretation of data; the writing of the report; or the decision to submit the article for publication.
Footnotes
Publisher's Disclaimer: This is a PDF file of an unedited manuscript that has been accepted for publication. As a service to our customers we are providing this early version of the manuscript. The manuscript will undergo copyediting, typesetting, and review of the resulting proof before it is published in its final citable form. Please note that during the production process errors may be discovered which could affect the content, and all legal disclaimers that apply to the journal pertain.
References
- 1.NIH State-of-the-Science Statement on symptom management in cancer: pain, depression, and fatigue. NIH Consens State Sci Statements. 2002;19:1–29. [PubMed] [Google Scholar]
- 2.Miaskowski C, Cooper BA, Paul SM, et al. Subgroups of patients with cancer with different symptom experiences and quality-of-life outcomes: A cluster analysis. Oncol Nurs Form. 2006;33:E79–E89. doi: 10.1188/06.ONF.E79-E89. [DOI] [PubMed] [Google Scholar]
- 3.Miaskowski C, Dunn L, Ritchie C, et al. Latent class analysis reveals distinct subgroups of patients based on symptom occurrence and demographic and clinical characteristics. J Pain Symptom Manage. 2015;50:28–37. doi: 10.1016/j.jpainsymman.2014.12.011. [DOI] [PMC free article] [PubMed] [Google Scholar]
- 4.Pud D, Ben Ami S, Cooper BA, et al. The symptom experience of oncology outpatients has a different impact on quality-of-life outcomes. J Pain Symptom Manage. 2008;35:162–170. doi: 10.1016/j.jpainsymman.2007.03.010. [DOI] [PubMed] [Google Scholar]
- 5.Miaskowski C, Aouizerat BE, Dodd M, Cooper B. Conceptual issues in symptom clusters research and their implications for quality-of-life assessment in patients with cancer. J Natl Cancer Inst Monogr. 2007:39–46. doi: 10.1093/jncimonographs/lgm003. [DOI] [PubMed] [Google Scholar]
- 6.Dodd MJ, Cho MH, Cooper BA, Miaskowski C. The effect of symptom clusters on functional status and quality of life in women with breast cancer. Eur J Oncol Nurs. 2010;14:101–110. doi: 10.1016/j.ejon.2009.09.005. [DOI] [PMC free article] [PubMed] [Google Scholar]
- 7.Fann JR, Thomas-Rich AM, Katon WJ, et al. Major depression after breast cancer: a review of epidemiology and treatment. Gen Hosp Psychiatry. 2008;30:112–126. doi: 10.1016/j.genhosppsych.2007.10.008. [DOI] [PubMed] [Google Scholar]
- 8.Kim E, Jahan T, Aouizerat BE, et al. Differences in symptom clusters identified using occurrence rates versus symptom severity ratings in patients at the end of radiation therapy. Cancer Nurs. 2009;32:429–436. doi: 10.1097/NCC.0b013e3181b046ad. [DOI] [PMC free article] [PubMed] [Google Scholar]
- 9.Ferreira KA, Kimura M, Teixeira MJ, et al. Impact of cancer-related symptom synergisms on health-related quality of life and performance status. J Pain Symptom Manage. 2008;35:604–616. doi: 10.1016/j.jpainsymman.2007.07.010. [DOI] [PubMed] [Google Scholar]
- 10.Gwede CK, Small BJ, Munster PN, Andrykowski MA, Jacobsen PB. Exploring the differential experience of breast cancer treatment-related symptoms: a cluster analytic approach. Support Care Cancer. 2008;16:925–933. doi: 10.1007/s00520-007-0364-2. [DOI] [PMC free article] [PubMed] [Google Scholar]
- 11.Kim HJ, Barsevick AM, Beck SL, Dudley W. Clinical subgroups of a psychoneurologic symptom cluster in women receiving treatment for breast cancer: A secondary analysis. Oncol Nurs Forum. 2012;39:E20–E30. doi: 10.1188/12.ONF.E20-E30. [DOI] [PubMed] [Google Scholar]
- 12.Langford DJ, Paul SM, Cooper B, et al. Comparison of subgroups of breast cancer patients on pain and co-occurring symptoms following chemotherapy. Support Care Cancer. 2016;24:605–614. doi: 10.1007/s00520-015-2819-1. [DOI] [PubMed] [Google Scholar]
- 13.Ho SY, Rohan KJ, Parent J, Tager FA, McKinley PS. A longitudinal study of depression, fatigue, and sleep disturbances as a symptom cluster in women with breast cancer. J Pain Symptom Manage. 2015;49:707–715. doi: 10.1016/j.jpainsymman.2014.09.009. [DOI] [PMC free article] [PubMed] [Google Scholar]
- 14.Trudel-Fitzgerald C, Savard J, Ivers H. Longitudinal changes in clusters of cancer patients over an 18-month period. Health Psychol. 2014;33:1012–1022. doi: 10.1037/a0033497. [DOI] [PubMed] [Google Scholar]
- 15.Ip EH, Zhang Q, Rejeski WJ, Harris TB, Kritchevsky S. Partially ordered mixed hidden Markov model for the disablement process of older adults. J Am Stat Assoc. 2013;108:370–380. doi: 10.1080/01621459.2013.770307. [DOI] [PMC free article] [PubMed] [Google Scholar]
- 16.Rejeski WJ, Ip EH, Bertoni AG, et al. Lifestyle change and mobility in obese adults with type 2 diabetes. N Engl J Med. 2012;366:1209–1217. doi: 10.1056/NEJMoa1110294. [DOI] [PMC free article] [PubMed] [Google Scholar]
- 17.Avis NE, Levine B, Naughton MJ, Case LD, Naftalis E, Van Zee KJ. Age-related longitudinal changes in depressive symptoms following breast cancer diagnosis and treatment. Breast Cancer Res Treat. 2013;139:199–206. doi: 10.1007/s10549-013-2513-2. [DOI] [PMC free article] [PubMed] [Google Scholar]
- 18.Barnabei VM, Cochrane BB, Aragaki AK, et al. Menopausal symptoms and treatment-related effects of estrogen and progestin in the Women's Health Initiative. Obstet Gynecol. 2005;105:1063–1073. doi: 10.1097/01.AOG.0000158120.47542.18. [DOI] [PubMed] [Google Scholar]
- 19.Ganz PA, Day R, Ware JE, Jr, Redmond C, Fisher B. Base-line quality-of-life assessment in the National Surgical Adjuvant Breast and Bowel Project Breast Cancer Prevention Trial. J Natl Cancer Inst. 1995;87:1372–1382. doi: 10.1093/jnci/87.18.1372. [DOI] [PubMed] [Google Scholar]
- 20.Cella DF, Tulsky DS, Gray G, et al. The Functional Assessment of Cancer Therapy scale: development and validation of the general measure. J Clin Oncol. 1993;11:570–579. doi: 10.1200/JCO.1993.11.3.570. [DOI] [PubMed] [Google Scholar]
- 21.American Joint Committee on Cancer. [Accessed October 17, 2016];Cancer Staging System. 2016 Available from: https://cancerstaging.org/references-tools/Pages/What-is-Cancer-Staging.aspx.
- 22.Devins GM. Using the illness intrusiveness ratings scale to understand health-related quality of life in chronic disease. J Psychosom Res. 2010;68:591–602. doi: 10.1016/j.jpsychores.2009.05.006. [DOI] [PubMed] [Google Scholar]
- 23.Sherbourne CD, Stewart AL. The MOS social support survey. Soc Sci Med. 1991;32:705–714. doi: 10.1016/0277-9536(91)90150-b. [DOI] [PubMed] [Google Scholar]
- 24.Ip EH, Zhang Q, Schwartz R, et al. Multi-profile hidden Markov model for mood, dietary intake, and physical activity in an intervention study of childhood obesity. Stat Med. 2013;32:3314–3331. doi: 10.1002/sim.5719. [DOI] [PMC free article] [PubMed] [Google Scholar]
- 25.MacDonald IL, Zucchini W. Hidden Markov and other models for discrete-valued time series. New York: Chapman & Hall/CRC; 2000. [Google Scholar]
- 26.Schwarz GE. Estimating the dimension of a model. Annals of Statistics. 1978;6:461–464. [Google Scholar]
- 27.Avis NE, Levine B, Naughton MJ, Case DL, Naftalis E, Van Zee KJ. Explaining age-related differences in depression following breast cancer diagnosis and treatment. Breast Cancer Res Treat. 2012;136:581–591. doi: 10.1007/s10549-012-2277-0. [DOI] [PMC free article] [PubMed] [Google Scholar]
- 28.Andersen BL, DeRubeis RJ, Berman BS, et al. Screening, assessment, and care of anxiety and depressive symptoms in adults with cancer: An American Society of Clinical Oncology guideline adaptation. J Clin Oncol. 2014;32:1605–1619. doi: 10.1200/JCO.2013.52.4611. [DOI] [PMC free article] [PubMed] [Google Scholar]
- 29.Bower JE, Bak K, Berger A, et al. Screening, assessment, and management of fatigue in adult survivors of cancer: an American Society of Clinical Oncology clinical practice guideline adaptation. J Clin Oncol. 2014;32:1840–1850. doi: 10.1200/JCO.2013.53.4495. [DOI] [PMC free article] [PubMed] [Google Scholar]