Abstract
Nearly all genetic crosses generated from Apoe−/− or Lldlr−/− mice for genetic analysis of atherosclerosis have used C57BL/6J (B6) mice as one parental strain; thus limiting their mapping power and coverage of allelic diversity. SM/J-Apoe−/− and BALB/cJ-Apoe−/− mice differ significantly in atherosclerosis susceptibility. 224 male F2 mice were generated from the two Apoe−/− strains to perform quantitative trait locus (QTL) analysis of atherosclerosis. F2 mice were fed 5 weeks of Western diet and analyzed for atherosclerotic lesions in the aortic root. Genome-wide scans with 144 informative SNP markers identified a significant locus near 20.2 Mb on chromosome 10 (LOD score: 6.03), named Ath48, and a suggestive locus near 49.5 Mb on chromosome 9 (LOD: 2.29; Ath29) affecting atherosclerotic lesion sizes. Using bioinformatics tools, we prioritized 12 candidate genes for Ath48. Of them, Tnfaip3, an anti-inflammatory gene, is located precisely underneath the linkage peak and contains two nonsynonymous SNPs leading to conservative amino acid substitutions. Thus, this study demonstrates the power of forward genetics involving the use of a different susceptible strain and bioinformatics tools in finding atherosclerosis susceptibility genes.
Keywords: Atherosclerosis, quantitative trait locus, TNF alpha induced protein 3, mouse
Introduction
Atherosclerosis is the underlying cause of heart attack, ischemic stroke and peripheral arterial disease and claims more lives than any other disease in the United States (Mozaffarian et al. 2015). Prospective studies of twins, families or cohorts have demonstrated a strong genetic component in coronary heart disease (Marenberg et al. 1994),(Lloyd-Jones et al. 2004), (Bachmann et al. 2012). Meta-analysis of genome-wide association studies (GWAS) have identified over 50 loci harboring common variants significantly associated with coronary heart disease (Nikpay et al. 2015),(CARDIoGRAMplusC4D Consortium et al. 2013). However, the collective effect of all these loci explains only 26% of the total heritability of coronary heart disease (Nikpay et al. 2015), suggesting that many more loci remain to be discovered. Moreover, all the loci detected have small effect sizes with odds ratios (OR) <1.25 (Nikpay et al. 2015), and thus may have little value for being used to diagnose the disease or develop targeted therapy.
Studies of animal models have contributed greatly to the identification of genes and pathways involved in many complex human traits or diseases, including atherosclerosis. Apolipoprotein E-null (Apoe−/−) and LDL receptor-null (Lldlr−/−) mice develop all phases of atherosclerotic lesions seen in humans (Nakashima et al. 1994),(Ishibashi et al. 1994). To date, we and others have generated 12 intercrosses or backcrosses from Apoe−/− or Lldlr−/− mouse strains for conducting quantitative trait locus (QTL) analysis of atherosclerotic lesions in the aortic root and identified ~50 loci for the trait (http://www.informatics.jax.org/allele). Of the 12 crosses generated, C57BL/6 (B6) mice have been used as one susceptible progenitor strain for 10; thus limiting the power of QTL analysis and the coverage of allelic diversity. Generation of new crosses using a different atherosclerosis-susceptible strain may discover new loci and also empower bioinformatics analysis for prioritizing candidate genes. We recently constructed SM/J (SM) and SWR/J Apoe−/− mouse strains, and found them susceptible to atherosclerosis compared with C3H/HeJ (C3H) or BALB/cJ (BALB) Apoe−/− mice (Liu et al. 2015). In the present study, we performed QTL analysis using a male F2 cohort derived from BALB-Apoe−/− and SM-Apoe−/− mice and identified a major QTL (Ath48) on chromosome 10 influencing atherosclerotic lesion size. We further used bioinformatics tools to prioritize Tnfaip3 as a likely candidate gene for the QTL.
Materials and Methods
Ethics statement
All procedures were conducted under the current National Institutes of Health guidelines and approved by the Institutional Animal Care and Use Committee (Assurance #A3245-01, Animal Protocol #3109).
Generation and treatment of the cross
BALB-Apoe−/− and SM-Apoe−/− mice were generated in our laboratory using the traditional breeding strategy as reported (Liu et al. 2015). The creation of a male F2 cohort from the two Apoe−/− strains was recently described (Shi et al. 2016). Briefly, BALB-Apoe−/− mice were crossed with SM-Apoe−/− mice to generate F1s, which were intercrossed to generate 224 male F2 mice. At 8 weeks of age, these mice were started with a Western diet containing 21% fat, 34.1% sucrose, 0.15% cholesterol and 19.5% casein, and fed the diet for 5 weeks.
Aortic lesion measurement
Atherosclerotic lesion areas in the aortic root of mice were measured as reported (Rowlan et al. 2013)(Grainger et al. 2016). The vasculature of the animals was perfusion-fixed with 10% formalin through the heart. The aortic root and adjacent portion of the heart were harvested, cross-sectioned in 10-µm thickness, and stained with oil red O and hematoxylin. Atherosclerotic lesion areas were measured under a microscope using Zeiss AxioVision 4.8 software. Lesion areas on five sections with the largest readings were averaged for each mouse, and this number was used for statistical analysis.
Plasma lipid and glucose analyses
Blood was drawn under isoflurane anesthesia from the retro-orbital venous sinus after mice were fasted overnight. EDTA was used as an anticoagulant. Plasma levels of total cholesterol, HDL cholesterol, triglyceride and glucose were measured using commercial kits as reported (Shi et al. 2016)(Su et al. 2006a). Non-HDL cholesterol was the difference between total and HDL cholesterol.
Genotyping
Genomic DNA was isolated from the tail of mice using the phenol/chloroform extraction and ethanol precipitation method. F2 mice were genotyped through the Jackson Laboratory genotyping services using mouse strain-specific SNP arrays (Shi et al. 2016). DNA from the two parental strains and their F1s served as controls. 144 informative SNPs across the whole genome were typed.
Statistical analysis
QTL analysis was performed using J/qtl and Map Manager QTX software as previously reported (Grainger et al. 2016)(Shi et al. 2016),(Wang et al. 2015). LOD threshold values for significant and suggestive linkage were determined through 1000 permutations of the achieved data, which are provided in supplementary materials.
Prioritization of candidate genes
Positional candidate genes for the significant QTL obtained were prioritized using bioinformatics tools. Probable candidate genes were defined as those that contained a non-synonymous SNP in a coding region or a SNP in upstream regulatory region, and this SNP was shared by the parental strains carrying the high allele but was different from the one shared by the parental strains carrying the low allele at a QTL, as reported (Rowlan et al. 2013)(Grainger et al. 2016). Analysis was performed using a combination of SNP databases, including the Sanger Mouse Genomes Project, Mouse Phenome Database, and Ensembl. Online software RaptorX was used to predict the potential effect of an amino acid substitution on the 3D structure of protein product (http://raptorx.uchicago.edu/Structure Prediction/predict/).
Tnfaip3 mRNA expression
mRNA expression levels of Tnfaip3 and Gapdh in the liver of mice was determined by real-time PCR. RNA extraction, cDNA synthesis and PCR amplification were performed as reported (Manichaikul et al. 2011). Primers for Tnfaip3 were: 5′-GGTGACCCTGAAGGACAGTG-3′/5′-CTTCAAACCTACCCCGGTCT-3′, and for Gapdh were: 5′-GAGGCCGGTGCTGAGTATGT-3′/5′-AAGGGTGGAGCCAAAAGGGTCATC-3′).
Results
Trait value distribution
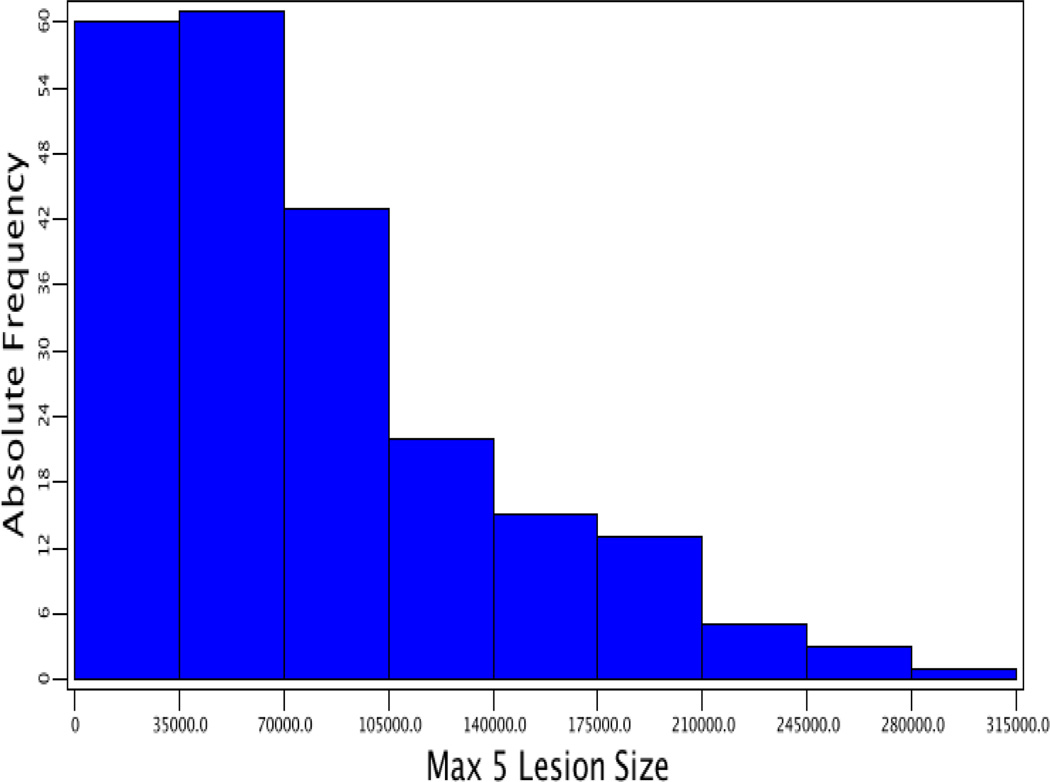
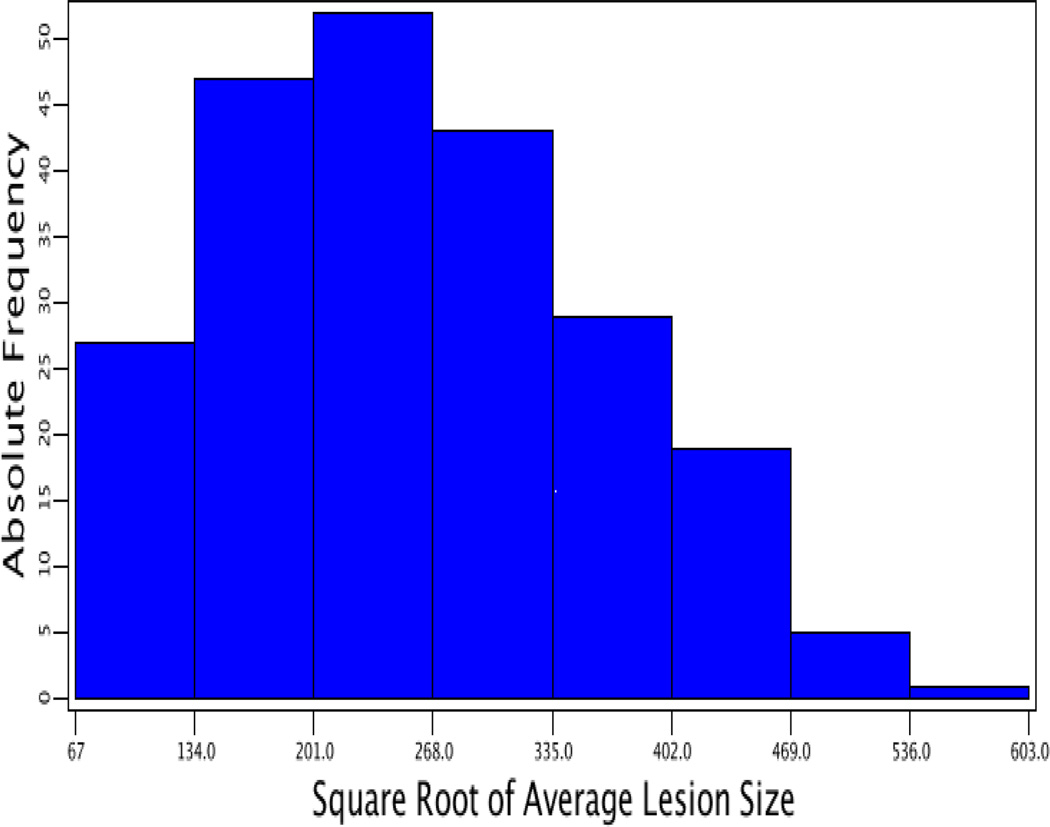
Values in atherosclerotic lesion areas of F2 mice showed a Pareto distribution in which the number of animals with a lesion area of ≤70,000 µm2 was the largest and then gradually decreased as lesion areas increased (Fig. 1). After being squared root-transformed, the values of lesion areas approached a normal distribution. Genome-wide scans were performed using both transformed and untransformed lesion data to identify QTLs for atherosclerotic lesions.
Figure 1.
Frequency distributions of atherosclerotic lesion areas in male F2 mice derived from BALB-Apoe−/− and SM-Apoe−/− mice. Left panel: the distribution of untransformed atherosclerotic lesion areas; right panel: the distribution of square-root transformed atherosclerotic lesion areas. Graphs were created using a plotting function of J/qtl software.
QTL analysis
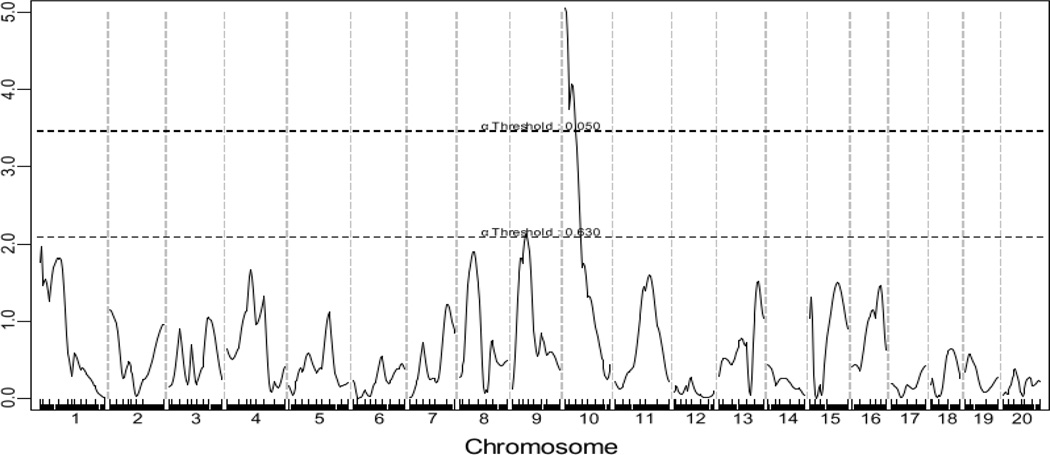
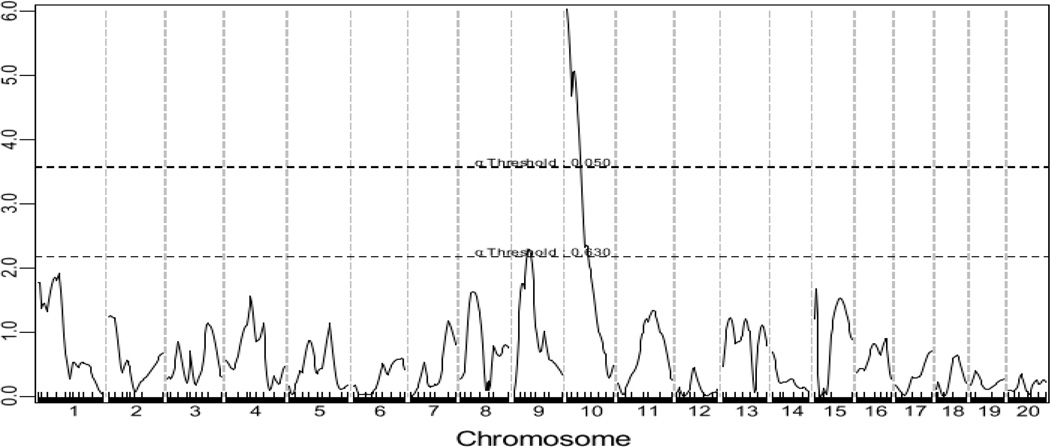
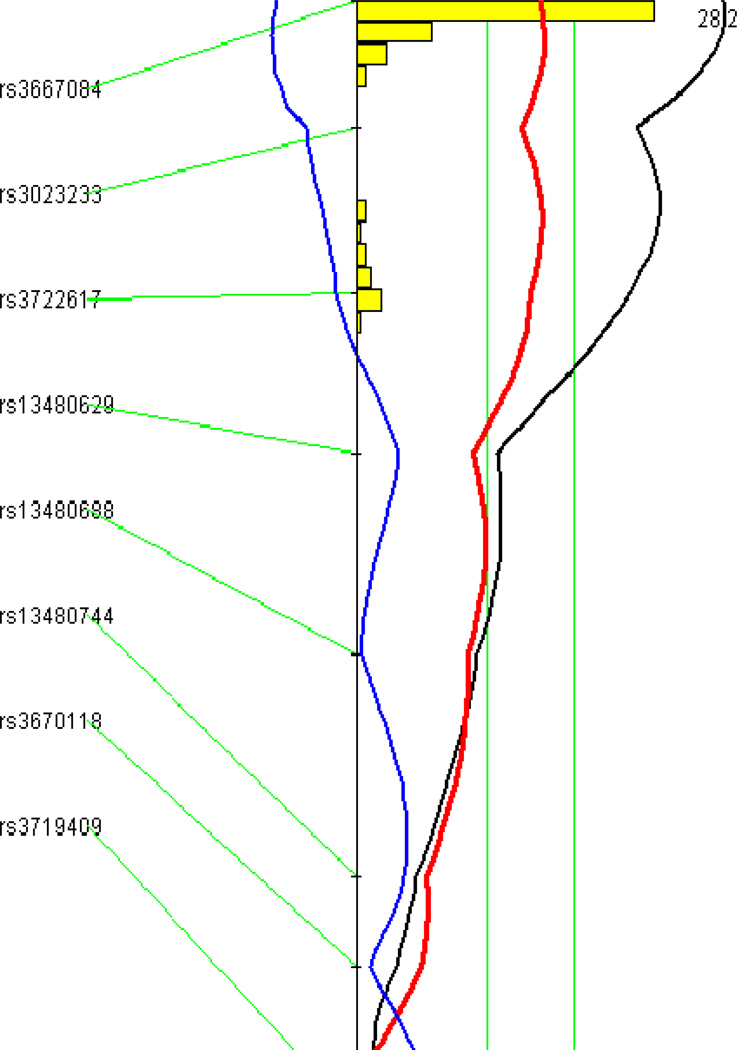
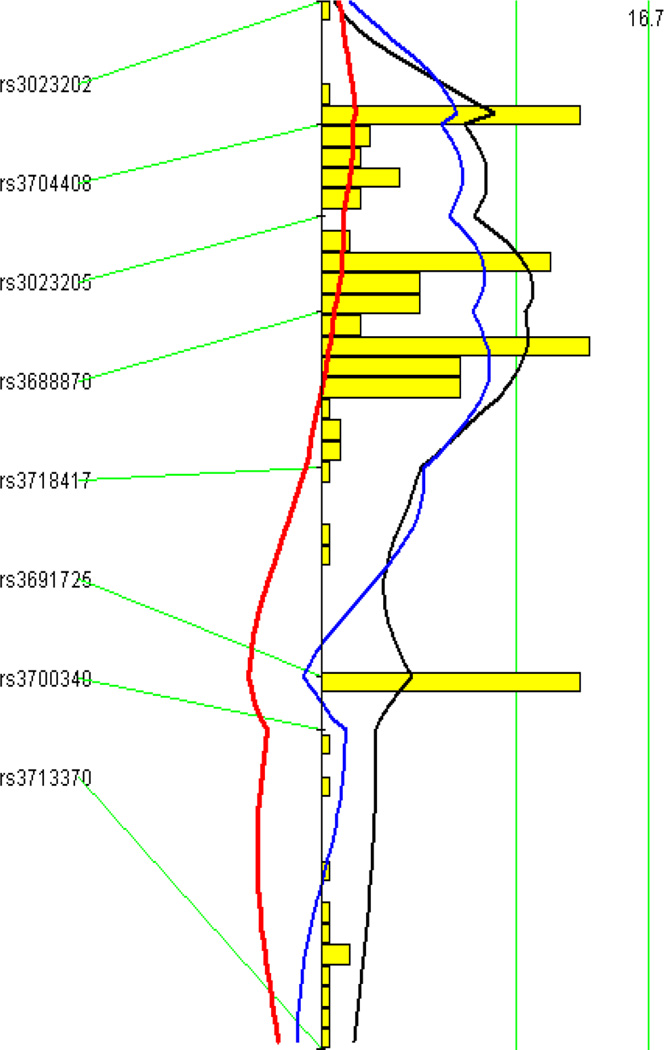
A genome-wide scan using the untransformed lesion data through the non-parametric mode of J/qtl revealed a significant QTL on chromosome 10 and a suggestive QTL on chromosome 9 influencing atherosclerotic lesion sizes (Fig. 2). Details of these two QTLs, including locus name, LOD score, peak location, effect size, 95% CI (confidence interval), P value, high allele, and mode of inheritance, are presented in Table 1. The chromosome 10 QTL had a significant LOD score of 5.05 and peaked at 20.2 Mb. This QTL exerted effect in an additive mode of inheritance with the BALB allele conferring larger lesion size (Fig. 3). This locus overlapped in the confidence interval with Ath11, mapped in a B6-Apoe−/− × FVB-Apoe−/− intercross (Dansky et al. 2002), and Ath20, mapped in a B6 × 129 intercross (Ishimori et al. 2004). However, because this QTL was mapped in a cross derived from progenitor strains different from previous ones, it was designated Ath48 to represent a new locus for atherosclerosis. The chromosome 9 QTL had a suggestive LOD score of 2.12 and peaked at 49.5 Mb. This QTL affected atherosclerosis in a heterotic mode of inheritance. A genome-wide scan using the square-root-transformed lesion data through the parametric mode of J/qtl yielded the same two QTLs as the last scan, but their respective LOD scores were larger: the chromosome 10 QTL had a LOD score of 6.03 and the chromosome 9 QTL had a LOD score of 2.29 (Table 1).
Figure 2.
Genome-wide scans to search for main effect QTLs influencing atherosclerotic lesion areas in male F2 mice. Chromosomes 1 through 20 are represented numerically on the X-axis. Each minor tick on the X axis represents one informative SNP. The Y-axis represents the LOD score. Two horizontal dashed lines denote genome-wide thresholds for suggestive (P=0.63) and significant (P=0.05) linkage. The upper panel (A) shows a genome-wide scan for atherosclerotic lesion areas using the non-parametric mode, and the lower panel (B) shows a genome-wide scan for atherosclerotic lesion areas using the parametric mode. Graphs were created by J/qtl
Table 1.
Significant and suggestive QTLs for atherosclerotic lesion areas in male F2 mice derived from BALB-Apoe−/− and SM-Apoe−/− mice.
| Locus name |
Chr | Mode of analysis |
LODa | Peak (Mb) |
Closest marker |
Effect size (%)b |
95%CIc | High allele | Mode of inheritanced |
|---|---|---|---|---|---|---|---|---|---|
| Ath29 | 9 | Nonparametric | 2.12 | 49.5 | rs3688870 | 5 | 9.14–59.14 | H | Heterosis |
| Ath48 | 10 | Nonparametric | 5.05 | 20.2 | rs3667084 | 13 | 9.16–23.16 | B | Additive |
| Ath29 | 9 | Parametric | 2.29 | 49.5 | rs3688870 | 5 | 9.14–49.14 | H | Heterosis |
| Ath48 | 10 | Parametric | 6.03 | 20.2 | rs3667084 | 13 | 9.16–23.16 | B | Additive |
LOD scores were obtained from genome-wide QTL analysis using J/qtl. The significant LOD scores were highlighted in bold. The suggestive and significant LOD score thresholds were determined by 1,000 permutation tests. Suggestive and significant LOD scores were 2.092 and 3.468, respectively, for untransformed atherosclerotic lesion data (nonparametric), and 2.174 and 3.572, respectively, for square root–transformed lesion areas (parametric).
Effect size (%) of the marker closest to the QTL peak was determined by Map Manager.
95% Confidence interval in cM defined by a whole genome QTL scan.
Mode of inheritance was defined according to allelic effect at the nearest marker of a QTL.
Figure 3.
Interval mapping graphs of chromosomes 10 (left panel) and 9 (right panel) for atherosclerotic lesion areas created by MapManager QTX. The black plot represents LOD scores calculated at 1-cM intervals, the red plot denotes the effect of BALB alleles, and the blue plot represents the effect of SM alleles. The histogram in the plot estimates the confidence interval for a QTL. Two green vertical lines denote genome-wide significance thresholds for suggestive or significant linkage (P=0.63 and P=0.05, respectively).
Candidate genes for Ath48
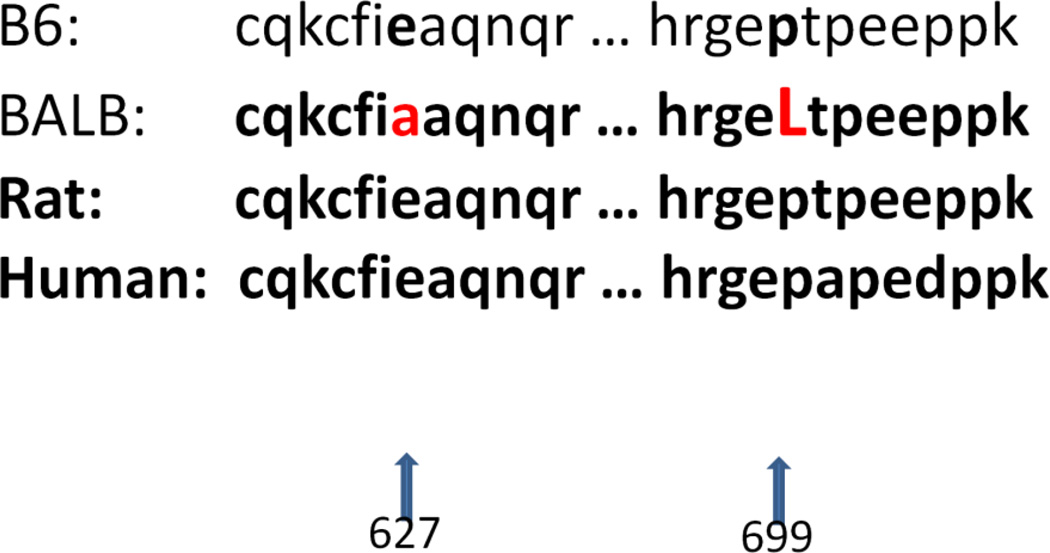
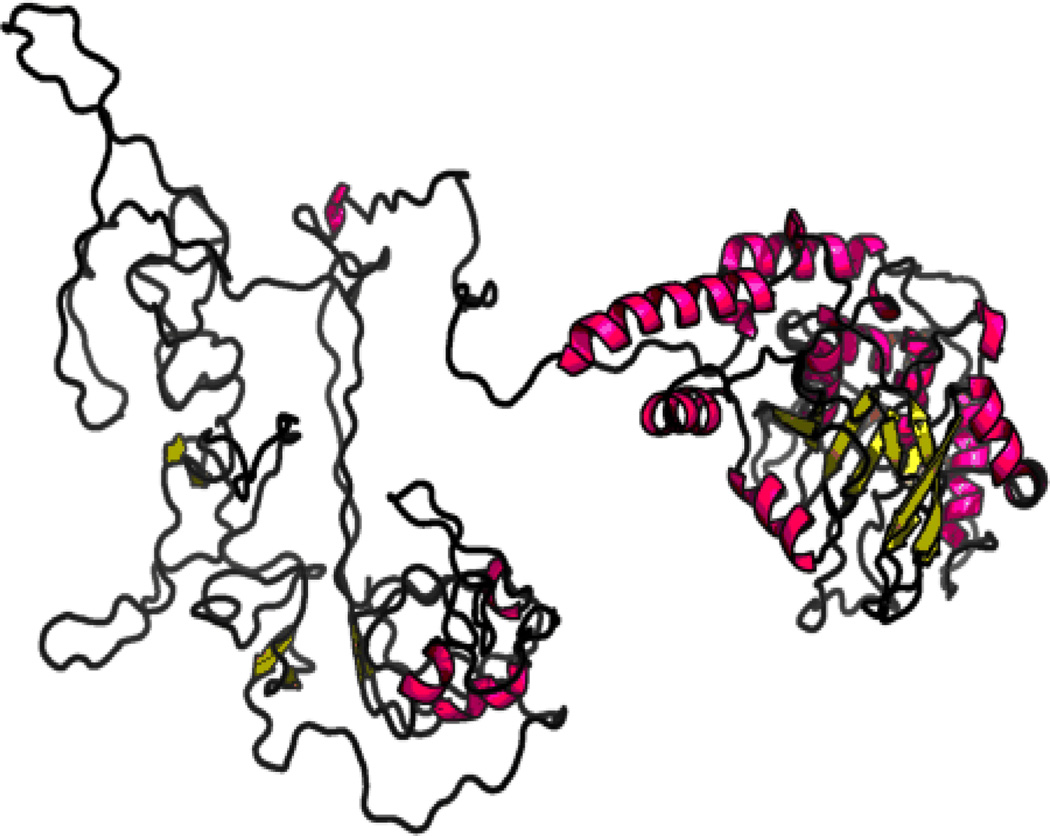
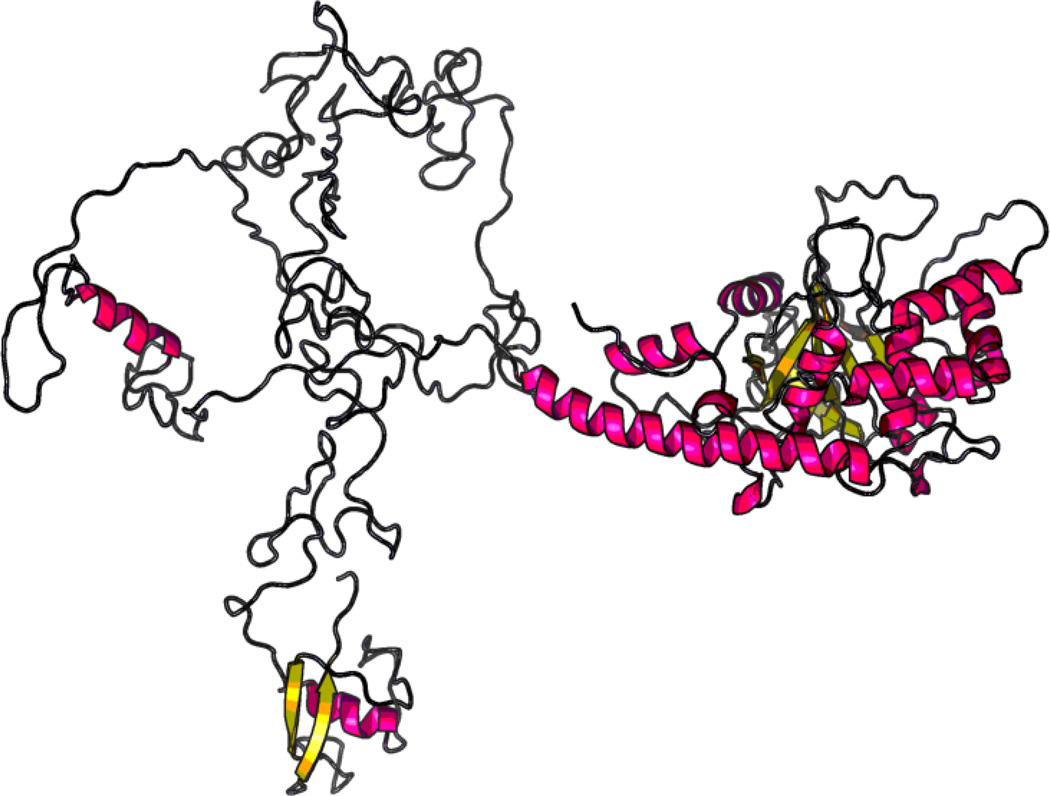
Ath48 overlaps in the confidence interval with Ath11 mapped in a B6-Apoe−/− × FVB-Apoe−/− intercross and Ath20 mapped in a B6 × 129 intercross (Dansky et al. 2002),(Ishimori et al. 2004). Among the 3 crosses that have yielded the chromosome 10 QTLs, B6 and SM strains carry the low allele conferring reduced atherosclerosis, while BALB, FVB and 129 strains carry the high allele conferring increased atherosclerosis. We searched the Sanger Mouse Genomes database for genes containing nonsynonymous SNP(s) or SNP(s) in upstream regulatory regions that were shared by the high allele strains (BALB, FVB and 129) but were different from ones shared by the low allele strains (B6) within the confidence interval of Ath48. 12 candidate genes were identified, including Mthfd1l, Zbtb2, Esr1, Mtrf1l, Pcmt1, Katna1, Ppil4, Ust, Sash1, Tnfaip3, Fam54a, and Raet1e. For these genes, we further searched other publicly available databases, including the Mouse Phenome Database (http://phenome.jax.org/db/q?rtn=snp/home) and Ensembl (http://www.ensembl.org/index.html), and compiled the results in Table 2. Of them, Tnfaip3 (19.0 Mb) and Fam54a (20.36 Mb) are located precisely underneath the linkage peak of Ath48. Two nonsynonymous SNPs in the Tnfaip3 gene led to substitutions of glutamic acid (Glu) to alanine (Ala) at residue 627 and proline (Pro) to leucine (Leu) at residue 699 (Fig. 4). Comparison of Tnfaip3 protein sequences among man, rat, and mouse suggested that 627Glu and 699Pro are conserved in humans, rats, and B6 mice (Fig. 4). Thus, 627Ala and 699Leu are mutations in the high allele BALB, FVB and 129 strains. Online software RaptorX was then used to predict the potential impact of these substitutions on the 3D structure of Tnfaip3 protein (http://raptorx.uchicago.edu/StructurePrediction/). The predicted 3D structure of this protein was noticeably different between B6 and BALB (Fig. 5).
Table 2.
Haplotype analysis for Ath48 on chromosome 10 (0 to 50 Mb).
| Position | Gene | dbSNP | Low allele |
High allele |
Csq | SIFT | ||
|---|---|---|---|---|---|---|---|---|
| C57BL/6 | 129 | BALB | FVB | |||||
| 3978708 | Mthfd1l | rs29320259 | T | C | C | C | missense_variant | 1 |
| 4007800 | Mthfd1l | rs29378605 | T | C | C | C | missense_variant | 0.18 |
| 4369441 | Zbtb2 | rs254179209 | T | G | G | G | missense_variant | 0.71 |
| 4966154 | Esr1 | rs29315913 | G | T* | T* | T* | missense_variant nc_transcript_variant |
0.16 |
| 5823831 | Mtrf1l | rs29343310 | T | C | C | C | 5_prime_utr_variant | - |
| 7638968 | Pcmt1 | rs47720906 | T | C* | C* | C* | missense_variant nmd_transcript_variant |
0.04 |
| 7741513 | Katna1 | rs13470645 | T | C* | C* | C* | missense_variant nmd_transcript_variant |
0.67 |
| 7821178 | Ppil4 | rs29359974 | C | A | A | A | missense_variant | 1 |
| 8518788 | Ust | rs29378325 | T | C | C | C | 5_prime_utr_variant | - |
| 8725513 | Sash1 | rs29375710 | C | T | T | T | missense_variant | 0.31 |
| 19003739 | Tnfaip3 | rs29345620 | T | G* | G* | G* | missense_variant nc_transcript_variant |
1 |
| 19002963 | Tnfaip3 | rs29353577 | A | G | G | G | missense_variant | 0.29 |
| 19015224 | Tnfaip3 | rs29315296 | C | G* | G* | G* | 5_prime_utr_variant nc_transcript_variant |
- |
| 20357285 | Fam54a | rs48866598 | C | T | T | T | missense_variant | 0.21 |
| 22180662 | Raet1e | rs49018430 | T | C | C | C | missense_variant | 0.33 |
| 22180672 | Raet1e | rs230540838 | T | C | C | C | missense_variant | 0.23 |
| 22180675 | Raet1e | rs250225184 | C | T | T | T | missense_variant | 0.67 |
| 22180681 | Raet1e | rs49817652 | G | A | A | A | missense_variant | 1 |
| 22180687 | Raet1e | rs47146068 | T | C | C | C | missense_variant | 1 |
| 22180696 | Raet1e | rs49126056 | C | T | T | T | missense_variant | 0.08 |
| 22180710 | Raet1e | rs49637041 | A | C | C | C | missense_variant | 1 |
| 22180726 | Raet1e | rs50722116 | A | G | G | G | missense_variant | 0.65 |
| 22180821 | Raet1e | rs51079123 | G | A | A | A | missense_variant | 0.11 |
Analysis was performed based on the Mouse Genomes Project and Mouse Phenome Databases. Functional candidate genes are denoted in bold. Csq: consequences;
most likely SNP. SIFT (Sorting Intolerant From Tolerant): A parameter for predicting the effect of an amino acid substitution on protein function.
Figure 4.
Comparison of selected Tnfaip3 protein sequences in three mammal species, including rat, human, B6 and BALB mice. Amino acid residues that are different among the species are highlighted.
Figure 5.
3D structure of Tnfaip3 protein for B6 (left panel) and BALB (right panel) mice predicted by RaptorX software. The predicted 3D structure is noticeably different between the two mouse strains.
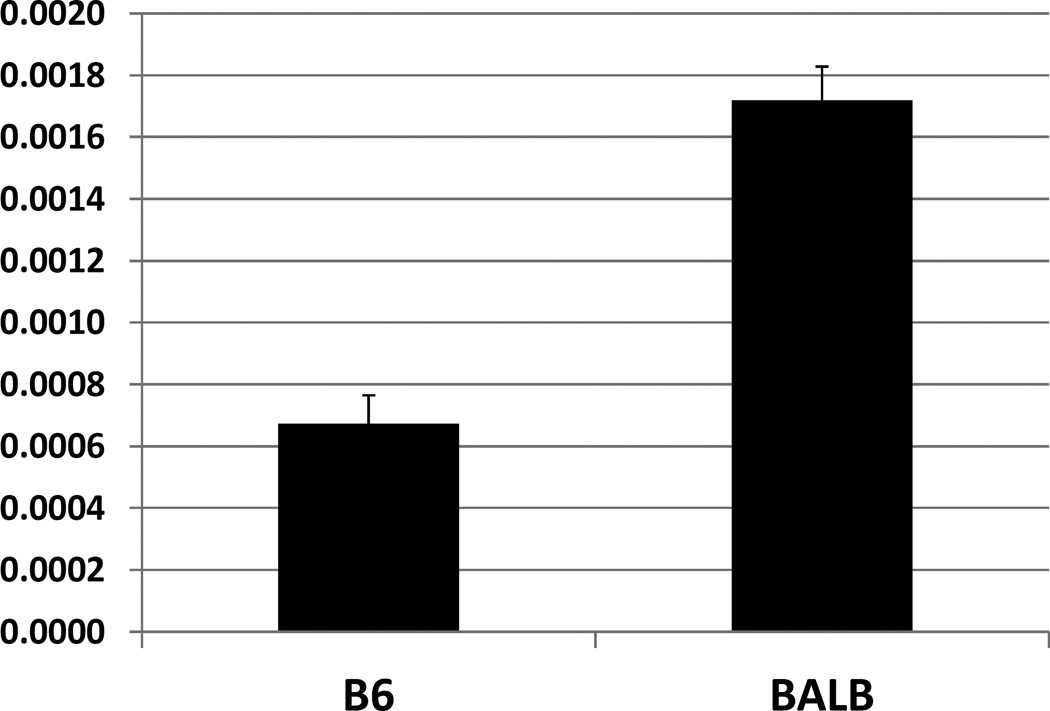
Real-time PCR was performed to assess the expression of Tnfaip3 mRNA in the liver of B6 and BALB Apoe−/− mice. BALB expressed ~3-fold as much Tnfaip3 mRNA as B6 based on the relative ratio to Gapdh determined by real-time PCR (Tnfaip3/Gapdh ratio: 0.00172±0.00011 vs. 0.000673±0.000092; P=0.00037) (Fig. 6).
Figure 6.
Real-time analyses of Tnfaip3 and Gapdh mRNA expression in the liver of B6 and BALB Apoe−/− mice fed a Western diet. Results were expressed as a ratio of Tnfaip3 to Gapdh in real-time PCR cycle threshold (Ct) values of 4 individual mice per strain. * P < 0.05.
Correlations between plasma glucose and lipid levels
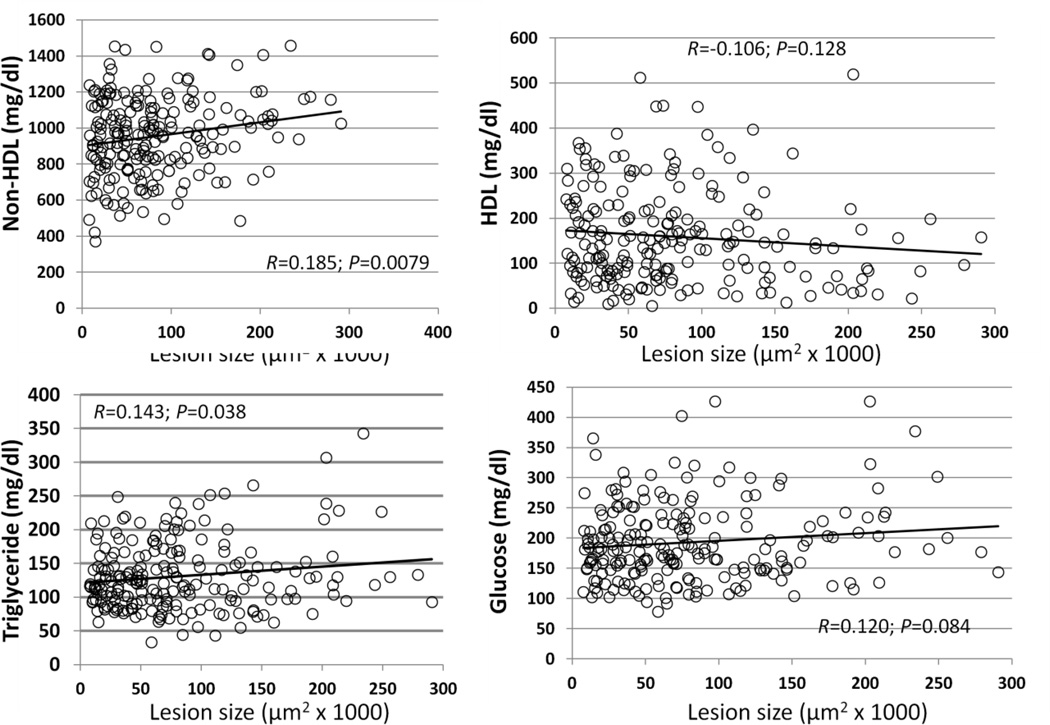
Correlations of atherosclerotic lesion areas with fasting plasma lipid and glucose levels were evaluated in the F2 population (Fig. 7). Significant correlations with non-HDL cholesterol (R=0.185; P=0.0079) and triglyceride (R=0.143; P=0.038) were observed. F2 mice with higher non-HDL cholesterol or triglyceride levels tended to develop larger atherosclerotic lesions than those with lower levels. There was a trend toward an inverse correlation with HDL cholesterol levels (R=-0.106; P=0.128) and a positive correlation with glucose levels (R=0.120; P=0.084).
Figure 7.
Correlations of atherosclerotic lesion sizes with plasma levels of HDL, non-HDL cholesterol, triglyceride, and glucose in the F2 mice. Each point represents values of an individual F2 mouse. The correlation coefficient (R) and significance (P) are shown.
Discussion
BALB and SM mouse strains differ significantly in their susceptibility to atherosclerosis when fed an atherogenic diet or deficient in Apoe (Nishina et al. 1993),(Liu et al. 2015). Using a male F2 cohort derived from the two Apoe−/− strains, we identified a significant QTL, Ath48, and one suggestive QTL that influenced atherosclerotic lesion sizes. Further bioinformatics analysis prioritized 12 candidate genes for Ath48 with Tnfaip3 being the most likely candidate gene. We also observed significant correlations of atherosclerotic lesion areas with non-HDL cholesterol and triglyceride levels and suggestive correlations with HDL and glucose levels in the F2 mice.
Ath11 is an atherosclerosis susceptibility QTL mapped in two separate intercrosses between B6-Apoe−/− and FVB-Apoe−/− mice (Dansky et al. 2002). It is located on mouse chromosome 10 peaked at 10 cM (~20 Mb) with the FVB allele conferring increased atherosclerosis and the B6 allele conferring decreased atherosclerosis. An epistatic QTL for atherosclerosis, Ath20, has been mapped to this location in a B6 × 129 female intercross with the 129 allele increasing and the B6 allele decreasing atherosclerosis (Ishimori et al. 2004). The present study mapped a major atherosclerosis susceptibility QTL to this location. As this QTL was identified in a cross derived from different progenitor strains, it was given a new designation, Ath48, in accordance to the guideline provided by the International Committee on Standardized Genetic Nomenclature for Mice (http://www.informatics.jax.org/mgihome/nomen/gene.shtml). The high allele of Ath48 was derived from a progenitor strain resistant to atherosclerosis in that F2 mice homozygous for the BALB allele had a larger atherosclerotic lesion than those homozygous for the SM allele. However, it is somewhat surprising that for all of the 3 crosses that have mapped the chromosome 10 QTLs, the high allele is derived from an atherosclerosis-resistant strain and the low allele derived from a susceptible strain.
The reason why the effect of Ath11 or Ath48 on atherosclerosis has not shown up in the high allele progenitor strains is unknown. The finding from our studies of C3H/HeJ mice suggests that the action of some QTLs is dependent on the presence of another QTL. Despite carrying multiple atherosclerosis susceptibility QTLs, including Ath28 on chromosome 2 and Ath33 on chromosome 15 (Rowlan et al. 2013), C3H/HeJ mice are extremely resistant to atherosclerosis. However, after their H2k haplotype (murine major histocompatibility complex) is replaced with the H2b haplotype and bone marrow is reconstituted with syngeneic marrow, C3H/HeJ mice developed 4-fold larger atherosclerotic lesions than atherosclerosis-susceptible B6 mice (Shi et al. 2010).
By examining genes containing SNPs that are shared among the high allele strains (BALB, FVB, 129) but different from those shared by the low allele strains (C57BL/6J, SM/J), we have reduced the number of candidate genes for Ath48 down to 12. This analysis is based on the assumption that most genetic variations between mouse strains are ancestral and inherited primarily from their progenitors M. m. musculus and M. m. domesticus (Wade et al. 2002). All strains carrying an allele that results in a high value for a given trait often share the same ancestral allele harboring the underlying causal gene, while strains carrying an allele that produces a low value for the trait share a different ancestral allele (Peters et al. 2007). Because a QTL is derived from changes in the function or the amount of a gene product, we have focused on genes that carry a nonsynonymous SNP or a SNP in upstream regulatory region segregating between the high allele and the low allele strains of the QTL crosses. Tnfaip3 is located precisely underneath the linkage curve peak and contains two nonsynonymous SNPs and one SNP in the upstream regulatory region segregating between the high allele and low allele progenitor strains. The two nonsynonymous SNPs occur in the conserved coding regions and have led to changes in the 3D structure of Tnfaip3 protein in the high-allele strains. Tnfaip3 encodes the TNF alpha induced protein 3, which exerts a potent anti-inflammatory function in endothelial cells and smooth muscle cells by inhibiting NF-κB activation (Cooper et al. 1996)(Patel et al. 2006). Haploinsufficiency of Tnfaip3 increased atherosclerosis while overexpression of Tnfaip3 suppressed atherosclerosis in Apoe−/− mice (Wolfrum et al. 2007). We found that Tnfaip3 was more abundantly expressed in the liver of the high allele BALB strain than the low allele B6 strain, which might reflect a compensatory change in response to the insufficiency of protein function in the high allele strain.
Raet1e is also a likely candidate gene for Ath48. This gene is highly polymorphic between the high allele and low allele strains, with multiple SNPs leading to amino acid substitutions. Increased expression of Raet1e in the aorta suppresses atherosclerosis in either subcongenic or transgenic mice (Rodriguez et al. 2013).
The chromosome 9 QTL for atherosclerosis overlaps with Ath29, initially mapped in a B6 x C3H Apoe−/− intercross and then replicated in several mouse crosses (Su et al. 2006b)(Tomita et al. 2010)(Wang et al. 2007a)(Wang et al. 2007b). This QTL overlaps with a HDL QTL we recently identified using the same mouse cross (Shi et al. 2016). There was also a trend toward a significant correlation between HDL cholesterol levels and atherosclerotic lesion areas in this cross. In this regard, Sorl1, Sik3, and Apoa1 that affect lipid metabolism are strong candidate genes for Ath29. These genes each contain one or more SNPs segregating between the high allele strains and the low allele strains of the QTL cross (data not shown). Another promising candidate gene is Rcn2, which plays a key role in regulation of both basal and oxidized lipid-induced proinflammatory gene expression in endothelial cells (Manichaikul et al. 2011).
Recent human genetic studies suggest that LDL and triglycerides are causally related to risk of coronary heart disease (CHD) (Global Lipids Genetics Consortium et al. 2013),(Holmes et al. 2015). Genetic variants that increase LDL cholesterol or triglyceride levels result in an increased risk for CHD. The significant correlations of atherosclerotic lesion areas with non-HDL cholesterol and triglyceride levels observed in this cross suggest that the increased CHD risk is partially due to increased atherosclerotic lesion formation. For HDL, no association has been found between genetic variants and CHD risk once adjusted for triglycerides or LDL cholesterol in humans (Holmes et al. 2015). Accordingly, no significant correlation between HDL cholesterol levels and atherosclerotic lesion areas was observed in this cross or a previous cross (Su et al. 2006b).
We observed a marginal correlation between atherosclerotic lesion areas and plasma glucose levels in this cross. When fed a Western diet, both BALB-Apoe−/− and SM-Apoe−/− mice show significant increases in plasma glucose levels and atherosclerotic lesion areas (Liu et al. 2015). The small correlation suggests that other factors than plasma glucose contributed to aggravated atherosclerosis in the Apoe−/− mice.
In summary, we have identified a major QTL for atherosclerosis using a segregating F2 population, and further applied bioinformatics resources to prioritize Tnfaip3 as the most likely causal gene. As Tnfaip3 exerts effect through inhibition of the NF-κB pathway, our findings highlight the significance of anti-inflammatory action in atherogenesis and its potential for developing anti-atherosclerotic therapy.
Supplementary Material
Acknowledgments
This work was supported by NIH grants DK097120 and HL112281.
Footnotes
Author contributions
ENG sectioned samples and quantitated atherosclerotic lesions. ATG analyzed the data. JL analyzed candidate gene expression. MHC supervised morphometric analysis of atherosclerotic lesions. WS constructed the cross, collected samples and supervised the study. All authors read and edited the manuscript.
Conflict of interest
The authors declare no conflicting interests.
References
- Bachmann JM, Willis BL, Ayers CR, Khera A, Berry JD. Association between family history and coronary heart disease death across long-term follow-up in men: the Cooper Center Longitudinal Study. Circulation. 2012;125:3092–3098. doi: 10.1161/CIRCULATIONAHA.111.065490. [DOI] [PMC free article] [PubMed] [Google Scholar]
- CARDIoGRAMplusC4D Consortium. Deloukas P, Kanoni S, Willenborg C, Farrall M, Assimes TL, Thompson JR, Ingelsson E, Saleheen D, Erdmann J, Goldstein BA, Stirrups K, Konig IR, Cazier JB, Johansson A, Hall AS, Lee JY, Willer CJ, Chambers JC, Esko T, Folkersen L, Goel A, Grundberg E, Havulinna AS, Ho WK, Hopewell JC, Eriksson N, Kleber ME, Kristiansson K, Lundmark P, Lyytikainen LP, Rafelt S, Shungin D, Strawbridge RJ, Thorleifsson G, Tikkanen E, Van Zuydam N, Voight BF, Waite LL, Zhang W, Ziegler A, Absher D, Altshuler D, Balmforth AJ, Barroso I, Braund PS, Burgdorf C, Claudi-Boehm S, Cox D, Dimitriou M, Do R, DIAGRAM Consortium CARDIOGENICS Consortium Doney AS, El Mokhtari N, Eriksson P, Fischer K, Fontanillas P, Franco-Cereceda A, Gigante B, Groop L, Gustafsson S, Hager J, Hallmans G, Han BG, Hunt SE, Kang HM, Illig T, Kessler T, Knowles JW, Kolovou G, Kuusisto J, Langenberg C, Langford C, Leander K, Lokki ML, Lundmark A, McCarthy MI, Meisinger C, Melander O, Mihailov E, Maouche S, Morris AD, Muller-Nurasyid M, MuTHER Consortium Nikus K, Peden JF, Rayner NW, Rasheed A, Rosinger S, Rubin D, Rumpf MP, Schafer A, Sivananthan M, Song C, Stewart AF, Tan ST, Thorgeirsson G, van der Schoot CE, Wagner PJ, Wellcome Trust Case Control Consortium Wells GA, Wild PS, Yang TP, Amouyel P, Arveiler D, Basart H, Boehnke M, Boerwinkle E, Brambilla P, Cambien F, Cupples AL, de Faire U, Dehghan A, Diemert P, Epstein SE, Evans A, Ferrario MM, Ferrieres J, Gauguier D, Go AS, Goodall AH, Gudnason V, Hazen SL, Holm H, Iribarren C, Jang Y, Kahonen M, Kee F, Kim HS, Klopp N, Koenig W, Kratzer W, Kuulasmaa K, Laakso M, Laaksonen R, Lee JY, Lind L, Ouwehand WH, Parish S, Park JE, Pedersen NL, Peters A, Quertermous T, Rader DJ, Salomaa V, Schadt E, Shah SH, Sinisalo J, Stark K, Stefansson K, Tregouet DA, Virtamo J, Wallentin L, Wareham N, Zimmermann ME, Nieminen MS, Hengstenberg C, Sandhu MS, Pastinen T, Syvanen AC, Hovingh GK, Dedoussis G, Franks PW, Lehtimaki T, Metspalu A, Zalloua PA, Siegbahn A, Schreiber S, Ripatti S, Blankenberg SS, Perola M, Clarke R, Boehm BO, O’Donnell C, Reilly MP, Marz W, Collins R, Kathiresan S, Hamsten A, Kooner JS, Thorsteinsdottir U, Danesh J, Palmer CN, Roberts R, Watkins H, Schunkert H, Samani NJ. Large-scale association analysis identifies new risk loci for coronary artery disease. Nat Genet. 2013;45:25–33. doi: 10.1038/ng.2480. [DOI] [PMC free article] [PubMed] [Google Scholar]
- Cooper JT, Stroka DM, Brostjan C, Palmetshofer A, Bach FH, Ferran C. A20 blocks endothelial cell activation through a NF-kappaB-dependent mechanism. J Biol Chem. 1996;271:18068–18073. doi: 10.1074/jbc.271.30.18068. [DOI] [PubMed] [Google Scholar]
- Dansky HM, Shu P, Donavan M, Montagno J, Nagle DL, Smutko JS, Roy N, Whiteing S, Barrios J, McBride TJ, Smith JD, Duyk G, Breslow JL, Moore KJ. A phenotype-sensitizing Apoe-deficient genetic background reveals novel atherosclerosis predisposition loci in the mouse. Genetics. 2002;160:1599–1608. doi: 10.1093/genetics/160.4.1599. [DOI] [PMC free article] [PubMed] [Google Scholar]
- global Lipids Genetics Consortium Willer CJ, Schmidt EM, Sengupta S, Peloso GM, Gustafsson S, Kanoni S, Ganna A, Chen J, Buchkovich ML, Mora S, Beckmann JS, Bragg-Gresham JL, Chang HY, Demirkan A, Den Hertog HM, Do R, Donnelly LA, Ehret GB, Esko T, Feitosa MF, Ferreira T, Fischer K, Fontanillas P, Fraser RM, Freitag DF, Gurdasani D, Heikkila K, Hypponen E, Isaacs A, Jackson AU, Johansson A, Johnson T, Kaakinen M, Kettunen J, Kleber ME, Li X, Luan J, Lyytikainen LP, Magnusson PK, Mangino M, Mihailov E, Montasser ME, Muller-Nurasyid M, Nolte IM, O’Connell JR, Palmer CD, Perola M, Petersen AK, Sanna S, Saxena R, Service SK, Shah S, Shungin D, Sidore C, Song C, Strawbridge RJ, Surakka I, Tanaka T, Teslovich TM, Thorleifsson G, Van den Herik EG, Voight BF, Volcik KA, Waite LL, Wong A, Wu Y, Zhang W, Absher D, Asiki G, Barroso I, Been LF, Bolton JL, Bonnycastle LL, Brambilla P, Burnett MS, Cesana G, Dimitriou M, Doney AS, Doring A, Elliott P, Epstein SE, Eyjolfsson GI, Gigante B, Goodarzi MO, Grallert H, Gravito ML, Groves CJ, Hallmans G, Hartikainen AL, Hayward C, Hernandez D, Hicks AA, Holm H, Hung YJ, Illig T, Jones MR, Kaleebu P, Kastelein JJ, Khaw KT, Kim E, Klopp N, Komulainen P, Kumari M, Langenberg C, Lehtimaki T, Lin SY, Lindstrom J, Loos RJ, Mach F, McArdle WL, Meisinger C, Mitchell BD, Muller G, Nagaraja R, Narisu N, Nieminen TV, Nsubuga RN, Olafsson I, Ong KK, Palotie A, Papamarkou T, Pomilla C, Pouta A, Rader DJ, Reilly MP, Ridker PM, Rivadeneira F, Rudan I, Ruokonen A, Samani N, Scharnagl H, Seeley J, Silander K, Stancakova A, Stirrups K, Swift AJ, Tiret L, Uitterlinden AG, van Pelt LJ, Vedantam S, Wainwright N, Wijmenga C, Wild SH, Willemsen G, Wilsgaard T, Wilson JF, Young EH, Zhao JH, Adair LS, Arveiler D, Assimes TL, Bandinelli S, Bennett F, Bochud M, Boehm BO, Boomsma DI, Borecki IB, Bornstein SR, Bovet P, Burnier M, Campbell H, Chakravarti A, Chambers JC, Chen YD, Collins FS, Cooper RS, Danesh J, Dedoussis G, de Faire U, Feranil AB, Ferrieres J, Ferrucci L, Freimer NB, Gieger C, Groop LC, Gudnason V, Gyllensten U, Hamsten A, Harris TB, Hingorani A, Hirschhorn JN, Hofman A, Hovingh GK, Hsiung CA, Humphries SE, Hunt SC, Hveem K, Iribarren C, Jarvelin MR, Jula A, Kahonen M, Kaprio J, Kesaniemi A, Kivimaki M, Kooner JS, Koudstaal PJ, Krauss RM, Kuh D, Kuusisto J, Kyvik KO, Laakso M, Lakka TA, Lind L, Lindgren CM, Martin NG, Marz W, McCarthy MI, McKenzie CA, Meneton P, Metspalu A, Moilanen L, Morris AD, Munroe PB, Njolstad I, Pedersen NL, Power C, Pramstaller PP, Price JF, Psaty BM, Quertermous T, Rauramaa R, Saleheen D, Salomaa V, Sanghera DK, Saramies J, Schwarz PE, Sheu WH, Shuldiner AR, Siegbahn A, Spector TD, Stefansson K, Strachan DP, Tayo BO, Tremoli E, Tuomilehto J, Uusitupa M, van Duijn CM, Vollenweider P, Wallentin L, Wareham NJ, Whitfield JB, Wolffenbuttel BH, Ordovas JM, Boerwinkle E, Palmer CN, Thorsteinsdottir U, Chasman DI, Rotter JI, Franks PW, Ripatti S, Cupples LA, Sandhu MS, Rich SS, Boehnke M, Deloukas P, Kathiresan S, Mohlke KL, Ingelsson E, Abecasis GR. Discovery and refinement of loci associated with lipid levels. Nat Genet. 2013;45:1274–1283. doi: 10.1038/ng.2797. [DOI] [PMC free article] [PubMed] [Google Scholar]
- Grainger AT, Jones MB, Li J, Chen MH, Manichaikul A, Shi W. Genetic analysis of atherosclerosis identifies a major susceptibility locus in the major histocompatibility complex of mice. Atherosclerosis. 2016;254:124–132. doi: 10.1016/j.atherosclerosis.2016.10.011. [DOI] [PMC free article] [PubMed] [Google Scholar]
- Holmes MV, Asselbergs FW, Palmer TM, Drenos F, Lanktree MB, Nelson CP, Dale CE, Padmanabhan S, Finan C, Swerdlow DI, Tragante V, van Iperen EP, Sivapalaratnam S, Shah S, Elbers CC, Shah T, Engmann J, Giambartolomei C, White J, Zabaneh D, Sofat R, McLachlan S, UCLEB consortium Doevendans PA, Balmforth AJ, Hall AS, North KE, Almoguera B, Hoogeveen RC, Cushman M, Fornage M, Patel SR, Redline S, Siscovick DS, Tsai MY, Karczewski KJ, Hofker MH, Verschuren WM, Bots ML, van der Schouw YT, Melander O, Dominiczak AF, Morris R, Ben-Shlomo Y, Price J, Kumari M, Baumert J, Peters A, Thorand B, Koenig W, Gaunt TR, Humphries SE, Clarke R, Watkins H, Farrall M, Wilson JG, Rich SS, de Bakker PI, Lange LA, Davey Smith G, Reiner AP, Talmud PJ, Kivimaki M, Lawlor DA, Dudbridge F, Samani NJ, Keating BJ, Hingorani AD, Casas JP. Mendelian randomization of blood lipids for coronary heart disease. Eur Heart J. 2015;36:539–550. doi: 10.1093/eurheartj/eht571. [DOI] [PMC free article] [PubMed] [Google Scholar]
- Ishibashi S, Goldstein JL, Brown MS, Herz J, Burns DK. Massive xanthomatosis and atherosclerosis in cholesterol-fed low density lipoprotein receptor-negative mice. J Clin Invest. 1994;93:1885–1893. doi: 10.1172/JCI117179. [DOI] [PMC free article] [PubMed] [Google Scholar]
- Ishimori N, Li R, Kelmenson PM, Korstanje R, Walsh KA, Churchill GA, Forsman-Semb K, Paigen B. Quantitative trait loci analysis for plasma HDL-cholesterol concentrations and atherosclerosis susceptibility between inbred mouse strains C57BL/6J and 129S1/SvImJ. Arterioscler Thromb Vasc Biol. 2004;24:161–166. doi: 10.1161/01.ATV.0000104027.52895.D7. [DOI] [PubMed] [Google Scholar]
- Liu S, Li J, Chen MH, Liu Z, Shi W. Variation in Type 2 Diabetes-Related Phenotypes among Apolipoprotein E-Deficient Mouse Strains. PLoS One. 2015;10:e0120935. doi: 10.1371/journal.pone.0120935. [DOI] [PMC free article] [PubMed] [Google Scholar]
- Lloyd-Jones DM, Nam BH, D’Agostino RBS, Levy D, Murabito JM, Wang TJ, Wilson PW, O’Donnell CJ. Parental cardiovascular disease as a risk factor for cardiovascular disease in middle-aged adults: a prospective study of parents and offspring. JAMA. 2004;291:2204–2211. doi: 10.1001/jama.291.18.2204. [DOI] [PubMed] [Google Scholar]
- Manichaikul A, Wang Q, Shi YL, Zhang Z, Leitinger N, Shi W. Characterization of Ath29, a major mouse atherosclerosis susceptibility locus, and identification of Rcn2 as a novel regulator of cytokine expression. Am J Physiol Heart Circ Physiol. 2011;301:H1056–H1061. doi: 10.1152/ajpheart.00366.2011. [DOI] [PMC free article] [PubMed] [Google Scholar]
- Marenberg ME, Risch N, Berkman LF, Floderus B, de Faire U. Genetic susceptibility to death from coronary heart disease in a study of twins. N Engl J Med. 1994;330:1041–1046. doi: 10.1056/NEJM199404143301503. [DOI] [PubMed] [Google Scholar]
- Mozaffarian D, Benjamin EJ, Go AS, Arnett DK, Blaha MJ, Cushman M, de Ferranti S, Despres JP, Fullerton HJ, Howard VJ, Huffman MD, Judd SE, Kissela BM, Lackland DT, Lichtman JH, Lisabeth LD, Liu S, Mackey RH, Matchar DB, McGuire DK, Mohler ER, 3rd, Moy CS, Muntner P, Mussolino ME, Nasir K, Neumar RW, Nichol G, Palaniappan L, Pandey DK, Reeves MJ, Rodriguez CJ, Sorlie PD, Stein J, Towfighi A, Turan TN, Virani SS, Willey JZ, Woo D, Yeh RW, Turner MB American Heart Association Statistics Committee and Stroke Statistics Subcommittee. Heart disease and stroke statistics--2015 update: a report from the American Heart Association. Circulation. 2015;131:e29–e322. doi: 10.1161/CIR.0000000000000152. [DOI] [PubMed] [Google Scholar]
- Nakashima Y, Plump AS, Raines EW, Breslow JL, Ross R. ApoE-deficient mice develop lesions of all phases of atherosclerosis throughout the arterial tree. Arterioscler Thromb. 1994;14:133–140. doi: 10.1161/01.atv.14.1.133. [DOI] [PubMed] [Google Scholar]
- Nikpay M, Goel A, Won HH, Hall LM, Willenborg C, Kanoni S, Saleheen D, Kyriakou T, Nelson CP, Hopewell JC, Webb TR, Zeng L, Dehghan A, Alver M, Armasu SM, Auro K, Bjonnes A, Chasman DI, Chen S, Ford I, Franceschini N, Gieger C, Grace C, Gustafsson S, Huang J, Hwang SJ, Kim YK, Kleber ME, Lau KW, Lu X, Lu Y, Lyytikainen LP, Mihailov E, Morrison AC, Pervjakova N, Qu L, Rose LM, Salfati E, Saxena R, Scholz M, Smith AV, Tikkanen E, Uitterlinden A, Yang X, Zhang W, Zhao W, de Andrade M, de Vries PS, van Zuydam NR, Anand SS, Bertram L, Beutner F, Dedoussis G, Frossard P, Gauguier D, Goodall AH, Gottesman O, Haber M, Han BG, Huang J, Jalilzadeh S, Kessler T, Konig IR, Lannfelt L, Lieb W, Lind L, Lindgren CM, Lokki ML, Magnusson PK, Mallick NH, Mehra N, Meitinger T, Memon FU, Morris AP, Nieminen MS, Pedersen NL, Peters A, Rallidis LS, Rasheed A, Samuel M, Shah SH, Sinisalo J, Stirrups KE, Trompet S, Wang L, Zaman KS, Ardissino D, Boerwinkle E, Borecki IB, Bottinger EP, Buring JE, Chambers JC, Collins R, Cupples LA, Danesh J, Demuth I, Elosua R, Epstein SE, Esko T, Feitosa MF, Franco OH, Franzosi MG, Granger CB, Gu D, Gudnason V, Hall AS, Hamsten A, Harris TB, Hazen SL, Hengstenberg C, Hofman A, Ingelsson E, Iribarren C, Jukema JW, Karhunen PJ, Kim BJ, Kooner JS, Kullo IJ, Lehtimaki T, Loos RJ, Melander O, Metspalu A, Marz W, Palmer CN, Perola M, Quertermous T, Rader DJ, Ridker PM, Ripatti S, Roberts R, Salomaa V, Sanghera DK, Schwartz SM, Seedorf U, Stewart AF, Stott DJ, Thiery J, Zalloua PA, O’Donnell CJ, Reilly MP, Assimes TL, Thompson JR, Erdmann J, Clarke R, Watkins H, Kathiresan S, McPherson R, Deloukas P, Schunkert H, Samani NJ, Farrall M, CARDIoGRAMplusC4D Consortium A comprehensive 1,000 Genomes-based genome-wide association meta-analysis of coronary artery disease. Nat Genet. 2015;47:1121–1130. doi: 10.1038/ng.3396. [DOI] [PMC free article] [PubMed] [Google Scholar]
- Nishina PM, Wang J, Toyofuku W, Kuypers FA, Ishida BY, Paigen B. Atherosclerosis and plasma and liver lipids in nine inbred strains of mice. Lipids. 1993;28:599–605. doi: 10.1007/BF02536053. [DOI] [PubMed] [Google Scholar]
- Patel VI, Daniel S, Longo CR, Shrikhande GV, Scali ST, Czismadia E, Groft CM, Shukri T, Motley-Dore C, Ramsey HE, Fisher MD, Grey ST, Arvelo MB, Ferran C. A20, a modulator of smooth muscle cell proliferation and apoptosis, prevents and induces regression of neointimal hyperplasia. FASEB J. 2006;20:1418–1430. doi: 10.1096/fj.05-4981com. [DOI] [PubMed] [Google Scholar]
- Peters LL, Robledo RF, Bult CJ, Churchill GA, Paigen BJ, Svenson KL. The mouse as a model for human biology: a resource guide for complex trait analysis. Nat Rev Genet. 2007;8:58–69. doi: 10.1038/nrg2025. [DOI] [PubMed] [Google Scholar]
- Rodriguez JM, Wolfrum S, Robblee M, Chen KY, Gilbert ZN, Choi JH, Teupser D, Breslow JL. Altered expression of Raet1e, a major histocompatibility complex class 1-like molecule, underlies the atherosclerosis modifier locus Ath11 10b. Circ Res. 2013;113:1054–1064. doi: 10.1161/CIRCRESAHA.113.302052. [DOI] [PMC free article] [PubMed] [Google Scholar]
- Rowlan JS, Li Q, Manichaikul A, Wang Q, Matsumoto AH, Shi W. Atherosclerosis susceptibility Loci identified in an extremely atherosclerosis-resistant mouse strain. J Am Heart Assoc. 2013;2:e000260. doi: 10.1161/JAHA.113.000260. [DOI] [PMC free article] [PubMed] [Google Scholar]
- Shi W, Wang Q, Choi W, Li J. Mapping and Congenic Dissection of Genetic Loci Contributing to Hyperglycemia and Dyslipidemia in Mice. PLoS One. 2016;11:e0148462. doi: 10.1371/journal.pone.0148462. [DOI] [PMC free article] [PubMed] [Google Scholar]
- Shi W, Zhang Z, Chen MH, Angle JF, Matsumoto AH. Genes within the MHC region have a dramatic influence on radiation-enhanced atherosclerosis in mice. Circ Cardiovasc Genet. 2010;3:409–413. doi: 10.1161/CIRCGENETICS.110.957449. [DOI] [PMC free article] [PubMed] [Google Scholar]
- Su Z, Li Y, James JC, Matsumoto AH, Helm GA, Lusis AJ, Shi W. Genetic linkage of hyperglycemia, body weight and serum amyloid-P in an intercross between C57BL/6 and C3H apolipoprotein E-deficient mice. Hum Mol Genet. 2006a;15:1650–1658. doi: 10.1093/hmg/ddl088. [DOI] [PubMed] [Google Scholar]
- Su Z, Li Y, James JC, McDuffie M, Matsumoto AH, Helm GA, Weber JL, Lusis AJ, Shi W. Quantitative trait locus analysis of atherosclerosis in an intercross between C57BL/6 and C3H mice carrying the mutant apolipoprotein E gene. Genetics. 2006b;172:1799–1807. doi: 10.1534/genetics.105.051912. [DOI] [PMC free article] [PubMed] [Google Scholar]
- Tomita H, Zhilicheva S, Kim S, Maeda N. Aortic arch curvature and atherosclerosis have overlapping quantitative trait loci in a cross between 129S6/SvEvTac and C57BL/6J apolipoprotein E-null mice. Circ Res. 2010;106:1052–1060. doi: 10.1161/CIRCRESAHA.109.207175. [DOI] [PMC free article] [PubMed] [Google Scholar]
- Wade CM, Kulbokas EJ, 3rd, Kirby AW, Zody MC, Mullikin JC, Lander ES, Lindblad-Toh K, Daly MJ. The mosaic structure of variation in the laboratory mouse genome. Nature. 2002;420:574–578. doi: 10.1038/nature01252. [DOI] [PubMed] [Google Scholar]
- Wang Q, Grainger AT, Manichaikul A, Farber E, Onengut-Gumuscu S, Shi W. Genetic linkage of hyperglycemia and dyslipidemia in an intercross between BALB/cJ and SM/J Apoe-deficient mouse strains. BMC Genet. 2015;16:133. doi: 10.1186/s12863-015-0292-y. [DOI] [PMC free article] [PubMed] [Google Scholar]
- Wang SS, Schadt EE, Wang H, Wang X, Ingram-Drake L, Shi W, Drake TA, Lusis AJ. Identification of pathways for atherosclerosis in mice: integration of quantitative trait locus analysis and global gene expression data. Circ Res. 2007a;101:e11–e30. doi: 10.1161/CIRCRESAHA.107.152975. [DOI] [PubMed] [Google Scholar]
- Wang SS, Shi W, Wang X, Velky L, Greenlee S, Wang MT, Drake TA, Lusis AJ. Mapping, genetic isolation, and characterization of genetic loci that determine resistance to atherosclerosis in C3H mice. Arterioscler Thromb Vasc Biol. 2007b;27:2671–2676. doi: 10.1161/ATVBAHA.107.148106. [DOI] [PubMed] [Google Scholar]
- Wolfrum S, Teupser D, Tan M, Chen KY, Breslow JL. The protective effect of A20 on atherosclerosis in apolipoprotein E-deficient mice is associated with reduced expression of NF-kappaB target genes. Proc Natl Acad Sci U S A. 2007;104:18601–18606. doi: 10.1073/pnas.0709011104. [DOI] [PMC free article] [PubMed] [Google Scholar]
Associated Data
This section collects any data citations, data availability statements, or supplementary materials included in this article.


