Abstract
Different types of genomic aberration may simultaneously contribute to tumorigenesis. To obtain a more accurate prognostic assessment to guide therapeutic regimen choice for cancer patients, the heterogeneous multi-omic data should be integrated harmoniously, which can often be difficult. For this purpose, we propose a Gene Interaction Regularized Elastic Net (GIREN) model that predicts clinical outcome by integrating multiple data types. GIREN conveniently embraces both gene measurements and gene-gene interaction information under an elastic net formulation, enforcing structure sparsity and the “grouping effect” in solution to select the discriminate features with prognostic value. An iterative gradient descent algorithm is also developed to solve the model with regularized optimization. GIREN was applied to human ovarian cancer and breast cancer datasets obtained from The Cancer Genome Atlas, respectively. Result shows that, the proposed GIREN algorithm obtained more accurate and robust performance over competing algorithms (LASSO, Elastic Net and superPC, with or without average pathway expression features) in predicting cancer progression on both two datasets in terms of median Area Under Curve (AUC) and Interquartile Range (IQR), suggesting a promising direction for more effective integration of gene measurement and gene interaction information.
Index Terms: elastic net, gene expression, DNA methylation, TRANSFAC, protein-protein interaction, gene-gene interaction, microarray, classification, survival prediction
1 INTRODUCTION
CANCER progression can be quite different between patients, yet the patients were often treated with the same therapeutic regimen. To improve the efficacy of medical treatment, the cancer patients are now often further classified into a few subtypes (or risk groups) based on their bio-molecular markers to guide the physicians in the choice of the most appropriate therapy[1], and it is thus urgent to improve the ability to make accurate prognostic assessments [2].
Recently, high throughput (HT) technologies, such as microarray and next generation sequencing, enabled the global unbiased comparison of gene expression profiles between healthy and diseased tissues and between patients having different responses to the same drug therapy[3]. Since last decade, several techniques in the literature have studied the clinical outcome prediction based on microarray data. A semi-supervised PCA (Principle Component Analysis) method was proposed to predict patient survival time based on gene expression data [4]. An integrative method was proposed to predict the outcome by integrating four different genomic profiles (mRNA, DNA methylation, DNA copy number alteration and microRNA) [5]. Other methods similar to Google’s PageRank algorithm together with other algorithms were also proposed in recent studies on predicting disease progression and patient survival variables from gene expression data in order to personalize treatment options[6].
Many different types of aberrations are known to present in cancer genome, such as, DNA methylation, DNA copy number variation, post-transcriptional RNA modifications, etc. These genomic changes may affect the expression level of gene, alter the function of gene product, and ultimately contribute to tumorigenesis [7, 8]. For instance, genome-wide hypo-methylation causes genome instability; while the hyper-methylation of CpG islands in cancer has often been associated with inactivation of tumor suppressor genes. It was recently shown that cancer-and tissue-specific methylation variation in adjacent regions, termed CpG island shores, is also related to gene expression change [9]. Besides, genes are more likely to be repressed when they locate in partially methylated domains [10] or long hypo-methylated domains [11] in cancer. Nevertheless, the relative merits of DNA methylation and gene expression in predicting cancer stages and patient survival still remain poorly characterized in many cancers. Conceivably, gene expression profiles, methylation profiles and other gene measurements can be conveniently integrated to predict clinical outcome to improve the prediction performance. Naturally, the comprehensive characterization of complex disease calls for coordinated efforts to collect and integrate genome-scale data from large patient cohorts. A prime example of such coordinated effort is The Cancer Genome Atlas (TCGA: http://cancergenome.nih.gov), which currently profiles patients of a variety of cancers for different genomic profiles including gene expression, DNA methylation, DNA copy number, miRNA, etc. together with the clinical information such as age, gender, treatment received, survival time, etc. Translating these data types into effective diagnosis and prognosis strategies is the key goal for the TCGA project, which requires more effective tools designed to integrate these multi-dimensional, disparate genomic data and clinical features [12]. Such integrated analysis would be more likely to reveal important features that would otherwise be statistically insignificant. In addition, it will provide better insights into the mechanisms underpinning different phenotypes in cancer.
For classification purpose, gene measurement across different stages (or phenotypes, such as cancerous and health tissue) has been regarded as one of the most important factor for feature selection in classification. This concept has been widely used so far for classification of disease or for prediction clinical outcomes [5, 13] based on various bio-molecular data types. We call the correlation between gene measurements “between profile redundancy”. It refers to highly correlated features which are not favored for classification purpose. It has been pointed out that removal of the correlation between features can significantly improve the classification performance [14]. Given the prediction power of all the features are the same, for many classifiers, the prediction result based on 10 independent features are more likely to be better than that from 10 highly correlated features, because the independent features contain more information. In general, if multiple features are highly correlated, we want to use only one or a summarized measurement of them so as to reduce “between profile redundancy”. Please note that, “between profile redundancy” can be actually important for noise reduction at feature level, e.g., “between profile redundancy” may be used to generate more robust features of classifier with clustering approach [14–16] and pathway features may be generated from gene expression profiles with redundancy [17].
Additionally, gene-gene interactions have long been recognized to be fundamentally important for understanding genetic causes of complex disease traits [18]. The phenotype can often be considered as a result of underlying interplays between multiple key genes. Understanding gene interactions should be beneficial when we predict the progression outcome based on integrated genome information. In this paper, we call gene interaction information the“ within profile redundancy” for cancer progression prediction, which may represent different physical interactions such as protein/DNA interaction (transcription factor targets), protein-protein interaction (PPI), RNA-binding protein (RBP), etc. Conceivably, if multiple genes interact with each other, we don’t want to use all of them as predictor because the information they carry are inevitably correlated due to the interaction, even though this correlation may not directly observed on the gene measurement data available. Previously, the network information coupled with gene expression measurements has been used for marker gene prediction and classification [19–21]. Binder and Schumacher extended component-wise likelihood-based boosting techniques for incorporating pathway information so as to boost estimation of high-dimensional risk prediction models [17]. Gade et al. proposed to fuse miRNA and mRNA expression with correlations and miRNA target information to improve clinical outcome prediction in prostate cancer [22]. Edwards et al. developed an approach to analyze gene expression profiles under the framework of Bayesian network using transcription factor network [23]. All these approaches together with recent development [24–27] substantially expanded the prediction power and capacity of classifier in clinical outcome prediction.
In this paper, we propose a statistical framework, Gene Interaction Regularizing Elastic Net (GIREN), which conveniently integrates gene measurements and gene interaction information for cancer clinical outcome prediction. Developed rigorously based on Elastic Net, the model assumes a sparse learning machinery and seeks to simultaneously mitigate the “between profile redundancy” (from gene measurements) and “within profile redundancy” (from transcription factor targets and protein-protein interaction), systematically taking advantage of both the measurements data and the interaction data. Meanwhile, the prominent features of elastic net, i.e., grouping effect of correlated features and the sparsity in solution, are also inherited automatically by GIREN.
We tested the proposed method on two human cancer datasets obtained from The Cancer Genome Atlas (TCGA) with cross validation to predict cancer progression. Result shows that, by taking advantage of the interaction information, GIREN outperforms original elastic net and SuperPC significantly on both two datasets.
2 METHODS
2.1 Constraints Imposed by Sparsity
The goal of our work is to identify potential marker genes for cancer progression prediction, thus we designed an objective function with two components. The first component is based on the profile matrix X with dimension m × s, where m indicates the number of involved features, whiles indicates the number of samples. When there are more than one type of profile involved, e.g., there are both DNA methylation profile and gene expression profile, X can be constructed by concatenation by where X1 is the gene expression matrix with size of m1 × s, X2 is DNA methylation matrix with size of m2 × s, and m1 refers to the number of involved genes in gene expression matrix, while m2 refers to the number of involved locus in DNA methylation matrix. Thus, m=m1+m2.
The other component to be considered is the effect of gene-gene interactions [28]. To minimize the dependency of selected biomarkers, the goal is to obtain a set of sparse coefficients for genes with predictive merit for risk group prediction. For this purpose, we adopted an elastic net penalized regression formulation to capture the contributions of each gene for progression by achieving a sparse solution for coefficients, which helps to select marker-genes (or a specific stage of that gene). In order to mitigate the “between profile redundancy”, we made the hypothesis that there is no correlation between gene expression and methylation profile, i.e., the gene expression and methylation profile for each gene are modeled to be independent. In case two measurements of a gene, e.g., the expression and methylation level, is highly correlated, and this gene contributes greatly to the prognosis, then only one measurement should be selected from either-gene expression profile or methylation profile, i.e., the-model should exhibit “grouping effect” in its solution [29]. Genes which are highly correlated will be grouped into one set. In order to obtain “grouping effect”, the model should be strictly convex. Thus the objective function to be minimized so as to reduce “between profile redundancy” can be defined as:
| (1) |
where the input for the objective function is the concatenated matrix X, β is the coefficient of length m. It will refer to the selected genes with a sparse solution. y is a vector of length s, which indicates the clinical outcome, such as risk group indicator, the OS/PFS, etc., for the patients.
Due to the strictly convex characteristics for “grouping effect”, the “elastic net” penalty termed 0.5(1−α)║β║2+α║β║ is constrained with 0 <α<1. Thus, the “between profile dependency” can be effectively removed. In addition, this penalty also promotes sparsity which removes automatically the genes that do not contribute to the outcome y.
2.2 Constraints Imposed by Gene Interactions
In our proposed method, the prior knowledge also consists of various gene interactions, such as protein-protein interaction. Conceivably, genes interact with each other are functionally correlated, thus gene interaction information can in theory help to avoid the “within profile redundancy”. The goal of our method here is to define a gene interaction network based constrain such that any variables linked in the network are more likely to be placed into the same set so as to avoid redundancy. Let A denote the adjacency matrix derived from the constructed gene interaction network. A has value 0 or 1, with size m × m. aij=0 means the interaction between the i -th and j -th feature is weak, while aij=1 means the interaction is strong. To ensure genes with known interactions having similar coefficients such that they are more likely to be grouped together, we would like to maximize the total grouping effects reflected within gene-gene interaction network (or minimize the within profile redundancy), which can be define as the following objective function.
| (2) |
where Tr(·) refers to the trace of a matrix. Please note that O2 needs to be maximized, while O1 should be minimized.
2.3 Gene Interaction Regularized Elastic Net
An important characteristic of original elastic net method is that it can handle the “grouping effect”. We make the gene interaction as the regulation based on elastic net regression model to predict the risk group of cancer patients. The inputs in GIREN are the profile matrix X and gene-gene interaction network matrix A. And thus the total redundancy (or the objective function of GIREN) can be formulated as follows:
| (3) |
where parameters λ and γ are the weights for the elastic net penalty and gene interaction constraint, respectively. The objective function should be minimized to approach the optimization, i.e., minimizing both the “between profile redundancy” and the “within profile redundancy”.
2.4 Algorithm
In the original elastic net problems, the penalty is often required to be strictly convex such that the solution of coefficients in regression model keeps the“ grouping effect”. Therefore, the penalty in objective function (3) should also comply with stringent convex constrain.
The contour plot of β is shown in Fig. 1. Note that when γ/λ=0.5, the penalty still remains convex but not strictly convex. When the ratio is higher than 0.5, the penalty is not convex anymore. The penalty function is singular (without first derivative) at 0. In the first and third quadrant, the penalty function is strictly convex, while in the second and fourth quadrant, the penalty function becomes concave. Since our goal to identify the potential subset of genes that contribute most to the clinical outcome imposes the sparseness and “grouping effect” in the modular solution, we constrain the ratio γ/λ=0.5 to keep the stringent convexity characteristic, so as to preserve the “grouping effect” in its solution. That is, selected groups of genes will present the close value of coefficient. The higher correlated the genes are, the more close the returned coefficients will be. Based on the solution, genes that have high correlation between gene expression and methylation profile are only selected either from gene expression matrix or methylation matrix.
Fig. 1.
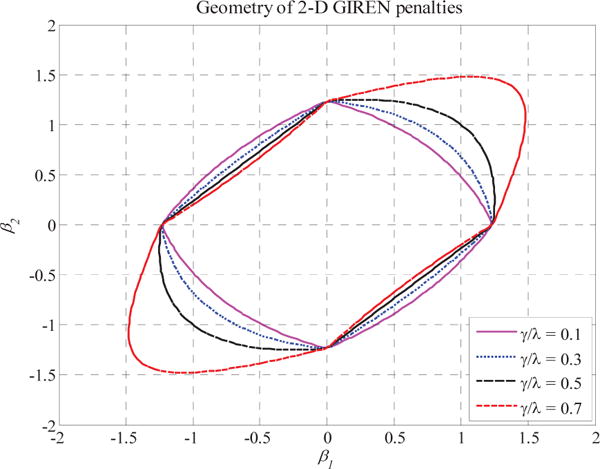
Two-dimensional contour plots for regressioncoefficients. The contour shows the shapes of GIREN penalties withdifferent weights. Different values of α do not change the strictly convex property of the contour, so we simply set α=0.5.
Since the penalty is strictly convex, we can follow an iterative gradient descent algorithm [30] to seek for the minimization of GIREN objective function. In order to achieve the optimization of (3), the updated value of βj is formulated as follows.
| (4) |
where S(z,γ)+ function is the soft-thresholding operator defined in [31].
| (5) |
We implemented GIREN in MATLAB (version 2011b) environment. The MATLAB code together with original dataset is available online (https://github.com/lzcyzm/GIREN) for testing and comparing with other approaches. The computational load is still relatively affordable on smaller dataset or after a feature selection procedure. The implementation steps can be summarized as the following:
|
| |||
| Implementation steps of GIREN algorithm | |||
| 1) | Initialize coefficients β, and set the iteration index to 1. Define the convergence criteria variable crit, and set crit=0 | ||
| 2) | In the t -th iteration, fix all the βt and calculate the value of objective function F with (3). | ||
| 3) | For j=1,⋯,m
|
||
| 4) | Fix the updated βt+1, and calculate the value of the objective function. That is, update the value of objective function Fnew with (3). | ||
| 5) | Update crit by (7).
|
||
| 6) | Repeat step 2)–5) until the convergence criterion is satisfied. That is, when crit is smaller than a predefined threshold. | ||
|
| |||
3 TESTS ON REAL DATA
3.1 Data and Preprocessing
The developed approach is tested on human ovarian and breast cancer datasets, respectively.
In ovarian cancer study, a total of 514 tumor samples and 12 normal samples with matching gene expression (Affymetrix U133A) and methylation profiles (Illumina HumanMethylation 27) are obtained. Since the chemotherapeutic response plays an important role in the progression of ovarian cancer, a rigorous sample selection process was applied to find eligible samples for outcome prediction following our previous protocol [32]. Specifically, we restrict samples to be specifically treated with paclitaxel and carboplatin: the treatment had to be started within 30 days after surgical resection and to last for at least 4 cycles. The censored samples whose survival time is shorter than the median of uncensored samples’ were removed from the analysis because we are unable to identify their belongings to the high or low-risk group. Those whose “reported survival time” is longer than median of uncensored samples are retained. As a result, there were only 79 samples remained, including 68 alive and 11 deceased ovarian cancer patients with survival time ranging from 16 to 3825 days. The gene expression matrix included normalized log2 expression level for 13262 genes. Methylation matrix includes the beta value for 27578 locus, each value referring to the percentage of methylation at a specific CpG site. The methylation percentages all underwent a reverse logistic transform such that they span the whole range of [−∞, +∞] Loci with missing values are removed from further analysis. Finally, the non-differentially expressed genes were eliminated with a two-sample t-test [33] (fold change<2, p-value<0.05). The non-differentially methylated locus were also removed by Mann-Whitney U-test [34] (fold change<1.23, p-value< 0.05). In the end, a panel of dataset including the 751 differential methylated locus and 900 differential expressed-genes were obtained for further study. Please note that some genes are both differentially expressed and differentially methylated.
In breast cancer study, 599 breast tumor samples were obtained with gene expression profile (Agilent G4502A). The censored samples that have shorter survival time than the median of uncensored samples were also removed. As a result, there were only 163 samples remained, including 82 alive and 81 deceased patients with survival time ranging from 157 to 7125 days. The gene expression matrix went through the same filtering processes as in ovarian cancer study. In the end, a panel of dataset including 2135 differentially expressed genes was obtained for further study.
Meanwhile, a gene-gene interaction network was constructed by combining the protein-DNA interaction data downloaded from TRANSFAC 7.0[35] and Bossi and Lehner’s human protein-protein interaction database [36] directly obtained from [37]. Different data types are integrated based on the mapping of HUGO Gene Nomenclature Committee gene symbols, and the gene-gene interactions that are not fully represent in the preprocessed data, i.e., both interacting genes are considered differential between cancerous and normal control conditions, are excluded from the analysis, the interaction matrix can then be generated based on the remained gene-gene interaction network and the remained features. This procedure-resulted in a network with 1651 gene interactions for ovarian cancer study and a network with 2135 gene interactions for breast cancer study. In addition, clinical information such as patient overall survival (OS) and progression free survival (PFS) of each sample was also obtained. OS is defined as the time between the initial surgical resection to the date of last follow-up or death and PFS is defined as the interval from the date of initial surgical resection to the date of progression, date of recurrence, or date of last known contact, if the patient was alive and had no cancer recurrence [5]. As is known, clinical decisions are usually binary, e.g., good vs. bad survival, or low-risk vs. high-risk patients. As such, we separated the samples into two classes, i.e., the low risk group (whose OS is longer than median OS) and the high risk group (whose OS is shorter than median OS).
As shown in Fig. 2, the goal is to predict risk group attribute given the bio-molecular profile of a patient and the general gene interaction information.
Fig. 2.
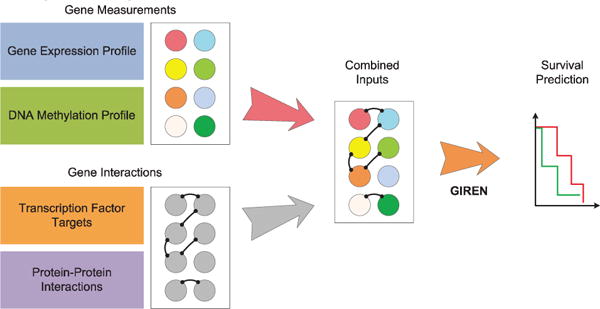
Overview of GIREN. The proposed method GIREN selects feature genes to predict clinical outcome based on integrated gene expression, DNA methylation and transcription factor targets and protein-protein interactions. The goal isto select feature genes that contribute to the risk grouping, and predict the survival (clinical outcome)of patients based bio-molecular profiling. It takes advantage not only gene measurements but also the gene interaction information (e.g., from protein-protein interaction).
3.1 Test on Ovarian Cancer Dataset
The proposed GIREN was firstly applied to the ovarian cancer dataset, including DNA methylation and gene expression profiles, to select feature genes that contribute most to the clinical outcome prediction by integrating multiple data sources. To optimize the parameters γ and λ under the constraint γ/λ<0.5, as well as the mixing parameter α, we implemented a 3D-grid search under the nested cross validation scheme. Specifically, we set γ/λ within the range [0.01, 0.5] with step-wise increment 0.01, and set λ within the range [0.1, 0.9] with step-wise increment 0.1, while α was set within the range [0.1, 0.9] with step-wise increment 0.1. That means in total, 4050 points are searched within the 3D mesh for optimization purpose under the specified constraint.
GIREN reported 132 feature genes from gene expression profile and 68 from DNA methylation profiles as signature genes for clinical outcome prediction. From the Venn Diagram shown in Fig.3, only “NOX4” [38] is selected in both DNA methylation and gene expression profiles. Note that, gene expression and DNA methylation may be correlated. Therefore, it is intuitive to expect that the gene expression and DNA methylation data of the same gene should carry similar predictive merit and are therefore likely to be redundant for prediction. This result clearly demonstrated the effectiveness of GIREN to remove this dependency. A close examination of “NOX4” also revealed that the correlation between its expression and methylation level is actually positive (Pearson correlation 0.21) rather than expected a negative value.
Fig. 3.
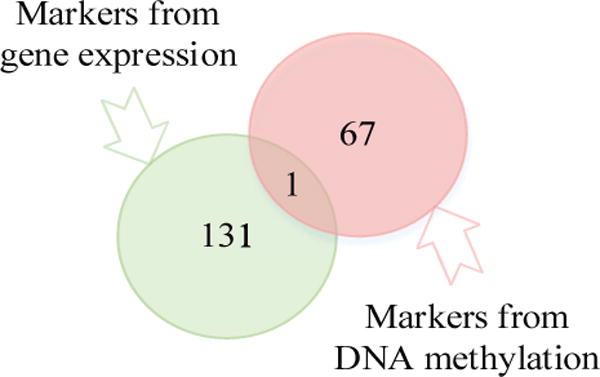
Venn diagram is shown for the feature genes from gene profile and methylation profile. In total, 199 genes were selected as feature genes that contribute most to the risk grouping in ovarian cancer. Only “NOX4” overlapped between gene expression and methylation profiles. Interestingly, the Pearson correlation between gene expression and DNA methylation level of “NOX4” is a positive value 0.21, whereas this relationship is usually assumed to be negative. To some degree, although not considered currently, the DNA methylation profile and RNA expression profile of the same gene are inevitably correlated due to biological mechanism, the fact that only one gene’s DNA methylation and RNA expression profile are both selected indicates also the relatively small “between profile redundancy” in the selected gene marks, which should facilitate the classification performance.
The interactions between the selected genes were further investigated in this article. Firstly, we calculated the degrees of each selected gene in the resulted gene list (shown in Fig.4). The “degree” indicates the number of interactions between this gene and the genes selected as markers. Most genes show degree of zero, i.e., these genes do not show interaction with others in the selected gene list. The goal of GIREN is to minimize feature correlation through: Firstly, observed correlation in gene measurement data. Secondly, (possibly unobserved) correlation indicated in gene interaction data. The small number of interactions among selected gene marks indicates the “within profile dependency” is successfully minimized to reduce dependency in the interaction layer. Please note that, this is different from topological analysis, which often favors highly connected hub genes.
Fig. 4.
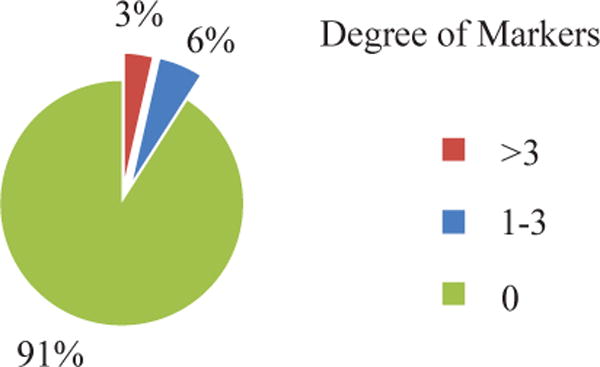
Degree of connectivity of the selected gene markers in ovarian cancer dataset. Most genes show degree of zero, which means these genes are not highly connected with the other genes in the selected list. Most genes show degree of zero, i.e., these genes do not show interaction with others in the selected gene list, indicating the “within-profile dependency” is successfully minimized to reduce dependency at interaction level.
Secondly, the number of first neighbor genes for the selected genes were further studied. The top five genes are shown in Table 1. Some of the genes are actively involved in the interaction with other genes. “MAGEA11” (Melanoma-associated antigen 11) has the most number of first neighbor genes. They have been found to be involved in the androgen and progesterone receptor signaling pathways, to be linked to several cancers, such as prostate and breast cancers [39]. “MCM10” (Minichromosome maintenance complex component 10) has been suggested to participate in the initiation of eukaryotic genome replication [40]. “LMO3” (LIM Domain Only 3) has been found to interact with famous tumor suppressor gene “TP53” and regulate its function [41]. “BLNK” (B-cell linker) has been reported to temporally and spatially coordinate and regulate signaling effectors downstream of B cell receptor [42].
Table 1.
Genes With Highest Degree of Connectivity
| Ranking | Gene | Gene Name | Number of Neighbors |
|---|---|---|---|
| 1 | MAGEA 11 | Melanoma antigen family A,11 | 64 |
| 2 | TP53 | Tumor protein p53 | 63 |
| 3 | MCM10 | Minichromosome maintenance complex component 10 | 23 |
| 4 | LMO3 | LIM domain only 3(rhombotin-like 2) | 16 |
| 5 | BLNK | B-cell linker | 10 |
The top five genes that have the most number of first neighbors are shown in this table. “MAGEA11” has 64first neighbor genes. “MCM10” has been found to be involved in the initiation ofeukaryotic genome replication. “LMO3” has been found to interact with famous tumorsuppressor gene “TP53” and regulates its function. “BLNK” has been reported totemporally and spatially coordinate and regulate signaling effectors downstream of the B cell receptor.
The “grouping effect” of GIREN was investigated by calculating the correlation coefficients between selected features. Grouping effect indicates that correlated features are more likely to be simultaneously selected or not selected. For ovarian cancer dataset, GIREN reported 200 genes as feature genes for prognosis, so we conducted a permutation that randomly selected 200 genes from all the genes in original dataset for 1000 times, then calculate the percentage of highly correlated genes. As shown in Fig.5, comparing with the randomly selected feature pairs, among which only average 22.3% are significantly correlated (with Pearson correlation p-value smaller than 0.05), and the percentage is much higher among GIREN selected features (36.7%). The increased percentage of significantly correlated features indicates potential grouping effect of features selected by GIREN.
Fig. 5.
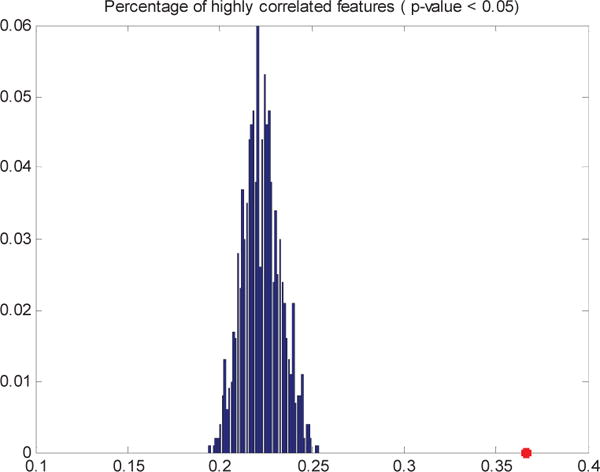
Comparison of percent of high correlation feature pairs in 1000 sets of randomly selected 200 features vs. GIREN selected features. The histogram in blue is the percent of highly correlated features based on 1000 sets of randomly selected 200 features. The star in red (36.7%) indicates the percent of highly correlated feature pairs in GIREN selected 200 features.
To explore the functions of the selected marker genes, gene ontology (GO) enrichment analysis [43] is used. As is shown in Table 2, many of the enriched functions are highly related to ovarian cancer mechanism, such as, defense response (p-value 4.59×10⁻⁶), immune response (p-value 2.77×10⁻⁵), cell motion, etc., which is consistent with previous studies. The gene ontology enrichment analysis was conducted at DAVID website [44] with default settings. Among the 199 genes, four of them are involved in “Basal-cell carcinoma pathway”, including TP53, BMP, Wnt and Frizzled. These genes are crucial in maintaining cell cycle, proliferation and cancer protection. Among the four genes, “TP53” is well known as a tumor suppressor that is involved in preventing cancer [45]. It plays an important role in apoptosis, genomic stability, and inhibition of angiogenesis. There are also some other genes involved in “innate immune response” and “regulation of cell proliferation process”, both of which are crucial for cancer development.
Table 2.
Gene Ontology Enrichment Analysis of Selected Marker Genes for Ovarian Cancer
| Term | Function | p-value | Genes | Fold Enrichment |
|---|---|---|---|---|
| GO:0006952 | Defense response | 4.59×10⁻⁶ | NOX4, GNLY, CXCL9, SOCS6, NLRX1, CXCL6, GAL, TLR7, CCL18, INHBB, CXCL13, HIST2H2BE, IL1RAP, AOX1, PLA2G7, MNDA, MGLL, VNN1, PTX3, DEFB1, CLEC5A, AOC3, BLNK | 3.085 |
| GO:0006955 | immune response | 2.77×10⁻⁵ | POU2AF1, AQP9, VTCN1, CXCL9, TP53, NLRX1, GEM, CXCL6, PF4V1, TLR7, CCL18, AZGP1, CXCL14, CXCL13, IL1RAP, IRF8, VNN1, CCBP2, IGKC, PTX3, DEFB1, CLEC5A, BLNK | 2.750 |
| GO:0006954 | Inflammatoryresponse | 3.88×10⁻⁵ | NOX4, CXCL9, CXCL6, GAL, TLR7, CCL18, CXCL13, IL1RAP, AOX1, PLA2G7, VNN1, MGLL, PTX3, AOC3, BLNK | 3.807 |
| GO:0007267 | cell-cell signaling | 9.20×10⁻⁴ | BMP4, NRP1, TRHDE, KCND2, EFNB2, CXCL9, GRIN2A, ATP1A2, CXCL6, GAL, PCDHB10, CCL18, LHX1, CXCL14, SEMA3B, HTR3A | 2.475 |
| GO:0003013 | circulatory systemprocess | 1.86×10⁻³ | ACSM3, HOXB2, NPY, NTS, GUCY1A3, GUCY1B3, ATP1A2, HTR2B, ADIPOQ | 3.991 |
| GO:0042493 | response to drug | 1.57×10⁻² | ACSL1, CA9, HMGCS2, EMX2, GRIN2A, TP53, GAL, ADIPOQ | 3.055 |
| GO:0010721 | negative regulation of cell development | 2.0×10⁻² | BMP4, NRP1, TP53, ID4 | 6.874 |
A number of gene functions are significantly enriched in the identified marker genes. Many of the enriched functions are highly related to ovarian cancer mechanism, such as, defense response (p-value 4.59×10⁻⁶), immune response (p-value 2.77×10⁻⁵), cell motion, etc., which is consistent with previous studies. The gene ontology enrichment analysis was conducted at DAVID website[43]with default settings.
As comparison, we also applied LASSO, Elastic Net, and Supervised PCA (SuperPC) to original gene measurements or average pathway expression (APE). APE was used to further integrate the pathway information into other standalone approaches as the gene-interaction module for a fair comparison with GIREN. With 100 times of 3 fold-cross validation, the outcome prediction performances of selected genes are summarized in Fig. 6. In terms of median AUC and Interquartile range (IQR), GIREN achieved higher and more robust performance than the other competing approaches in predicting the risk group of the ovarian cancer patients. It is worth mentioning that, compared with the original approaches, using average pathway expression not necessarily always improves classification performance.
Fig. 6.
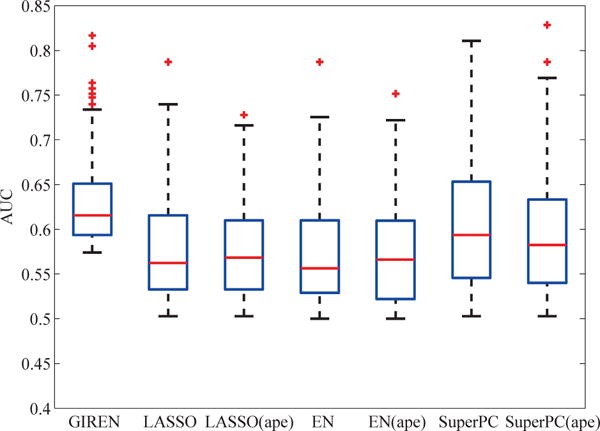
Progression prediction performance based on the gene list selected by GIREN, LASSO, Elastic Net and SuperPC with original gene measurement or average pathway expression in ovarian cancer GIREN achieved the best performance among the 7 tested methods in term of the “area under curve” (AUC), indicating an improved accuracy of the proposed method in predicting the risk group of the ovarian cancer patients. 79 patients were involved in this test, and ten times of 3-fold cross validation was conducted to evaluate the performance. For LASSO method, the weight coefficient α is set to be 0.31 by cross-validation. For Elastic Net method, the weight coefficient α and λ were set to be 0.4 and 0.6 respectively by cross-validation. For GIREN, the weight coefficients α, λ, and γ were set to be 0.4, 0.4 and 0.08, respectively according to cross-validation.
3.2 Test on Breast Cancer Dataset
We in the next test GIREN on the breast cancer dataset. Similar to the ovarian cancer case study, we also applied LASSO, Elastic Net, and Supervised PCA to original gene measurements or average pathway expression (APE) as comparison.
GIREN reported 111 feature genes from gene expression profile as signature genes for clinical outcome prediction. The interactions of the selected genes were then investigated. As shown in Fig. 7, most genes in the list has degree of zero, indicating again the “within profile dependency” is successfully minimized with proposed algorithm to reduce dependency.
Fig. 7.
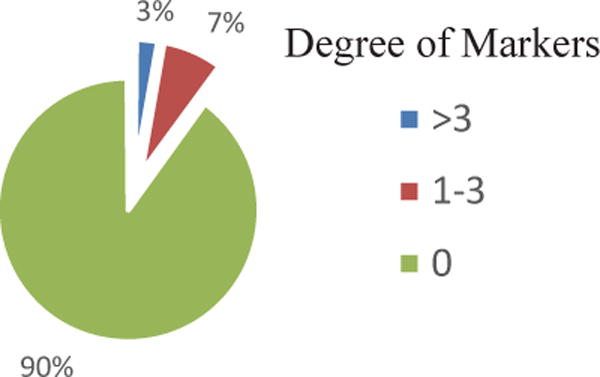
Degree of connectivity of the selected gene markers in breast cancer dataset. Most genes show degree of zero, i.e., these genes do not show interaction with others in the selected gene list, indicating the “within profile dependency” is successfully minimized to reduce dependency.
The “grouping effect” of GIREN was also investigated by calculating the correlation coefficients between selected features. For breast cancer dataset, GIREN reported 111 genes as feature genes for prognosis, so we conducted a permutation that randomly selected 111 genes from all the genes in original dataset for 1000 times, then calculate the percentage of highly correlated genes. As shown in Fig. 8, comparing with the randomly selected feature pairs, among which only average 30.2% are significantly correlated (with Pearson correlation p-value smaller than 0.05), and the percentage is much higher among GIREN selected features (59.7%). The increased percentage of significantly correlated features also indicates potential grouping effect of features selected by GIREN algorithm, which is consistent with previous conclusions.
Fig. 8.
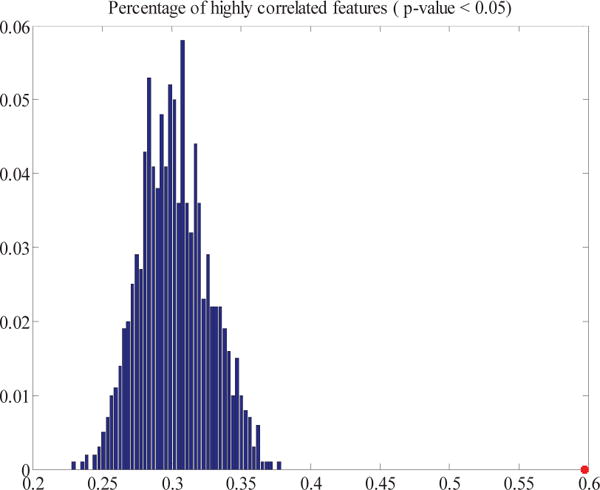
Comparison of percent of high correlation feature pairs in 1000 sets of randomly selected 111 features vs. GIREN selected features. The histogram in blue is the percent of highly correlated features based on 1000 sets of randomly selected 111 features. The star in red (59.7%) indicates the percent of highly correlated feature pairs in GIREN selected 111 features.
The functions of the selected marker genes were also explored by GO analysis. Important functions related with tumor genesis and cancer pathologies are enriched in the selected gene markers, such as “defense response” (p-value 4.59×10⁻⁶) and “immune response” (p-value 2.77×10⁻⁵), etc.
After 100 times of 3 fold cross validation, consistent with the breast cancer case study, GIREN achieves the best performance in predicting breast cancer progression among the 7 approaches in terms of median AUC and IQR, as shown in Fig. 9. Interestingly, on both the ovarian and breast cancer studies, integration of pathway information with average pathway expression method improves the performance of LASSO and Elastic Net but not on SuperPC.
Fig. 9.
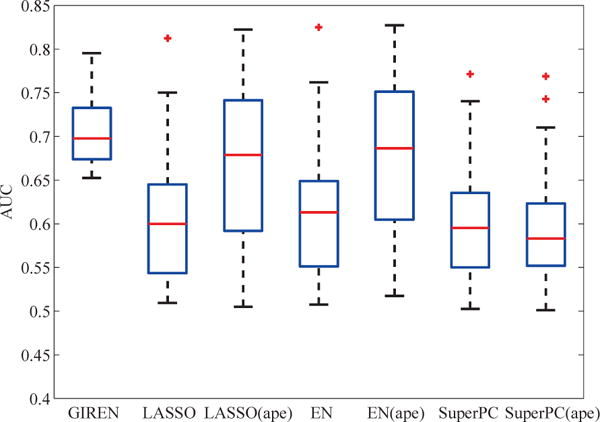
Breast cancer progression prediction based on the gene list selected by GIREN, LASSO, Elastic Net and SuperPC with original gene measurement or average pathway expression. GIREN achieved the best performance among the 7 tested methods in term of the “area under curve” (AUC), indicating an improved accuracy of the proposed method in predicting the risk group of the breast cancer patients. The relative performance of tested method is highly consistent with ovarian cancer cast study. 163 patients in total were involved in this test, and 100 times of 3-fold cross-validation were conducted to evaluate the performance. For LASSO method, the weight coefficient α is set to be 0.37 by cross-validation. For Elastic Net method, the weight coefficient α and λ were set to be 0.4 and 0.5 respectively by cross-validation. For GIREN, the weight coefficients α, λ, and γ were set to be 0.3, 0.4 and 0.08, respectively according to cross-validation.
In both cancer case studies, the sample size is relatively large, and it should be of interest to see how the proposed method performs on a relative small dataset. We would like to further test the performance of the proposed algorithm when the sample size is not as large. For this purpose, a total of 42 samples are randomly chosen from high and low risk groups respectively, and 100 times of 3 fold cross validation was applied to evaluate the performance of all the 7 algorithms. As shown in Fig. 10, GIREN still gets better AUC and IQR than competing algorithms on relatively small dataset, which is consistent with previous results.
Fig. 10.
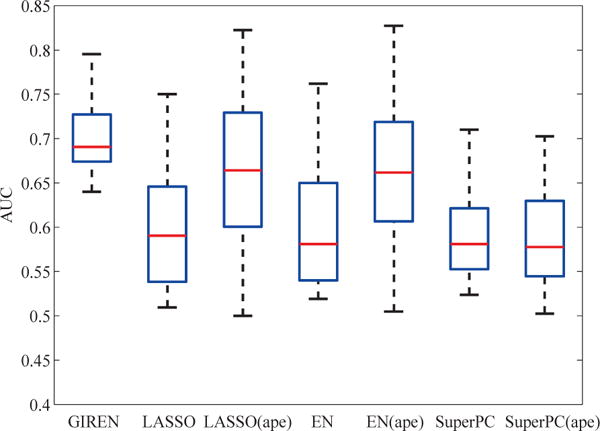
Performance of GIREN on small dataset. To test the performance of GIREN on a relatively small dataset, we randomly selected 42 samples from the low and high risk groups, respectively in the breast cancer datasets. And in general, GIREN still outperforms competing methods rather significantly.
4 DISCUSSION AND CONCLUSION
Integrative clinical outcome prediction with multi-omic data is a critical emerging research topic accelerated by large scale cancer genome efforts (such as TCGA) and the rise of personalized medicine. The main contribution of this work is to expand the elastic net penalty for the integration of gene-gene interaction network information for better classification purpose. While the original version of elastic net cannot take into account of the information in network form, the proposed GIREN formation represents a more general formulation. Using an elastic net based model penalized with gene interactions together with an iterative gradient descent algorithm, the proposed algorithm conveniently integrate gene measurement (including gene expression profile, DNA methylation profile, etc.) and gene-gene interaction information (including transcription factor targets and protein-protein interactions) to identify key feature genes of different risk groups with minimal predictive redundancy. Results on 2 real datasets consistently suggest that, the proposed methods significantly outperforms LASSO, the original elastic net and SuperPC in classifying the ovarian cancer patients into different risking groups, indicating a promising direction for multi-omic data integration.
The proposed GIREN model has the following 2 distinct features. Firstly, built upon Elastic Net formulation, GIREN model exhibits sparsity in its solution and selects a relative small number of feature genes based on the regression coefficients, which are considered to play key role in the process and may potentially be used as drug targets. Secondly, with the power to incorporate gene-gene interaction data to reduce “within profile dependency” and improve performance, GIREN is applicable to a wide variety of data types, including but not limited to DNA methylation, gene expression, protein-protein interaction, RNA-protein interaction, etc., making it a flexible tool and general framework for the integration of various gene measurements and gene-gene interaction information. Please note that, although we used the protein-protein interaction database as prior knowledge for matrix A, it can be also in other type of interaction, such as, RNA-protein interaction [46], competing endogenous RNA [47] or a combination of several types of interactions with possibly different weights. e.g., if the i-th gene interacts with the j-th gene at protein level, we set aij=1; if the two are competing endogenous RNA pair, we set aij=0.5. It is also possible to incorporate other related types of network information, such as pathway or gene ontology functions, e.g., If the i-th gene and the j-th gene are involved within the same pathway or function, we set aij=1, and otherwise set aij=0.
The limitation of the proposed methods is mainly the computation load. The algorithm adopts an improved “elastic net penalty” regularized by gene-gene interactions, which cannot be solved by the classic fast algorithm of elastic net. The newly developed iterative gradient descent algorithm suffers from a relative heavy computation load (almost 40 times of that of elastic net), and cannot directly apply to large genome-scale dataset, thus a feature selection step is required. With more and more -omics data at different levels and higher resolution accumulated in the biological and biomedical community, faster algorithm is necessary for fully taking advantage of the proposed algorithm and the vast amount of heterogeneous data available. Besides, the constraint matrix A could be further optimized with the degree of interaction or for incorporating more than one types of interaction information. Conceivable, a strong protein-protein binding interaction should probably be assigned with a larger weight than a relatively weak or temporal interaction, and different weights may be assigned for protein-protein interaction and competing endogenous RNA. Secondly, GIREN selects a number of features with grouping effect for classification purpose; however, the true meaning of the clustering effect and the inter-relationship between the correlated features are not clearly revealed by GIREN and remain to be further investigated by other approaches.
Acknowledgments
We thank the support from the Fundamental Research Funds for the Central Universities (2014QNB47, 2014QNA84) and China Scholarship Council to LZ and HL; National Natural Science Foundation of China (61170134 and 61201408) to JM and HL; the National Science Foundation of USA (CCF-1246073) to YH; We also thank computational support from the UTSA Computational Systems Biology Core, funded by the National Institute on Minority Health and Health Disparities (G12MD007591) from the National Institutes of Health.
Biographies
Lin Zhang received her PhD degree in signal and information processing from China University of Mining and Technology in 2007. From Sep. 2007 to July. 2008, she worked as a visiting scholar in University of Texas at San Antonio. Since 2008, she has been working in the School of Information and Electrical Engineering, China University of Mining and Technology, China, where she is now an associate professor. Her research interests are in the areas of computational biology and machine learning. She is a member of IEEE.
Hui Liu received his PhD degree in signal and information processing from China University of Mining and Technology in 2009. From Sep. 2007 to Mar. 2009, he worked as a visitor in University of Texas at San Antonio. Currently, he is working as an associate professor in the School of Information and Electrical Engineering, China University of Mining and Technology, China. His research interests include bioinformatics and computational biology. He is a member of IEEE.
Yufei Huang received his Ph.D. degree in electrical engineering from the State University of New York at Stony Brook in 2001. Since 2002, he has been with the Department of Electrical and Computer Engineering at the University of Texas at San Antonio (UTSA), where he is now Professor. He is also an adjunct professor at the Department of Epidemiology and Biostatistics at the University of Texas Health Science Center at San Antonio. He has been a visiting professor at the Center of Bioinformatics, Harvard Center for Neurodegeneration and Repair. His research interests are in the areas of computational biology, computational genomics, statistical modeling, and Bayesian methods. He is a member of IEEE.
Xuesong Wang received her PhD degree from China University of Mining and Technology in 2002. She is currently a professor in the School of Information and Electrical Engineering, China University of Mining and Technology. Her main research interests include machine learning, bioinformatics, and artificial intelligence. In 2008, she was the recipient of the New Century Excellent Talents in University from the Ministry of Education of China.
Yidong Chen received his BS/MS degrees in Electrical Engineering from Fudan University, Shanghai, China, and Ph.D. in Imaging Science from Rochester Institute of Technology, Rochester, NY. He has been with Hewlett Packard Co as a Research Engineer before he joined National Institutes of Health (NIH) at 1996. Dr. Chen is now Director of Computational Biology and Bioinformatics (CBBI) at GCCRI, and Professor at Department of Epidemiology and Biostatistics, University of Texas Health Science Center at San Antonio, specialized in bioinformatics, computational modeling and biostatistics in the area of gene expression, DNA copy number, SNP and other data analysis method development. Dr. Chen focuses on finding ways to help scientists analyze and visualize their ever-expanding data with increasingly complex statistical methods, diverse computational implementation, specialized experiment design involved in genomic experiments, such as the joint analysis with DNA copy number and gene expression profiling of breast cancer cell lines by using the high-resolution tiling-path microarray technology.
Jia Meng received his PhD degree in Electrical Engineering from the University of Texas at San Antonio in 2011. In Feb 2012, he joined MIT as a bioinformatician and the supervisor of bioinformatics core facility at Picower Institute for Learning and Memory. Between 2012and 2014, he served as an associate scientist at Broad Institute of MIT and Harvard. He is now a lecturer and PhD advisor at Department of Biological Sciences, Xi’an Jiaotong-Liverpool University, Suzhou, China. He is interested in bioinformatics and computational biology. He is a member of IEEE.
Contributor Information
Lin Zhang, School of Information and Electrical Engineering, China University of Mining and Technology, Xuzhou, 221116, China.
Hui Liu, School of Information and Electrical Engineering, China University of Mining and Technology, Xuzhou, 221116, China.
Xuesong Wang, School of Information and Electrical Engineering, China University of Mining and Technology, Xuzhou, 221116, China.
Yidong Chen, Department of Epidemiology and Biostatistics, University of Texas Health Science Center, San Antonio, TX 78229.
Jia Meng, Department of Biological Sciences, Xi’an Jiaotong-Liverpool University, Suzhou, 215123, China.
References
- 1.Wei JS, Greer BT, Westermann F, et al. Prediction of clinical outcome using gene expression profiling and artificial neural networks for patients with neuroblastoma. Cancer research. 2004;64(19):6883–6891. doi: 10.1158/0008-5472.CAN-04-0695. [DOI] [PMC free article] [PubMed] [Google Scholar]
- 2.Nair VS, Maeda LS, Ioannidis JP. Clinical outcome prediction by microRNAs in human cancer: a systematic review. Journal of the National Cancer Institute. 2012;104(7):528–540. doi: 10.1093/jnci/djs027. [DOI] [PMC free article] [PubMed] [Google Scholar]
- 3.Soon WW, Hariharan M, Snyder MP. High - throughput sequencing for biology and medicine. Molecular systems biology. 2013;9(1) doi: 10.1038/msb.2012.61. [DOI] [PMC free article] [PubMed] [Google Scholar]
- 4.Bair E, Tibshirani R. Semi-supervised methods to predict patient survival from gene expression data. PLoS biology. 2004;2(4):e108. doi: 10.1371/journal.pbio.0020108. [DOI] [PMC free article] [PubMed] [Google Scholar]
- 5.Mankoo PK, Shen R, Schultz N, et al. Time to recurrence and survival in serous ovarian tumors predicted from integrated genomic profiles. PLoS One. 2011;6(11):e24709. doi: 10.1371/journal.pone.0024709. [DOI] [PMC free article] [PubMed] [Google Scholar]
- 6.Langville AN, Meyer CD. Google’s PageRank and beyond: The science of search engine rankings. Princeton University Press; 2011. [Google Scholar]
- 7.Shen R, Mo Q, Schultz N, et al. Integrative subtype discovery in glioblastoma using iCluster. PloS one. 2012;7(4):e35236. doi: 10.1371/journal.pone.0035236. [DOI] [PMC free article] [PubMed] [Google Scholar]
- 8.Hanahan D, Weinberg RA. Hallmarks of cancer: the next generation. Cell. 2011;144(5):646–674. doi: 10.1016/j.cell.2011.02.013. [DOI] [PubMed] [Google Scholar]
- 9.Doi A, Park I-H, Wen B, et al. Differential methylation of tissue-and cancer-specific CpG island shores distinguishes human induced pluripotent stem cells, embryonic stem cells and fibroblasts. Nature genetics. 2009;41(12):1350–1353. doi: 10.1038/ng.471. [DOI] [PMC free article] [PubMed] [Google Scholar]
- 10.Hon GC, Hawkins RD, Caballero OL, et al. Global DNA hypomethylation coupled to repressive chromatin domain formation and gene silencing in breast cancer. Genome research. 2012;22(2):246–258. doi: 10.1101/gr.125872.111. [DOI] [PMC free article] [PubMed] [Google Scholar]
- 11.Berman BP, Weisenberger DJ, Aman JF, et al. Regions of focal DNA hypermethylation and long-range hypomethylation in colorectal cancer coincide with nuclear lamina-associated domains. Nature genetics. 2012;44(1):40–46. doi: 10.1038/ng.969. [DOI] [PMC free article] [PubMed] [Google Scholar]
- 12.C. G. A. R. Network. Integrated genomic analyses of ovarian carcinoma. Nature. 2011;474(7353):609–615. doi: 10.1038/nature10166. [DOI] [PMC free article] [PubMed] [Google Scholar]
- 13.Meng J, Chen H-I, Zhang J, et al. Uncover cooperative gene regulations by microRNAs and transcription factors in glioblastoma using a nonnegative hybrid factor model. :6012–6015. [Google Scholar]
- 14.Toloşi L, Lengauer T. Classification with correlated features: unreliability of feature ranking and solutions. Bioinformatics. 2011;27(14):1986–1994. doi: 10.1093/bioinformatics/btr300. [DOI] [PubMed] [Google Scholar]
- 15.Meng J, Meriño LM, Bigdely Shamlo N, et al. Characterization and robust classification of EEG signal from image RSVP events with independent time-frequency features. PLoS One. 2012;7(9):e44464. doi: 10.1371/journal.pone.0044464. [DOI] [PMC free article] [PubMed] [Google Scholar]
- 16.Meng J, Merino LM, Robbins K, et al. Classification of Imperfectly Time-Locked Image RSVP Events with EEG Device. Neuroinformatics. 2014 Apr;12(2):261–275. doi: 10.1007/s12021-013-9203-4. 2014. [DOI] [PubMed] [Google Scholar]
- 17.Binder H, Schumacher M. Incorporating pathway information into boosting estimation of high-dimensional risk prediction models. BMC bioinformatics. 2009;10(1):18. doi: 10.1186/1471-2105-10-18. [DOI] [PMC free article] [PubMed] [Google Scholar]
- 18.Wan X, Yang C, Yang Q, et al. BOOST: A fast approach to detecting gene-gene interactions in genome-wide case-control studies. The American Journal of Human Genetics. 2010;87(3):325–340. doi: 10.1016/j.ajhg.2010.07.021. [DOI] [PMC free article] [PubMed] [Google Scholar]
- 19.Winter C, Kristiansen G, Kersting S, et al. Google goes cancer: improving outcome prediction for cancer patients by network-based ranking of marker genes. PLoS computational biology. 2012;8(5):e1002511. doi: 10.1371/journal.pcbi.1002511. [DOI] [PMC free article] [PubMed] [Google Scholar]
- 20.Roy J, Winter C, Isik Z, et al. Network information improves cancer outcome prediction. Briefings in bioinformatics. 2012:bbs083. doi: 10.1093/bib/bbs083. [DOI] [PubMed] [Google Scholar]
- 21.Porzelius C, Johannes M, Binder H, et al. Leveraging external knowledge on molecular interactions in classification methods for risk prediction of patients. Biometrical Journal. 2011;53(2):190–201. doi: 10.1002/bimj.201000155. [DOI] [PubMed] [Google Scholar]
- 22.Gade S, Porzelius C, Fälth M, et al. Graph based fusion of miRNA and mRNA expression data improves clinical outcome prediction in prostate cancer. BMC bioinformatics. 2011;12(1):488. doi: 10.1186/1471-2105-12-488. [DOI] [PMC free article] [PubMed] [Google Scholar]
- 23.Edwards D, Wang L, Sorensen P. Network-enabled gene expression analysis. BMC bioinformatics. 13(1):167. doi: 10.1186/1471-2105-13-167. [DOI] [PMC free article] [PubMed] [Google Scholar]
- 24.Cun Y, Fröhlich H. Network and data integration for biomarker signature discovery via network smoothed t-statistics. PloS one. 2013;8(9):e73074. doi: 10.1371/journal.pone.0073074. [DOI] [PMC free article] [PubMed] [Google Scholar]
- 25.Cun Y, Fröhlich H. netClass: an R-package for network based, integrative biomarker signature discovery. Bioinformatics. 2014:btu025. doi: 10.1093/bioinformatics/btu025. [DOI] [PubMed] [Google Scholar]
- 26.Fröhlich H. Including network knowledge into Cox regression models for biomarker signature discovery. Biometrical Journal. 2014;56(2):287–306. doi: 10.1002/bimj.201300035. [DOI] [PubMed] [Google Scholar]
- 27.Cun Y, Fröhlich H. Biomarker gene signature discovery integrating network knowledge. Biology. 2012;1(1):5–17. doi: 10.3390/biology1010005. [DOI] [PMC free article] [PubMed] [Google Scholar]
- 28.Zhang S, Li Q, Liu J, et al. A novel computational framework for simultaneous integration of multiple types of genomic data to identify microRNA-gene regulatory modules. Bioinformatics. 2011;27(13):i401–i409. doi: 10.1093/bioinformatics/btr206. [DOI] [PMC free article] [PubMed] [Google Scholar]
- 29.Zou H, Hastie T. Regularization and variable selection via the elastic net. Journal of the Royal Statistical Society: Series B (Statistical Methodology) 2005;67(2):301–320. [Google Scholar]
- 30.Kim J, Kim Y, Kim Y. A gradient-based optimization algorithm for lasso. Journal of Computational and Graphical Statistics. 2008;17(4) [Google Scholar]
- 31.Friedman J, Hastie T, Höfling H, et al. Pathwise coordinate optimization. The Annals of Applied Statistics. 2007;1(2):302–332. [Google Scholar]
- 32.Zhang L, Liu H, Hsiao T-H, et al. An investigation of clinical outcome prediction from integrative genomic profiles in ovarian cancer. :103–106. [Google Scholar]
- 33.Rooney A. The Story of Mathematics. Arcturus Publishing; 2009. [Google Scholar]
- 34.Mann HB, Whitney DR. On a test of whether one of two random variables is stochastically larger than the other. The annals of mathematical statistics. 1947:50–60. [Google Scholar]
- 35.Matys V, Kel-Margoulis OV, Fricke E, et al. TRANSFAC® and its module TRANSCompel®: transcriptional gene regulation in eukaryotes. Nucleic acids research. 2006;34(suppl 1):D108–D110. doi: 10.1093/nar/gkj143. [DOI] [PMC free article] [PubMed] [Google Scholar]
- 36.Bossi A, Lehner B. Tissue specificity and the human protein interaction network. Molecular systems biology. 2009;5(1) doi: 10.1038/msb.2009.17. [DOI] [PMC free article] [PubMed] [Google Scholar]
- 37.Bossi A, Lehner B. Tissue specificity and the human protein interaction network. doi: 10.1038/msb.2009.17. http://www.biomedsearch.com/attachments/00/19/35/76/19357639/%20msb200917-s2.zip. [DOI] [PMC free article] [PubMed]
- 38.Zhu P, Tong BM, Wang R, et al. Nox4-dependent ROS modulation by amino endoperoxides to induce apoptosis in cancer cells. Cell death & disease. 2013;4(3):e552. doi: 10.1038/cddis.2013.68. [DOI] [PMC free article] [PubMed] [Google Scholar]
- 39.Sang M, Lian Y, Zhou X, et al. MAGE-A family: attractive targets for cancer immunotherapy. Vaccine. 2011;29(47):8496–8500. doi: 10.1016/j.vaccine.2011.09.014. [DOI] [PubMed] [Google Scholar]
- 40.Watase G, Takisawa H, Kanemaki MT. Mcm10 plays a role in functioning of the eukaryotic replicative DNA helicase, Cdc45-Mcm-GINS. Current Biology. 2012;22(4):343–349. doi: 10.1016/j.cub.2012.01.023. [DOI] [PubMed] [Google Scholar]
- 41.Larsen S, Yokochi T, Isogai E, et al. LMO3 interacts with p53 and inhibits its transcriptional activity. Biochemical and biophysical research communications. 2010;392(3):252–257. doi: 10.1016/j.bbrc.2009.12.010. [DOI] [PubMed] [Google Scholar]
- 42.Koretzky GA, Abtahian F, Silverman MA. SLP76 and SLP65: complex regulation of signalling in lymphocytes and beyond. Nature Reviews Immunology. 2006;6(1):67–78. doi: 10.1038/nri1750. [DOI] [PubMed] [Google Scholar]
- 43.G. O. Consortium Gene Ontology annotations and resources. Nucleic acids research. 2013;41(D1):D530–D535. doi: 10.1093/nar/gks1050. [DOI] [PMC free article] [PubMed] [Google Scholar]
- 44.Da Wei Huang BTS, Lempicki RA. Systematic and integrative analysis of large gene lists using DAVID bioinformatics resources. Nature protocols. 2008;4(1):44–57. doi: 10.1038/nprot.2008.211. [DOI] [PubMed] [Google Scholar]
- 45.Cho Y, Gorina S, Jeffrey PD, et al. Crystal structure of a p53 tumor suppressor-DNA complex: understanding tumorigenic mutations. Science. 1994;265(5170):346–355. doi: 10.1126/science.8023157. [DOI] [PubMed] [Google Scholar]
- 46.Ascano M, Hafner M, Cekan P, et al. Identification of RNA– protein interaction networks using PAR-CLIP. Wiley Interdisciplinary Reviews: RNA. 2012;3(2):159–177. doi: 10.1002/wrna.1103. [DOI] [PMC free article] [PubMed] [Google Scholar]
- 47.Tay Y, Kats L, Salmena L, et al. Coding-independent regulation of the tumor suppressor PTEN by competing endogenous mRNAs. Cell. 2011;147(2):344–357. doi: 10.1016/j.cell.2011.09.029. [DOI] [PMC free article] [PubMed] [Google Scholar]


