Abstract
Key points
[Ca2+]i enhanced rabbit ventricular slowly activating delayed rectifier K+ current (I Ks) by negatively shifting the voltage dependence of activation and slowing deactivation, similar to perfusion of isoproterenol.
Rabbit ventricular rapidly activating delayed rectifier K+ current (I Kr) amplitude and voltage dependence were unaffected by high [Ca2+]i.
When measuring or simulating I Ks during an action potential, I Ks was not different during a physiological Ca2+ transient or when [Ca2+]i was buffered to 500 nm.
Abstract
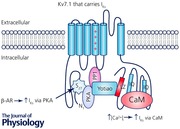
The slowly activating delayed rectifier K+ current (I Ks) contributes to repolarization of the cardiac action potential (AP). Intracellular Ca2+ ([Ca2+]i) and β‐adrenergic receptor (β‐AR) stimulation modulate I Ks amplitude and kinetics, but details of these important I Ks regulators and their interaction are limited. We assessed the [Ca2+]i dependence of I Ks in steady‐state conditions and with dynamically changing membrane potential and [Ca2+]i during an AP. I Ks was recorded from freshly isolated rabbit ventricular myocytes using whole‐cell patch clamp. With intracellular pipette solutions that controlled free [Ca2+]i, we found that raising [Ca2+]i from 100 to 600 nm produced similar increases in I Ks as did β‐AR activation, and the effects appeared additive. Both β‐AR activation and high [Ca2+]i increased maximally activated tail I Ks, negatively shifted the voltage dependence of activation, and slowed deactivation kinetics. These data informed changes in our well‐established mathematical model of the rabbit myocyte. In both AP‐clamp experiments and simulations, I Ks recorded during a normal physiological Ca2+ transient was similar to I Ks measured with [Ca2+]i clamped at 500–600 nm. Thus, our study provides novel quantitative data as to how physiological [Ca2+]i regulates I Ks amplitude and kinetics during the normal rabbit AP. Our results suggest that micromolar [Ca2+]i, in the submembrane or junctional cleft space, is not required to maximize [Ca2+]i‐dependent I Ks activation during normal Ca2+ transients.
Keywords: action potential, cardiac electrophysiology, delayed rectifier current, intracellular calcium, potassium channel, rabbit, voltage‐gated channels
Abbreviations
- AP
action potential
- β‐AR
β‐adrenergic receptor
- CaM
calmodulin
- [Ca2+]i
intracellular calcium
- CaT
Ca2+ transient
- k
slope‐factor for the V m dependence of activation
- ICaL
L‐type Ca2+ current
- ICFTR
cystic fibrosis transmembrane conductance regulator Cl− current
- ICl,Ca
Ca2+‐activated Cl− current
- IKs
slowly activating delayed rectifier K+ current
- IKr
rapidly activating delayed rectifier K+ current
- ISO
isoproterenol
- IMAX
maximally activated current
- I–V
current–voltage
- PKA
protein kinase A
- PKC
protein kinase C
- PLM
phospholemman
- τact
time course of activation
- τdeact
time course of deactivation
- V1/2
half‐maximal activation potential
- Vm
membrane potential
Introduction
In the heart, the repolarizing delayed rectifier potassium current (I K) consists of a slowly activating component (I Ks) and a rapidly activating component (I Kr) that differ in drug sensitivity, and voltage‐ or time‐dependent properties (Sanguinetti & Jurkiewicz, 1990; Selnick et al. 1997). These outward currents are required during phase 2 and phase 3 of the ventricular action potential (AP) for cardiac repolarization (Nerbonne & Kass, 2005). Under normal physiological conditions and in the absence of β‐adrenergic stimulation, I Kr plays a primary role in repolarization in large mammals (such as rabbit, dog and human). I Ks density has typically been measured to be much lower than I Kr in these animals under basal conditions, but these studies were performed in situations where intracellular Ca2+ ([Ca2+]i) was highly buffered (Jost et al. 2007). Additionally, most studies of I Ks in native systems are performed in guinea pig, where I Ks density is very large, and activation and deactivation kinetics are significantly slower than human I Ks. Rabbit and dog I Ks more closely resemble human I Ks, thus making these species more suitable to use when studying I Ks function and regulation (Liu & Antzelevitch, 1995; Heath & Terrar, 1996; Li et al. 1996; Salata et al. 1996). Furthermore, because repolarization depends on a fine balance between inward (mainly Ca2+‐selective) and outward (K+‐selective) currents, I Ks might play an important role when normal repolarization reserve is impaired (Jost et al. 2005; Grandi et al. 2010).
The I Ks macromolecular channel complex minimally consists of the Kv7.1 pore‐forming α‐subunit and the ancillary MinK1 β‐subunit (Barhanin et al. 1996; Sanguinetti et al. 1996). ‘Loss‐of‐function’ mutations within the genes encoding Kv7.1 (KCNQ1) or MinK1 (KCNE1) typically cause a decrease in I Ks and are linked to congenital arrhythmia syndromes, type 1 and type 5 long QT syndromes (LQT1 and LQT5), respectively (Wang et al. 1996; Splawski et al. 1997). The dysfunctional I Ks may lead to prolongation of the QT interval on a patient's electrocardiogram (ECG) and increases the risk for the phenotypic polymorphic ventricular tachycardia, torsades de pointes (El‐Sherif et al. 1997; Shah et al. 2005). Interestingly, the onset of torsades de pointes in LQT1 patients is typically triggered by adrenergic stress, highlighting the physiological importance of β‐adrenergic regulation in mediating the cardiac AP and specifically I Ks (Schwartz et al. 2001; Goldenberg et al. 2012). During β‐adrenergic stimulation, Kv7.1 is phosphorylated by protein kinase A (PKA) on the amino terminus and causes an increase of I Ks that is important for normal AP shortening (Walsh & Kass, 1988; Marx et al. 2002). Mutations that disrupt the β‐adrenergic upregulation of I Ks are also linked to LQT1, further emphasizing the importance of this process (Heijman et al. 2012; Bartos et al. 2014). Interestingly, [Ca2+]i can also influence I K (sum of I Kr and I Ks), and β‐adrenergic stimulation increases Ca2+ transients (CaTs) in myocytes (Tohse, 1990; Bers, 2002). Dynamic clamp experiments in guinea pig myocytes demonstrated that I Ks was larger than I Kr subsequent to β‐adrenergic stimulation (Banyasz et al. 2014). This is an important finding because these recordings are in conditions where [Ca2+]i is not buffered and physiological membrane and Ca2+ dynamics are maintained (Banyasz et al. 2011).
Several studies have reported on the regulation of I K by [Ca2+]i by using the whole‐cell and inside‐out patch clamp methods. The results suggested that increasing [Ca2+]i (similar to the rise in [Ca2+]i during each cycle of contraction and relaxation from ∼0.1 to 1 μm) in guinea pig ventricular myocytes increases I K, most likely by increasing the open probability (P O) or number of channels at the cell surface (Tohse, 1990). A later study determined calmodulin (CaM) is required for Ca2+‐sensitive increases of I K, and this process was PKA and protein kinase C (PKC) independent (Nitta et al. 1994). Because Ca2+–CaM interaction with nitric oxide synthase (NOS) is an important determinant for NOS activation and NO release (Bai et al. 2004, 2005), the same group also showed that NO enhancement of I Ks is critical for regulating AP duration, Ca2+ sensitivity of I Ks itself, and intracellular Ca2+ cycling (Bai et al. 2005). More recently, two studies reported that CaM binds to IQ motifs on the C‐terminus of Kv7.1, and CaM interaction with the I Ks channel complex is required for proper channel assembly, Ca2+ sensitivity and cell surface expression (Ghosh et al. 2006; Shamgar et al. 2006). Additionally, LQT1‐linked mutations can disrupt the CaM–Kv7.1 interaction, uncover inactivation of I Ks and decrease I Ks similar to other defined loss‐of‐function mutations (Ghosh et al. 2006; Shamgar et al. 2006).
While previous studies have suggested the importance of [Ca2+]i regulation of I Ks, quantitative information as to how Ca2+ sensitivity of I Ks may affect cardiac repolarization in a more physiologically relevant environment is lacking. We sought to fill this gap in knowledge here.
Methods
Ethical approval
All animal care and procedures were approved by the University of California, Davis Institutional Animal Care and Use Committee and are in accordance with National Institutes of Health guidelines.
Rabbit euthanasia and ventricular myocyte isolation
Adult male New Zealand White rabbits (source, Western Oregon Rabbit Company) were housed at the University of California, Davis vivarium with access to normal food and water ad libitum. Rabbit ventricular myocytes were isolated with techniques modified from Pogwizd et al. (1999, 2001) and used acutely. Rabbits were administered Heparin, at 400 units kg–1 subcutaneously, 15–30 min before surgery. Animals were then placed in a conventional restraint cage and given propofol at 0.5–2 mg kg–1 or to effect. Once sedated, rabbits were gently but quickly removed from the restrainer and masked for isoflurane inhalation while being placed supine for surgery. Isoflurane was delivered with 100% oxygen through a facemask via a regularly calibrated veterinary vaporizer at a flow rate of 3–4 l min–1, initially at 3–4.5% but reduced as appropriate as long as full areflexia was assured. Once very deep anaesthesia was verified, the heart was rapidly excised. Therefore, the animals only experienced brief restraint and minor discomfort of the injection.
Excised hearts were quickly washed in Ca2+‐free normal Tyrode solution at 4°C. They were then cannulated via the aorta for retrograde Langendorff perfusion. Oxygenated Hepes‐buffered Ca2+‐free Tyrode solution at 37°C was perfused long enough to ensure clearing of blood and Ca2+, resulting in arrest and relaxation. Pressure was ∼60–80 mmHg and flow rate was ∼20–30 ml min–1. Perfusion was then switched to the same Tyrode solution containing either a crude collagenase (∼1 mg ml–1) and protease (∼0.05 mg ml–1) mixture or a defined enzyme product such as Roche Liberase (collagenase/thermolysin) at an equivalent concentration, with [Ca2+] adjusted to 20–25 μm. The tissue softened within 20–30 min, at which time the heart was removed and minced into 1–2 mm pieces in Tyrode solution containing 1% BSA. The pieces were gently agitated or triturated and passed through a nylon mesh of 200–250 μm pitch, resulting in liberation of individual cells, which were washed free of BSA and maintained at room temperature in Tyrode solution containing 50 μm Ca2+ until the time of the experiments.
Electrophysiology
Cardiac myocytes were plated on laminin‐coated glass coverslips at room temperature and transferred to an inverted microscope (Leica DMI3000B; Leica Microsystems; Buffalo Grove, IL, USA). Patch pipettes were fabricated from thin‐walled, filamented borosilicate glass and fire polished (World Precision Instruments; Sarasota, FL, USA). Uncompensated pipette resistances were ∼1–1.8 MΩ. Only cells with seal resistances > 1 GΩ were used for recordings and series resistance was compensated up to 80%. pCLAMP 10.4 (Molecular Devices; Sunnyvale, CA, USA) was used to generate the voltage clamp protocols, acquire current signals, and initiate data analyses. An Axopatch‐200A patch clamp amplifier (Axon Instruments/Molecular Devices) was used to measure membrane current and cell capacitance. The giga seal was obtained in normal Tyrode solution containing (in mm): 135 NaCl, 0.33 NaH2PO4, 5.4 KCl, 2 CaCl2, 0.53 MgCl2, 5.5 glucose and 5 Hepes (pH adjusted to 7.4 with NaOH). Once the cell membrane was ruptured and the whole‐cell configuration was obtained, the external solution was switched to and continuously superfused at room temperature for experiments using square pulses as the voltage (V m) command, or at 37°C for experiments implementing an AP waveform as the V m command, with the I Ks recording solution containing (in mm): 132 NaCl, 4 KCl, 1.8 CaCl2, 1.2 MgCl2, 0.2 BaCl2, 10 glucose, 10 Hepes, 5 4‐aminopyridine (4‐AP), 0.01 nifedipine, and 0.003 dofetilide (pH adjusted to 7.4 with NaOH). 4‐AP, nifedipine, and dofetilide were obtained from Sigma‐Aldrich (St Louis, MO, USA). For I Kr recordings, dofetilide was replaced with the I Ks‐selective inhibitor HMR‐1556 (0.001 mm, Tocris Bioscience; Bristol, UK) to block I Ks. To obtain [Ca2+]i signals, Fluo‐4 K+‐salt (0.05 mm) was included in the intracellular pipette solution (described below). For most experiments [Ca2+]i was buffered using a combination of 5 mm BAPTA (K d ∼190 nm) plus 1 mm dibromo‐BAPTA 4K (K d ∼1.8 μm) in the pipette solution. Total [Ca2+]i was adjusted to achieve free [Ca2+]i of 0, 100, 300, 500 and 600 nm, using the MaxChelator program (http://www.stanford.edu/~cpatton/maxc.html). In some experiments we let the myocyte control free [Ca2+]i, in which case millimolar BAPTA + dibromo‐BAPTA were replaced with 0.05 mm EGTA. In addition, the intracellular pipette solution contained (in mm): 120 KOH, 20 KCl, 2 MgCl2, 5 Mg‐ATP, 10 Hepes, 0.003 CaM and 100 aspartic acid (pH adjusted to 7.2 with KOH). I Ks was recorded initially within 2–4 min once the Ca2+‐signal and I Ks amplitude reached steady‐state. Depolarizing square‐pulses every 15 s allowed monitoring of both I Ks and Ca2+ signals. For experiments involving β‐adrenergic stimulation, 50 nm isoproterenol (ISO) was perfused in the extracellular solution after an initial current‐voltage (I‐V) protocol was recorded, and after 5 min an additional I–V was measured.
For measuring I Ks during an AP waveform, a rabbit ventricular AP waveform previously recorded at 1 Hz was implemented as the V m command, also at 1 Hz. No drugs were used for initial recordings. The first 50 sweeps were averaged as the control current activated during the AP waveform. Then, 1 μm HMR‐1556 was added to the extracellular solution, and 50 more sweeps were recorded and averaged, then subtracted in order to define the HMR‐sensitive I Ks. All AP‐clamp current recordings were performed at 35–37°C using an in‐line and bath temperature control system (Warner Instruments; Hamden, CT, USA).
Standard epifluorescence microscopy
Changes in [Ca2+]i were monitored using wide‐field epifluorescence microscopy. The intracellular pipette solution was modified to contain 0.05 mm Fluo‐4 pentapotassium salt (Thermo Fisher Scientific; New York, NY, USA) for experiments using the whole‐cell patch clamp technique. Cells were preloaded with cell permeable Fluo‐4 AM (Thermo Fisher Scientific) for 28 min in a Ca2+‐free Tyrode solution containing 10 μm Fluo‐4 AM (K d for Ca2+ of ∼335 nm). Fluo‐4 was excited by light of 488 nm wavelength, and emission was detected using a 514 nm long‐pass filter. The wavelength of excitation was controlled by an Optoscan monochromator (Cairn Research; Faversham, UK), and the emission signal was detected by a photomultiplier tube.
Mathematical modelling and simulation
We modified the Hodgkin–Huxley type formulation of I Ks in our rabbit ventricular model (Shannon et al. 2004; Negroni et al. 2015) to fit the experimentally observed Ca2+‐ and ISO‐dependent regulation of maximal current, activation V 1/2, and deactivation kinetics. Experimental data were scaled to 37°C using a Q 10 of 2.5 for both maximal conductance and time constants of activation and deactivation.
I Ks channels are assumed to be uniformly distributed on the sarcolemma. This means that 11% are in junctional clefts with the SR (I Ks‐junc vs. 89% in the external sarcolemma, I Ks‐sl), corresponding with the fraction of rabbit ventricular myocyte sarcolemma involved in such junctions (21% of T‐tubular membrane plus 4.6% of surface sarcolemma; Shannon et al. 2004). This accounts for local differences in [Ca2+]i that occur at the cleft and subsarcolemmal space. Total current is defined by the following equation:
Each component is calculated using the following formulation:
where c represents either the junctional (F Ks‐junc = 0.11) or subsarcolemmal (F Ks‐sl = 0.89) compartment, and the Na+:K+ permeability ratio (p NaK) of the channel is 0.01833. Note that each compartment senses different Ca2+ and Na+ concentrations ([Ca]c and [Na]c in this formulation). However, as opposed to Ca2+, significant [Na+] gradients are not seen in the model during excitation contraction coupling.
PKA‐ and Ca2+‐dependent modulation of I Ks is modelled as follows:
where the parameters G Ks0, ∆G Ks0, V h0, ∆V h, V τ0 and ∆V τ are fitted to the experimentally observed changes in G Ks, V 1/2, and V τ1/2 with ISO. These parameters are modulated by the scale factor, k PKA (varying between 0 and 1) given by:
where PKAp is the fraction of I Ks phosphorylated by PKA (I Ksp) over total I Ks (I Kstot), calculated as in (Negroni et al. 2015):
and 0.1098 is basal PKAp (in the absence of ISO) and 0.7282 is the difference between PKAp at ISO = 100 nm (corresponding to ‘maximal activation’) and basal PKAp.
AP and current‐clamp simulations were performed incorporating the new I Ks model within our well‐established rabbit ventricular model (as last updated in Negroni et al. 2015). The same AP waveform used for experiments was given as a V m command in AP‐clamp simulations (1 Hz). APs were simulated at 3 Hz in the absence or presence of 20 and 50 nm [ISO]. In addition to I Ks, PKA targets were: L‐type Ca2+ current (I CaL), ryanodine receptor, phospholamban, phospholemman (PLM), I Kr, cystic fibrosis transmembrane conductance regulator Cl− current (I CFTR), Ca2+‐activated Cl− current (I Cl,Ca), troponin I, titin and myosin binding protein C. Model differential equations were implemented in Matlab (The Mathworks Inc., Natick, MA, USA) and solved numerically using a variable order solver (ode15s). The code is available for download at: https://somapp.ucdmc.ucdavis.edu/Pharmacology/bers/
Analysis and statistics
I–V relations were plotted for the peak I Ks (normalized to capacitance, pA pF–1) measured at the end of the step pulse or at the initiation of the tail pulse. Origin 7.0 (OriginLab Corp.; Northhampton, MA, USA) was used for performing Boltzmann fitting and plotting I–V graphs. The following Boltzmann equation was used to describe the I–V relations:
where I MIN is the minimally activated I Ks, I MAX is the maximally activated I Ks (pA pF–1), V 1/2 is the midpoint potential for half‐maximal activation of I Ks (mV), and k is the slope factor (mV per e‐fold change). The time course of activation and deactivation (τact and τdeact, respectively) were determined by fitting a single exponential equation using pCLAMP 10.4 software. Data were reported as the mean ± standard error of the mean (SEM). Student's paired or unpaired t test was performed when appropriate to determine if values were different from one another. For comparison of three or more groups, a one‐way ANOVA was performed with Tukey's post hoc analysis. Significance was determined when P < 0.05.
Results
Distinguishing the delayed rectifier K+ currents, I Ks and I Kr
Figure 1 shows control experiments to demonstrate how we distinguished between rabbit I Ks and I Kr. To isolate total I K (sum of I Ks and I Kr), we blocked I K1, I to and I CaL by using Ba2+, 4‐AP and nifedipine, respectively (Fig. 1 A; with I–V protocol in inset). Figure 1 A shows total delayed rectifier I K (i.e. I Kr + I Ks) with the expected slow I Ks activation during depolarized V m and the large tail current upon repolarization as expected for I Kr. When recording I Kr, HMR‐1556 was added to block I Ks (Fig. 1 B; note the typical I Kr tail currents that exceed I Kr during the ‘step’ pulse). To isolate I Ks, we used 3 μm dofetilide (instead of HMR) to block I Kr (Fig. 1 C). The remaining time‐dependent currents were then completely abolished by 1 μm of the I Ks selective inhibitor HMR‐1556 (Fig. 1 D), leaving only a small linear leak current.
Figure 1. Distinction between I Ks and I Kr .
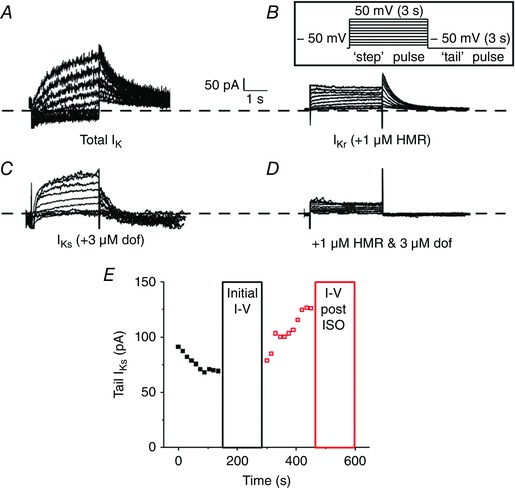
A–C, representative traces of whole‐cell total I K (A), I Kr (B) and I Ks (C) measured from isolated rabbit ventricular myocytes. Currents were recorded by applying step‐like pulses (inset) from −40 to 50 mV in 10 mV increments for 3 s, followed by a ‘tail’ pulse to −50 mV for 3 s. The inter‐pulse interval was 15 s. D, representative traces of whole‐cell currents recorded with high pipette [Ca2+] from the same cell as in C after perfusion of 1 μm HMR to show selective I Ks block. E, an exemplar time course of tail I Ks monitored before (black) and after (red) perfusion of ISO when pipette [Ca2+] was high.
Preliminary experiments showed that blockade of I Cl,Ca using 30 μm niflumic acid did not alter I Ks when [Ca2+]i was low or high, so niflumic acid was not included in the extracellular bath. I Ks currents are small and subject to rundown, and an exemplar time course of our protocol before and after perfusion of ISO (with high pipette [Ca2+]) is shown in Fig. 1 E. There was typically some initial rundown immediately after membrane rupture (and we monitored I Ks single square pulses every 15 s). I Ks usually stabilized within 2–4 min, at which time we performed a full I–V set. ISO was added immediately after the I–V protocol. Once I Ks stabilized with ISO (within 2–4 min), a subsequent I–V was recorded. A small number of cells did not respond significantly to ISO, but were still included in the analysis (2 out of 22 total cells).
Elevated [Ca2+]i enhances I Ks amplitude and negatively shifts voltage dependence of activation in rabbit ventricular myocytes
To determine if steady‐state increases in [Ca2+]i regulate rabbit I K, we recorded I Ks and I Kr from freshly isolated rabbit ventricular myocytes with intracellular pipette solutions that buffered free [Ca2+]i to 0, 100, 300, 500, or 600 nm. From a holding potential of −50 mV, I Ks was recorded by step‐like square pulses from −40 to 50 mV in 10 mV increments for 3 s, followed by a tail‐pulse to −50 mV for 3 s (Fig. 2 A inset). The voltage dependence of I Ks amplitude at the end of the 3 s pulse (minus a baseline that was leak‐corrected for each voltage step) is shown in Fig. 2 B (Step I Ks). The I–V relations for tail I Ks upon repolarization to −50 mV (measured as the amplitude of the decaying tail current exponential fit) are shown in Fig. 2 C. I Ks amplitudes at +50 mV (I MAX) were fitted by a Hill equation (I = I MAX/(1 + (K m/[Ca2+]i)N H)) as a function of [Ca2+]i, yielding an apparent K m of 253 nm and Hill coefficient (N H = 2.4), indicative of cooperative activation typical of CaM‐dependent mechanisms (Fig. 2 D). Boltzmann equation fits shown in Fig. 2 C yielded the V m for half‐maximal activation (V 1/2, Fig. 2 E) and activation slope factor (k, Fig. 2 F).
Figure 2. Assessment of steady‐state Ca2+ dependence of I Ks .
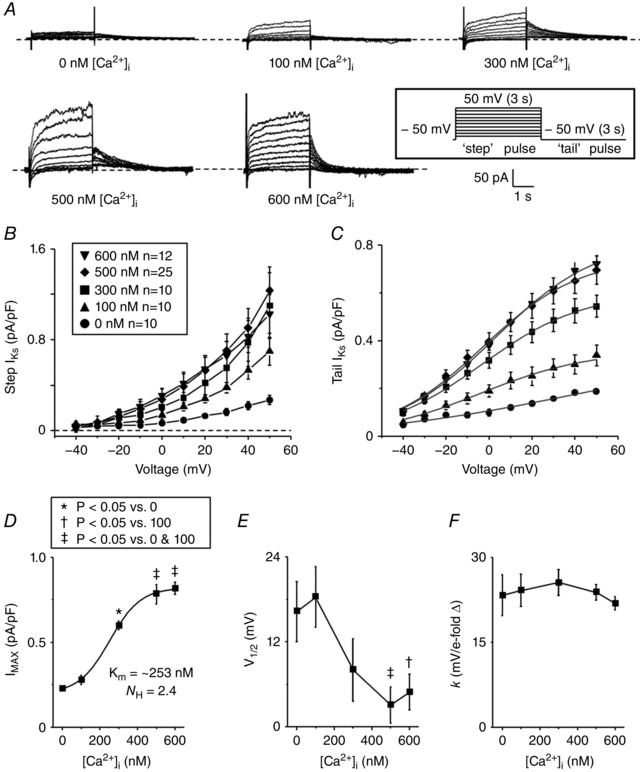
A, representative traces of whole‐cell I Ks measured from isolated rabbit ventricular myocytes. I Ks was recorded by applying the same V m protocol as Fig. 1 (inset). B and C, the mean peak ‘step’ (B) and ‘tail’ (C) I Ks are plotted as a function of the step voltage for cells recorded using a pipette solution containing free [Ca2+]i of 0, 100, 300, 500, and 600 nm. D–F, the tail I–V relations were described using a Boltzmann equation (grey line, C) to determine I MAX (D), V 1/2 (E) and k (F). For all figures, number of cells (n) and significance tests are indicated in boxed insets where appropriate.
When [Ca2+]i was increased from 0 to 300 nm, mean I MAX was more than doubled (0.60 vs. 0.23 pA pF–1). Importantly, raising the pipette [Ca2+]i from 500 to 600 nm [Ca2+]i further increased I MAX (0.78 or 0.82 pA pF–1, respectively), and the plateau suggested an approach to saturation (Fig. 1 C and D). V 1/2 was negatively shifted by ∼10 mV when I Ks was recorded with high [Ca2+]i of 500 and 600 nm (Fig. 2 E), with the steepest decline consistent with the [Ca2+]i dependence of I MAX. The slope factor, k, was not significantly changed by [Ca2+]i (Fig. 2 E). I Ks could not be measured using steady‐state [Ca2+]i > 600 nm due to progressive cellular contracture and cell death. These data suggest that high [Ca2+]i alters I Ks by increasing I MAX and shifting the V m dependence of channel activation to more negative potentials.
To ensure that the free‐Ca2+ of the pipette solutions were calculated correctly, [Ca2+]i was monitored during electrophysiological recordings by preloading myocytes with Fluo 4‐AM and including 50 μm Fluo 4‐K+ salt in the pipette solution (Fig. 3 A). The fluorescence signal was background subtracted and fitted to a single site binding equation to determine an apparent K d of 546 nm (Fig. 3 B). While higher than the published K d of Fluo‐4 in aqueous solutions (335 nm), it is consistent with ∼2‐fold higher K d values for this class of Ca2+ indicators when directly measured in myoplasm (Harkins et al. 1993; Bassani et al. 1995). These data showed that the actual [Ca2+]i in the myocytes used to measure K+‐currents were close to the predicted free [Ca2+] of the pipette solutions.
Figure 3. Representative traces of Ca2+‐fluorescence signal recordings during simultaneous whole‐cell patch clamp measurements.
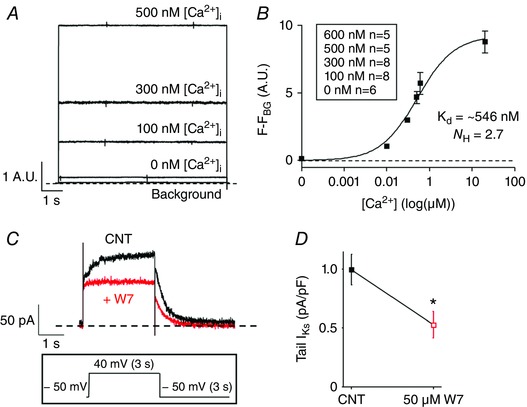
A, isolated rabbit ventricular myocytes were preloaded with Fluo‐4 AM and the patch pipette solution was loaded with Fluo‐4 K+ salt. The Ca2+ signal was recorded for 0, 100, 300, 500 and 600 nm [Ca2+]i using the same V m protocol as in Fig. 1. B, the fluorescence signal was background subtracted and fitted to a single site binding equation. C, representative traces of I Ks recorded with pipette [Ca2+] 500 nm before (black) and after (red) perfusion of 50 μm W7. I Ks was recorded by applying a step pulse from −50 to 40 mV for 3 s, followed by a tail pulse to −50 mV for 3 s (inset). D, the bar graph represents the mean peak tail I Ks recorded before or after W7 perfusion (n = 5, P < 0.05).
To confirm that CaM is involved in the [Ca2+]i dependence of I Ks, as is expected, we measured I Ks in the absence and presence of 50 μm W7, a widely used CaM inhibitor. Figure 3 C and D shows that W7 inhibited I Ks measured at 500 nm [Ca2+]i by approximately 50%, consistent with CaM being the mediator of the Ca2+‐dependent increase in I Ks in Fig. 2.
Since previous studies in mammalian myocytes had only assessed [Ca2+]i dependence of total I K, rather than I Ks vs. I Kr (Tohse, 1990; Nitta et al. 1994), we also repeated our protocols measuring I Kr to test whether rabbit ventricular I Kr is sensitive to high physiological [Ca2+]i (Fig. 4 A). The I–V relations of tail I Kr were described using a Boltzmann equation to determine I MAX, V 1/2 and k (Fig. 4 B–E). We concluded that rabbit I Kr is not sensitive to steady‐state changes in [Ca2+]i because no parameters were significantly altered when I Kr was recorded with [Ca2+]i of 0, 100, 300, or 600 nm.
Figure 4. Assessment of steady‐state Ca2+ dependence of I Kr .
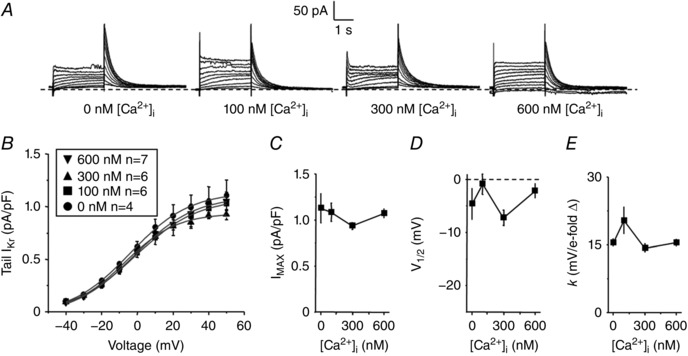
A, representative traces of whole‐cell I Kr measured from isolated rabbit ventricular myocytes. The same V m protocol was used as in Fig. 1. B, the mean peak tail I Kr are plotted as a function of the step voltage for cells recorded using a pipette solution containing free [Ca2+]i of 0, 100, 300 and 600 nm. C–E, the tail I–V relations were described using a Boltzmann equation (grey line, Fig. 4 B) to determine I MAX (C), V 1/2 (D) and k (E).
Next, since β‐adrenergic stimulation plays an important role in regulating I Ks, we measured differences in steady‐state [Ca2+]i sensitivity of I Ks induced by 50 nm ISO perfusion (Fig. 5). Tail I–V relations of I Ks were plotted as a function of the step‐pulse potential before and after perfusion of 50 nm ISO and described with a Boltzmann equation (Fig. 5 B and C). ISO perfusion increased I MAX even at zero [Ca2+]i, but in the presence of ISO raising [Ca2+]i further increased I MAX, roughly parallel to that seen in the control (CNT in Fig. 5 D). In this series, the Ca2+ dependence was less sigmoidal, but the apparent half‐point for Ca2+‐dependent I MAX increase was similar plus or minus ISO (225 and 235 nm, respectively), and consistent with the K m estimate in Fig. 2 D. ISO perfusion also caused a negative shift in the V 1/2 for all [Ca2+]i tested, but retained a roughly parallel [Ca2+]i dependence (Fig. 5 E). Neither ISO nor [Ca2+]i altered k significantly (Fig. 5 F). Thus, ISO does not appreciably alter the [Ca2+]i dependence of I Ks.
Figure 5. ISO and [Ca2+]i increase I MAX of I Ks .
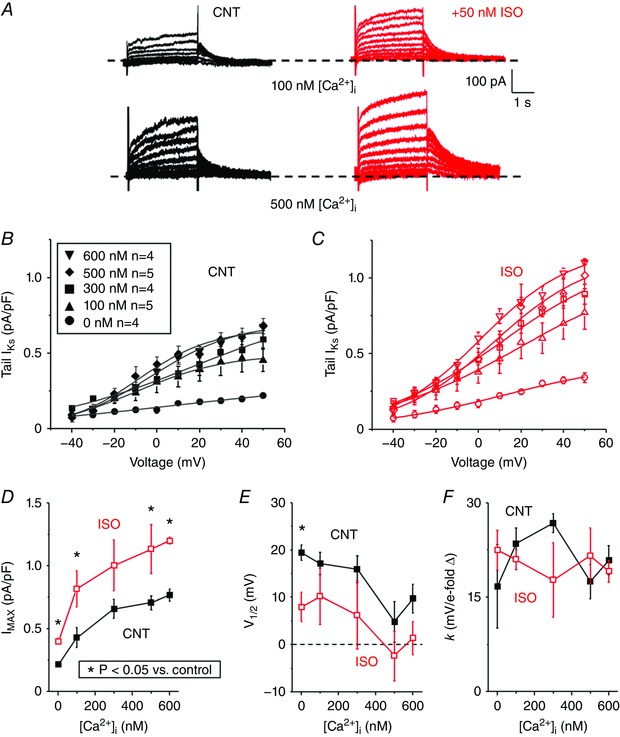
A, representative traces of I Ks measured from isolated rabbit ventricular myocytes at room temperature before (black) and after (red) 50 nm [ISO] perfusion for pipette solutions containing [Ca2+]i of 100 and 500 nm. The same V m protocol was used as in Fig. 1. B and C, the mean peak tail I Ks before (B) and after (C) ISO are plotted as a function of step voltage for cells recorded with a pipette solution containing free [Ca2+]i of 0, 100, 300, 500, or 600 nm. D–F, the tail I–V relations were described using a Boltzmann equation (grey line, Fig. 5 B and C) to determine I MAX (D), V 1/2 (E) and k (F).
Additionally, activation kinetics, τact, were fitted to a single exponential during the 40 mV test pulse and were unchanged by ISO (Fig. 6 A and B). The tail current at −50 mV following a 40 mV test pulse was fitted to a single exponential to determine τdeact. Both ISO and [Ca2+]i slowed deactivation kinetics of tail I Ks, and appeared additive, based on the similar shapes of the curves (Fig. 6 C). These results indicate that in rabbit both elevated [Ca2+]i and β‐adrenergic stimulation increase I Ks amplitude, negatively shift V 1/2 and slow deactivation kinetics. And the effects of [Ca2+]i and ISO are phenotypically similar, but appear additive. That is, even at a [Ca2+]i that seems maximal with respect to [Ca2+]i, ISO still causes a further change in I MAX, V 1/2 and deactivation.
Figure 6. [Ca2+]i slows deactivation of I Ks .
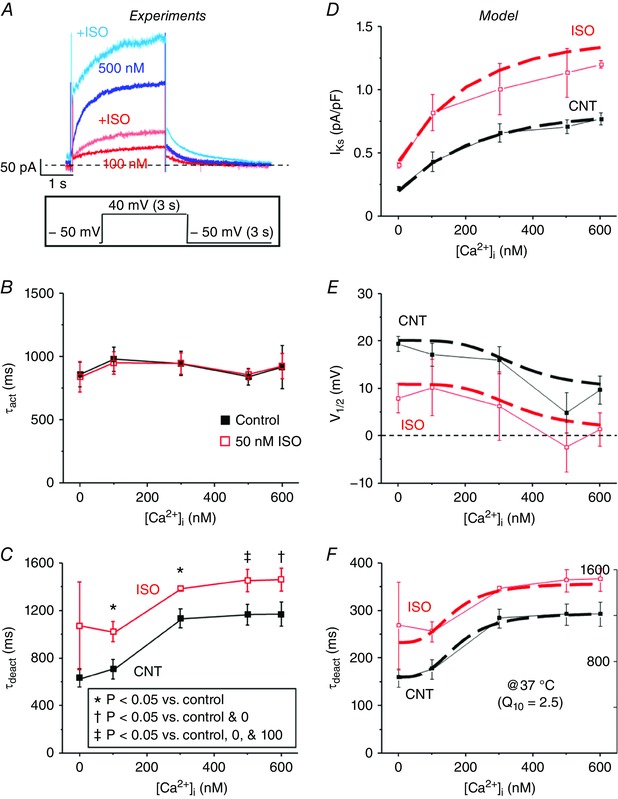
A, representative traces of I Ks recorded using pipette solutions with free [Ca2+]i of 100 and 500 nm before (100 nm, red; 500 nm, blue) and after (100 nm, light red; 500 nm, light blue) ISO are overlaid. I Ks was recorded using the same V m protocol as in Fig. 3 C by applying a step pulse from −50 to 40 mV for 3 s, followed by a tail pulse to −50 mV for 3 s. B, τact of I Ks was fitted to a single exponential during the step pulse to 40 mV and is plotted as a function of free [Ca2+]i in the pipette solution before (black) and after (red) ISO perfusion for 0, 100, 300, 500, and 600 nm [Ca2+]i. C, the decay in tail I Ks following the 40 mV step‐pulse was fitted to a single exponential to determine τdeact and is plotted as a function of free [Ca2+]i in the pipette solution before and after ISO perfusion for 0, 100, 300, 500, and 600 nm [Ca2+]i. The n values for each situation are the same as in Fig. 5. The [Ca2+]i dependence and ISO effects (50 nm) on I Ks (D), V 1/2, (E) and τdeact (F) were incorporated into a model of I Ks based on the experimental data and was scaled to 37 °C. Simulated I Ks (dashed lines) are shown overlaid with experimental results (solid lines).
I Ks increases during an AP with high buffered [Ca2+]i and during physiological Ca2+ transients
Figure 6 D–F shows how our updated I Ks model recapitulates our experimental results, with respect to the Ca2+ and ISO dependence of current amplitude, voltage dependence, and deactivation kinetics. During AP‐clamp simulations at 1 Hz we further tested how normal CaTs vs. [Ca2+]i clamping affected I Ks (Fig. 7 A–C). When [Ca2+]i was clamped at 100 nm, I Ks was small, but I Ks was ∼3‐fold larger when [Ca2+]i was clamped at 500 nm. When [Ca2+]i was unbuffered, which allowed normal dynamic CaTs, I Ks was nearly identical to the 500 nm simulations (Fig. 7 B). This seemed somewhat surprising, because the peak submembrane and cleft [Ca2+]i where the potassium channels reside rises much higher (∼12 and 220 μm, respectively, in the model), far exceeding the [Ca2+]i used in the [Ca2+]i‐clamp experiments. This would suggest that in myocytes I Ks is typically maximally Ca2+‐activated at [Ca2+]i > 600 nm, which would virtually always occur during the AP in the submembrane and cleft domains. The only noticeable difference in the unbuffered and 500 nm curves in Fig. 7 B is that I Ks declines slightly faster in the unbuffered case, consistent with the declining CaT at that time (between the 100 and 500 nm clamp curves in Fig. 7 C).
Figure 7. Ca2+ dependence of HMR‐sensitive I Ks activated during AP waveform.
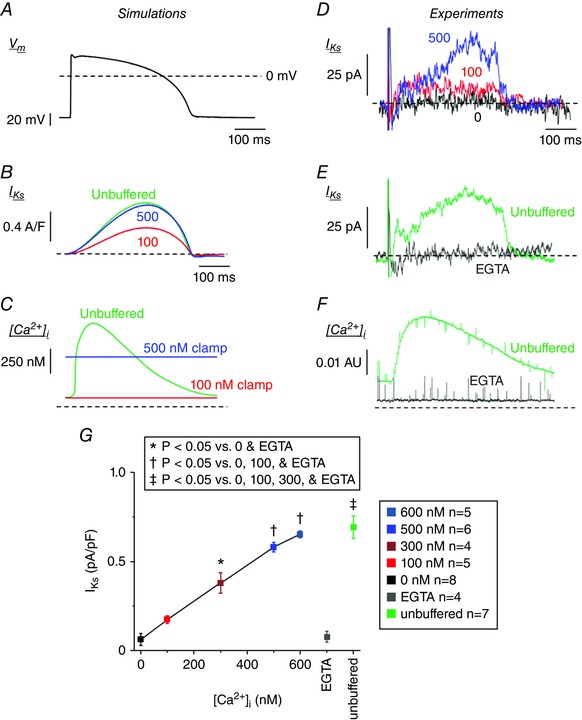
A, rabbit ventricular AP waveform used for AP simulations and to record HMR‐1556‐sensitive I Ks at 35–37°C. B and C, time courses of I Ks (B) and CaT (C) during 1 Hz computational simulations using the AP waveform as in Fig. 7 A are shown with [Ca2+]i clamped at 100 (red) and 500 nm (blue), or unbuffered (Free CaT, green). D, representative whole‐cell current subtracted HMR‐sensitive (1 μm) I Ks traces are overlaid for cells recorded with free [Ca2+]i of 0 (black), 100 (red) and 500 nm (blue). E, representative whole‐cell current subtracted HMR‐sensitive (1 μm) I Ks traces are overlaid for cells recorded (using the AP waveform in Fig. 7 A as the V m command) with [Ca2+]i heavily buffered by 10 mm EGTA (grey) or unbuffered (green). F, the corresponding Ca2+ signal is shown. Note that free [Ca2+]i is reduced at baseline and during the AP when buffered, and a normal CaT is present when unbuffered. G, the peak I Ks during ventricular AP waveform recordings are plotted for cells recorded using a pipette solution containing free [Ca2+]i of 0, 100, 300, 500, or 600 nm, and buffered with EGTA or unbuffered.
To explore these in silico inferences experimentally, we measured I Ks during AP‐clamp conditions (Fig. 7 D–G) using a typical rabbit ventricular AP waveform recorded from freshly isolated rabbit ventricular myocytes at 35–37°C. HMR‐1556 (1 μm) was used to isolate I Ks as the HMR‐sensitive current activated during the AP. We again used pipette solutions with free [Ca2+]i clamped at 0, 100, 300, 500 and 600 nm (now at physiological temperature; Fig. 7 D and G). Similar to the room temperature experiments (Figs 1, 2, 3, 4, 5, 6), the HMR‐sensitive I Ks increased in a [Ca2+]‐dependent manner (Fig. 7 G). The Ca2+ dependence was less obviously saturating at 600 nm (vs. Figs 2 D and 5 D), but the I Ks at 300 nm was ∼60% of that at 600 nm [Ca2+]i.
In this experimental series we also used pipette solutions that were either unbuffered (no BAPTA or dibromo‐BAPTA), which allows normal CaTs to occur, or heavily buffered with 10 mm EGTA, i.e. similar to the 0 nm [Ca2+]i BAPTA‐based solution (Fig. 7 E). [Ca2+]i was monitored again using Fluo 4‐AM and 50 μm Fluo 4‐K+ salt in the pipette to detect either a normal CaT during the AP (unbuffered) or a flat Ca2+ signal with 10 mm EGTA (Fig. 7 F). Figure 7 G shows that the peak I Ks during the AP in the unbuffered case was similar to that in the 600 nm [Ca2+]i‐clamp case. These data are consistent with the model prediction and suggest that I Ks is maximally activated when [Ca2+]i reaches > 500 nm, and that that condition is met during the normal CaT. We examined for, but could not detect any kinetic differences (e.g. I Ks in the unbuffered case being higher early and lower late), which is likely to be because noise levels and cell–cell variations in these small difference‐currents limited resolution of such kinetic differences.
Functional consequences of Ca2+ and ISO dependence of I Ks
To assess the impact and potential synergy of Ca2+ and ISO dependence of I Ks on AP repolarization, Fig. 8 shows simulations at a fast rate (3 Hz) in the absence of ISO and in the presence of either 20 nm ISO (submaximal) or 50 nm (near‐maximal and as used in experiments). During β‐adrenergic activation, the increase in I Ks is mostly a consequence of PKA phosphorylation, because the effect of [Ca2+]i augmentation on I Ks is already near maximal in control. That is, the higher CaT amplitude with ISO does not further increase I Ks. Importantly, our results show evident I Ks enhancement at this fast rate, and particularly, the slowed deactivation kinetics enhance instantaneous I Ks at the start of the subsequent AP. This factor gives I Ks a head‐start during the AP, ensuring that at high heart rates and shorter AP duration, I Ks can limit AP prolongation (together with PKA effects at other targets, e.g. I CaL and PLM; Negroni et al. 2015).
Figure 8. Ca2+ and ISO dependence of I Ks contribute to rabbit ventricular AP shortening during β‐AR stimulation.
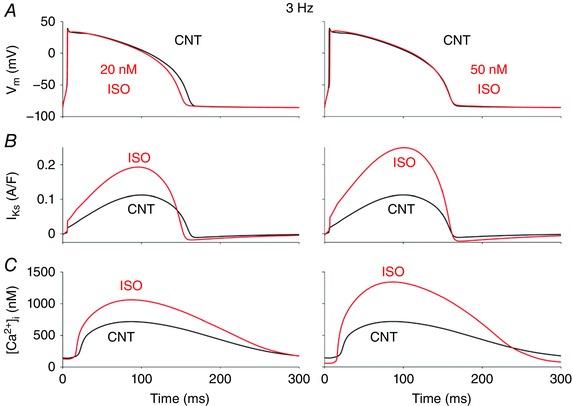
Simulated time courses of membrane potential, V m (A), I Ks (B) and CaT (C) during steady‐state 3 Hz pacing are shown before (black) and after (red) ISO (20 nm, left; and 50 nm, right).
Discussion
Many studies over the past several decades have shown how Ca2+ can directly or indirectly influence ion channel function in the heart, neurons, epithelial tissue and other important regions of the body. In contractile cells, such as cardiomyocytes, studying these mechanisms is technically difficult, because high levels of [Ca2+]i lead to contraction or cell death during recordings, and thus data acquisition is challenging. This is the first study to dissect the Ca2+ dependence of both I Ks and I Kr in rabbit ventricular myocytes and to provide direct evidence that [Ca2+]i is critical for I Ks function during a rabbit ventricular AP.
Key novel findings here are the following: (1) [Ca2+]i in the physiological range (K m ∼250 nm) dynamically regulates I Ks (and not I Kr). (2) The [Ca2+]i‐dependent effects are quite similar to those of ISO, in the extent to which they increase I Ks amplitude, negatively shift V 1/2 of activation, and slow deactivation. Likewise, neither an increase in [Ca2+]i nor β‐AR activation alter the slope of V m dependence activation (k) or τact. (3) The effects of increased [Ca2+]i and ISO are additive and both contribute to increase I Ks during β‐AR activation. (4) During the physiological AP and CaT, Ca2+‐dependent activation of I Ks is nearly maximal, even in the absence of ISO. These observations from experimental data were recapitulated in silico, and together suggest that although Ca2+ is critical for normal I Ks function, I Ks reaches a maximal amplitude at [Ca2+]i of ∼600 nm. Importantly, our experimental and simulated results suggest that I Ks kinetics are quite similar when [Ca2+]i is buffered at high concentrations or when [Ca2+]i is cycling in the cell during a CaT.
It has been estimated that ion channels at the sarcolemma ‘sense’ [Ca2+]i in the micromolar range during the initial milliseconds of a normal CaT during myocyte contraction, and in our simulations the [Ca2+] in the submembrane space reaches > 10 μm (Weber et al. 2002; Negroni et al. 2015). Our results suggest that Ca2+ regulates I Ks with sufficiently high affinity that this regulation is saturated at all submembrane [Ca2+]i levels that are likely to occur physiologically during each beat. We had hoped to assess the kinetics of Ca2+‐dependent activation during the physiological CaTs, where some cells showed rapid I Ks activation (as in the exemplar in Fig. 7 E). However, cell‐to‐cell variability and the small current size prevented unequivocal distinction with respect to the early phase of I Ks with SR Ca2+ release vs. [Ca2+]i clamp at 500 nm. The modelling simulations in Fig. 7 B illustrate that the theoretical difference is expected to be quite small.
Comparison with previous studies
Previous studies have assessed the Ca2+ dependence of I K in guinea pig ventricular myocytes by whole‐cell and excised patches (Tohse, 1990; Nitta et al. 1994). Both studies showed that I K increased in a concentration‐dependent manner with increasing [Ca2+]i with slightly higher affinity than our results (K m ∼38 nm, N H = 1.4 in Nitta et al. 1994 vs 253 nm, N H = 2.4). Note, that Tohse (1990) tested only up to 100 nm [Ca2+]i. Most modern AP models have used a K m for I Ks [Ca2+]i dependence of either 38 or 63 nm (Zeng et al. 1995; Negroni et al. 2015). We have now updated the I Ks model within Negroni et al. (2015) to fit our present data. Nitta et al. (1994) found a negative shift in the V 1/2 of I K activation while Tohse (1990) did not. These studies provide evidence that I K could limit Ca2+ entry by accelerating repolarization and subsequently promoting Ca2+ extrusion from the cytosol. However, the Ca2+ sensitivity was never distinguished between I Kr and I Ks, and I Ks amplitude and kinetics in guinea pig differ greatly from larger mammals such as rabbit, dog and human (Jost et al. 2007; Bartos et al. 2015). Our results clearly distinguish that rabbit I Ks is highly Ca2+ sensitive, but I Kr is not. We also show that the voltage dependence of I Ks was negatively shifted and deactivation kinetics were slowed by high [Ca2+]i, consistent with previous findings.
I Ks increases in a Ca2+‐dependent manner, but I Kr is larger at all [Ca2+]i tested here and is the key outward current during normal rabbit ventricular repolarization. However, I Ks reaches an amplitude similar to I Kr subsequent to ISO perfusion when recorded with high [Ca2+]i, thus highlighting the importance of β‐adrenergic regulation of I Ks. These observations align with dynamic clamp recordings in guinea pig myocytes made while maintaining physiological [Ca2+]i cycling, whereby I Ks is larger than I Kr subsequent to β‐adrenergic stimulation (Banyasz et al. 2014). Regardless of ISO perfusion, rabbit I Ks increases ∼3.5‐fold when [Ca2+]i is increased from 0 to 500–600 nm. Importantly, at all Ca2+ concentrations ISO perfusion still led to an increase of I Ks by ∼2× (Fig. 9). These results resemble the original I K observations in guinea pig ventricular myocytes, where even with PKA or PKC activity inhibited, I K remained augmented at elevated [Ca2+] (Nitta et al. 1994). We conclude that β‐adrenergic activation is able to stimulate I Ks in a manner independent of [Ca2+]i; however, the similar (and additive) effects might imply a common molecular shift. Specifically, several studies showed how PKA phosphorylation at S27 on the N‐terminus of Kv7.1 leads to a reduction in drug sensitivity suggesting that PKA phosphorylation restricts allosteric drug binding because of changes in the molecular conformation of Kv7.1 (Yang et al. 2009, 2013; Bartos et al. 2014). The ISO‐ and Ca2+‐dependent changes in I Ks biophysical properties are similar, and these effects may influence the voltage‐sensing and pore domains in a comparable fashion. However, the ISO‐dependent process may originate in the N‐terminus and the Ca2+ dependency may act via direct binding to CaM on the C‐terminus of Kv7.1.
Figure 9. Effects of Ca2+ and ISO dependence of rabbit I Ks .
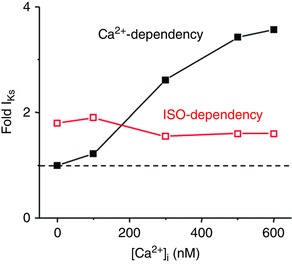
Dashed line represents I Ks amplitude under control conditions when [Ca2+]i is highly buffered essentially to 0 in the pipette solution (based on data in Fig. 5 D).
When using high [Ca2+]i, it is noteworthy that both main ventricular myocyte isoforms of adenylyl cyclase (AC; AC5 in adult and AC6 in neonate) are partially inhibited by high [Ca2+]i, in part by competing with Mg2+‐dependent activation (Hu et al. 2002). Over the physiological range of [Ca2+]i and [Mg2+]i, this may limit, but not prevent, AC activation by β‐adrenergic agonists. Indeed, there is little question that β1‐adrenergic activation strongly activates both cAMP production and PKA activity in cardiac myocytes despite a concurrent rise in [Ca2+]i that might temper AC5 activation. Furthermore, the fact that the curves in Fig. 5 D are relatively parallel demonstrates that the high [Ca2+]i is not preventing β‐adrenergic‐dependent increase in I Ks at that [Ca2+]i. This tells us that the physiologically resulting effect of these two activating effects predominate over Ca2+‐dependent AC inhibition. It is conceivable that the apparent slight decrease in percentage increase of I Ks by ISO at higher [Ca2+]i (Fig. 9, red curve) might reflect this AC effect, but that is only speculation.
Ca2+ regulation of I Ks involves proper binding of CaM to the Kv7.1 macromolecular complex
Reports of LQT1 mutants in IQ motifs of Kv7.1 and structural modelling insight suggest that CaM is required for proper I Ks function in native and heterologous systems (Nitta et al. 1994; Bai et al. 2005; Ghosh et al. 2006; Shamgar et al. 2006; Sachyani et al. 2014). Mutants that disrupt the IQ motifs critical for CaM binding to the C‐terminus of Kv7.1 or engineered mutations that disrupt the EF hand on the N‐lobe of CaM (rendering the N‐lobe of CaM Ca2+‐insensitive) suggest that CaM is constitutively bound to Kv7.1 and Ca2+ dependency of I Ks is a CaM‐dependent process (Ghosh et al. 2006; Shamgar et al. 2006; Sachyani et al. 2014). When Kv7.1–CaM interactions are disrupted, I Ks is largely reduced and the voltage dependence of activation is positively shifted. Furthermore, we found that rabbit I Ks recorded with high [Ca2+]i (500 nm) was inhibited by 50% following perfusion of W7, a CaM antagonist (Figure 3 C). These studies and our results suggest that Ca2+ sensitivity of I Ks is a CaM‐mediated process, with an apparent K m in the physiological [Ca2+]i range.
Physiological impact of the Ca2+ dependence of I Ks
It is likely that the negative shift in voltage dependence of activation and postponed deactivation of rabbit I Ks contribute to the increase in current amplitude subsequent to a rise in [Ca2+]i, as replicated by our mathematical model. Recent studies have showed that an elevation in [Ca2+]i or cellular stress leads to higher co‐localization of Kv7.1 with KCNE1 at the sarcolemma of guinea pig ventricular myocytes, which one would expect to result in increased I Ks (Wang et al. 2013). Alterations in Kv7.1 protein expression at the cell surface were not assessed in our study, but rapid increases in surface expression could conceivably contribute to the overall Ca2+‐induced increase in rabbit I Ks density.
Our simulation results suggest that during β‐adrenergic activation both Ca2+ increase and PKA‐dependent phosphorylation contribute to I Ks enhancement that tends to abbreviate the cardiac AP. Although speculative, our data and other studies support the concept that Ca2+ sensitivity of I Ks is crucial for the repolarization reserve during situations when cells are overloaded with Ca2+, for example during heart failure.
Clinical significance
In heart failure, impaired [Ca2+]i dynamics (elevated diastolic [Ca2+]i and attenuated CaT) and AP prolongation are a common observation in cellular pathophysiology. Here, we show that normal CaTs are necessary for normal I Ks function, and suppression of [Ca2+]i leads to reduced I Ks. This may suggest that pathological AP prolongation and Ca2+‐loading favours the role of I Ks during repolarization. Therapeutic strategies designed to restore normal [Ca2+]i dynamics and regulation of ion channel function, specifically Ca2+‐dependent channels like I Ks, may prevent the occurrence of lethal arrhythmias and lead to a retention of the repolarization reserve in patients with heart failure.
Conclusions
We have shown that increasing [Ca2+]i from 0 to 600 nm in rabbit ventricular myocytes increased maximally activated I Ks, negatively shifted I Ks voltage dependence of activation, and slowed deactivation kinetics, similar to β‐adrenergic stimulation, without affecting I Kr properties. During a physiological AP and CaT, measured and simulated I Ks were comparable to that measured or simulated when [Ca2+]i was buffered at 500–600 nm, suggesting that Ca2+ regulation of I Ks is saturated at high submembrane [Ca2+]i that occurs normally during the CaT. For the first time, this study distinguishes the Ca2+ dependence of I Ks and I Kr and provides direct measurement of the role of [Ca2+]i in shaping I Ks function during a rabbit ventricular AP.
Additional information
Competing interests
No competing interests exist.
Author contributions
Conceived and designed the experiments and simulations: D.C.B, S.M., K.S.G., E.G. and D.M.B. Performed the experiments and simulations: D.C.B, S.M. Analysed and interpreted the results: D.C.B, S.M., K.S.G., E.G. and D.M.B. Wrote the manuscript: D.C.B, S.M., E.G. and D.M.B. All authors approved the final version of the manuscript and all persons designated as authors qualify for authorship, and all those who qualify for authorship are listed.
Funding
This work was supported by the National Institutes of Health NRSA postdoctoral award F32 HL126331 (D.C.B.), R01 grants HL131517 (E.G.) and HL030077 and P01‐HL080101 (D.M.B.), the American Heart Association Scientist Development Grant 15SDG24910015 (E.G.) and postdoctoral fellowship 2014POST18380011 (S.M.), and the Heart Rhythm Society postdoctoral fellowship 16OA9HRS (S.M.).
Linked articles This article is highlighted by a Perspective by Hill. To read this Perspective, visit https://doi.org/10.1113/JP273940.
References
- Bai CX, Namekata I, Kurokawa J, Tanaka H, Shigenobu K & Furukawa T (2005). Role of nitric oxide in Ca2+ sensitivity of the slowly activating delayed rectifier K+ current in cardiac myocytes. Circ Res 96, 64–72. [DOI] [PubMed] [Google Scholar]
- Bai CX, Takahashi K, Masumiya H, Sawanobori T & Furukawa T (2004). Nitric oxide‐dependent modulation of the delayed rectifier K+ current and the L‐type Ca2+ current by ginsenoside Re, an ingredient of Panax ginseng, in guinea‐pig cardiomyocytes. Br J Pharmacol 142, 567–575. [DOI] [PMC free article] [PubMed] [Google Scholar]
- Banyasz T, Horvath B, Jian Z, Izu LT & Chen‐Izu Y (2011). Sequential dissection of multiple ionic currents in single cardiac myocytes under action potential‐clamp. J Mol Cell Cardiol 50, 578–581. [DOI] [PMC free article] [PubMed] [Google Scholar]
- Banyasz T, Jian Z, Horvath B, Khabbaz S, Izu LT & Chen‐Izu Y (2014). Beta‐adrenergic stimulation reverses the I Kr–I Ks dominant pattern during cardiac action potential. Pflugers Arch 466, 2067–2076. [DOI] [PMC free article] [PubMed] [Google Scholar]
- Barhanin J, Lesage F, Guillemare E, Fink M, Lazdunski M & Romey G (1996). KVLQT1 and lsK (minK) proteins associate to form the I Ks cardiac potassium current. Nature 384, 78–80. [DOI] [PubMed] [Google Scholar]
- Bartos DC, Giudicessi JR, Tester DJ, Ackerman MJ, Ohno S, Horie M, Gollob MH, Burgess DE & Delisle BP (2014). A KCNQ1 mutation contributes to the concealed type 1 long QT phenotype by limiting the Kv7.1 channel conformational changes associated with protein kinase A phosphorylation. Heart Rhythm 11, 459–468. [DOI] [PMC free article] [PubMed] [Google Scholar]
- Bartos DC, Grandi E & Ripplinger CM (2015). Ion channels in the heart. Compr Physiol 5, 1423–1464. [DOI] [PMC free article] [PubMed] [Google Scholar]
- Bassani JW, Bassani RA & Bers DM (1995). Calibration of indo‐1 and resting intracellular [Ca]i in intact rabbit cardiac myocytes. Biophys J 68, 1453–1460. [DOI] [PMC free article] [PubMed] [Google Scholar]
- Bers DM (2002). Cardiac excitation‐contraction coupling. Nature 415, 198–205. [DOI] [PubMed] [Google Scholar]
- El‐Sherif N, Chinushi M, Caref EB & Restivo M (1997). Electrophysiological mechanism of the characteristic electrocardiographic morphology of torsade de pointes tachyarrhythmias in the long‐QT syndrome: detailed analysis of ventricular tridimensional activation patterns. Circulation 96, 4392–4399. [DOI] [PubMed] [Google Scholar]
- Ghosh S, Nunziato DA & Pitt GS (2006). KCNQ1 assembly and function is blocked by long‐QT syndrome mutations that disrupt interaction with calmodulin. Circ Res 98, 1048–1054. [DOI] [PubMed] [Google Scholar]
- Goldenberg I, Thottathil P, Lopes CM, Moss AJ, McNitt S, O‐Uchi J, Robinson JL, Zareba W, Ackerman MJ, Kaufman ES, Towbin JA, Vincent M & Barsheshet A (2012). Trigger‐specific ion‐channel mechanisms, risk factors, and response to therapy in type 1 long QT syndrome. Heart Rhythm 9, 49–56. [DOI] [PubMed] [Google Scholar]
- Grandi E, Pasqualini FS & Bers DM (2010). A novel computational model of the human ventricular action potential and Ca transient. J Mol Cell Cardiol 48, 112–121. [DOI] [PMC free article] [PubMed] [Google Scholar]
- Harkins AB, Kurebayashi N & Baylor SM (1993). Resting myoplasmic free calcium in frog skeletal muscle fibers estimated with fluo‐3. Biophys J 65, 865–881. [DOI] [PMC free article] [PubMed] [Google Scholar]
- Heath BM & Terrar DA (1996). The deactivation kinetics of the delayed rectifier components I Kr and I Ks in guinea‐pig isolated ventricular myocytes. Exp Physiol 81, 605–621. [DOI] [PubMed] [Google Scholar]
- Heijman J, Spatjens RL, Seyen SR, Lentink V, Kuijpers HJ, Boulet IR, de Windt LJ, David M & Volders PG (2012). Dominant‐negative control of cAMP‐dependent IKs upregulation in human long‐QT syndrome type 1. Circ Res 110, 211–219. [DOI] [PubMed] [Google Scholar]
- Hu B, Nakata H, Gu C, De Beer T & Cooper DM (2002). A critical interplay between Ca2+ inhibition and activation by Mg2+ of AC5 revealed by mutants and chimeric constructs. J Biol Chem 277, 33139–33147. [DOI] [PubMed] [Google Scholar]
- Jost N, Papp JG & Varro A (2007). Slow delayed rectifier potassium current (IKs) and the repolarization reserve. Ann Noninvasive Electrocardiol 12, 64–78. [DOI] [PMC free article] [PubMed] [Google Scholar]
- Jost N, Virag L, Bitay M, Takacs J, Lengyel C, Biliczki P, Nagy Z, Bogats G, Lathrop DA, Papp JG & Varro A (2005). Restricting excessive cardiac action potential and QT prolongation: a vital role for IKs in human ventricular muscle. Circulation 112, 1392–1399. [DOI] [PubMed] [Google Scholar]
- Li GR, Feng J, Yue L, Carrier M & Nattel S (1996). Evidence for two components of delayed rectifier K+ current in human ventricular myocytes. Circ Res 78, 689–696. [DOI] [PubMed] [Google Scholar]
- Liu DW & Antzelevitch C (1995). Characteristics of the delayed rectifier current (IKr and IKs) in canine ventricular epicardial, midmyocardial, and endocardial myocytes. A weaker IKs contributes to the longer action potential of the M cell. Circ Res 76, 351–365. [DOI] [PubMed] [Google Scholar]
- Marx SO, Kurokawa J, Reiken S, Motoike H, D'Armiento J, Marks AR & Kass RS (2002). Requirement of a macromolecular signaling complex for β adrenergic receptor modulation of the KCNQ1‐KCNE1 potassium channel. Science 295, 496–499. [DOI] [PubMed] [Google Scholar]
- Negroni JA, Morotti S, Lascano EC, Gomes AV, Grandi E, Puglisi JL & Bers DM (2015). β‐adrenergic effects on cardiac myofilaments and contraction in an integrated rabbit ventricular myocyte model. J Mol Cell Cardiol 81, 162–175. [DOI] [PMC free article] [PubMed] [Google Scholar]
- Nerbonne JM & Kass RS (2005). Molecular physiology of cardiac repolarization. Physiol Rev 85, 1205–1253. [DOI] [PubMed] [Google Scholar]
- Nitta J, Furukawa T, Marumo F, Sawanobori T & Hiraoka M (1994). Subcellular mechanism for Ca2+‐dependent enhancement of delayed rectifier K+ current in isolated membrane patches of guinea pig ventricular myocytes. Circ Res 74, 96–104. [DOI] [PubMed] [Google Scholar]
- Pogwizd SM, Qi M, Yuan W, Samarel AM & Bers DM (1999). Upregulation of Na+/Ca2+ exchanger expression and function in an arrhythmogenic rabbit model of heart failure. Circ Res 85, 1009–1019. [DOI] [PubMed] [Google Scholar]
- Pogwizd SM, Schlotthauer K, Li L, Yuan W & Bers DM (2001). Arrhythmogenesis and contractile dysfunction in heart failure: Roles of sodium‐calcium exchange, inward rectifier potassium current, and residual β‐adrenergic responsiveness. Circ Res 88, 1159–1167. [DOI] [PubMed] [Google Scholar]
- Sachyani D, Dvir M, Strulovich R, Tria G, Tobelaim W, Peretz A, Pongs O, Svergun D, Attali B & Hirsch JA (2014). Structural basis of a Kv7.1 potassium channel gating module: studies of the intracellular c‐terminal domain in complex with calmodulin. Structure 22, 1582–1594. [DOI] [PubMed] [Google Scholar]
- Salata JJ, Jurkiewicz NK, Jow B, Folander K, Guinosso PJ Jr, Raynor B, Swanson R & Fermini B (1996). IK of rabbit ventricle is composed of two currents: evidence for IKs . Am J Physiol Heart Circ Physiol 271, H2477–H2489. [DOI] [PubMed] [Google Scholar]
- Sanguinetti MC, Curran ME, Zou A, Shen J, Spector PS, Atkinson DL & Keating MT (1996). Coassembly of KVLQT1 and minK (IsK) proteins to form cardiac IKs potassium channel. Nature 384, 80–83. [DOI] [PubMed] [Google Scholar]
- Sanguinetti MC & Jurkiewicz NK (1990). Two components of cardiac delayed rectifier K+ current. Differential sensitivity to block by class III antiarrhythmic agents. J Gen Physiol 96, 195–215. [DOI] [PMC free article] [PubMed] [Google Scholar]
- Schwartz PJ, Priori SG, Spazzolini C, Moss AJ, Vincent GM, Napolitano C, Denjoy I, Guicheney P, Breithardt G, Keating MT, Towbin JA, Beggs AH, Brink P, Wilde AA, Toivonen L, Zareba W, Robinson JL, Timothy KW, Corfield V, Wattanasirichaigoon D, Corbett C, Haverkamp W, Schulze‐Bahr E, Lehmann MH, Schwartz K, Coumel P & Bloise R (2001). Genotype‐phenotype correlation in the long‐QT syndrome: gene‐specific triggers for life‐threatening arrhythmias. Circulation 103, 89–95. [DOI] [PubMed] [Google Scholar]
- Selnick HG, Liverton NJ, Baldwin JJ, Butcher JW, Claremon DA, Elliott JM, Freidinger RM, King SA, Libby BE, McIntyre CJ, Pribush DA, Remy DC, Smith GR, Tebben AJ, Jurkiewicz NK, Lynch JJ, Salata JJ, Sanguinetti MC, Siegl PK, Slaughter DE & Vyas K (1997). Class III antiarrhythmic activity in vivo by selective blockade of the slowly activating cardiac delayed rectifier potassium current I Ks by (R)‐2‐(2,4‐Trifluoromethyl)‐N‐[2‐oxo‐5‐phenyl‐1‐(2,2,2‐trifluoroethyl)‐ 2, 3‐dihydro‐1H‐benzo[e][1,4]diazepin‐3‐yl]acetamide. J Med Chem 40, 3865–3868. [DOI] [PubMed] [Google Scholar]
- Shah M, Akar FG & Tomaselli GF (2005). Molecular basis of arrhythmias. Circulation 112, 2517–2529. [DOI] [PubMed] [Google Scholar]
- Shamgar L, Ma L, Schmitt N, Haitin Y, Peretz A, Wiener R, Hirsch J, Pongs O & Attali B (2006). Calmodulin is essential for cardiac IKs channel gating and assembly: impaired function in long‐QT mutations. Circ Res 98, 1055–1063. [DOI] [PubMed] [Google Scholar]
- Shannon TR, Wang F, Puglisi J, Weber C & Bers DM (2004). A mathematical treatment of integrated Ca dynamics within the ventricular myocyte. Biophys J 87, 3351–3371. [DOI] [PMC free article] [PubMed] [Google Scholar]
- Splawski I, Tristani‐Firouzi M, Lehmann MH, Sanguinetti MC & Keating MT (1997). Mutations in the hminK gene cause long QT syndrome and suppress IKs function. Nat Genet 17, 338–340. [DOI] [PubMed] [Google Scholar]
- Tohse N (1990). Calcium‐sensitive delayed rectifier potassium current in guinea pig ventricular cells. Am J Physiol Heart Circ Physiol 258, H1200–H1207. [DOI] [PubMed] [Google Scholar]
- Walsh KB & Kass RS (1988). Regulation of a heart potassium channel by protein kinase A and C. Science 242, 67–69. [DOI] [PubMed] [Google Scholar]
- Wang Q, Curran ME, Splawski I, Burn TC, Millholland JM, VanRaay TJ, Shen J, Timothy KW, Vincent GM, de Jager T, Schwartz PJ, Toubin JA, Moss AJ, Atkinson DL, Landes GM, Connors TD & Keating MT (1996). Positional cloning of a novel potassium channel gene: KVLQT1 mutations cause cardiac arrhythmias. Nat Genet 12, 17–23. [DOI] [PubMed] [Google Scholar]
- Wang Y, Zankov DP, Jiang M, Zhang M, Henderson SC & Tseng GN (2013). [Ca2+]i elevation and oxidative stress induce KCNQ1 protein translocation from the cytosol to the cell surface and increase slow delayed rectifier (IKs) in cardiac myocytes. J Biol Chem 288, 35358–35371. [DOI] [PMC free article] [PubMed] [Google Scholar]
- Weber CR, Piacentino V 3rd, Ginsburg KS, Houser SR & Bers DM (2002). Na+‐Ca2+ exchange current and submembrane [Ca2+] during the cardiac action potential. Circ Res 90, 182–189. [DOI] [PubMed] [Google Scholar]
- Yang T, Kanki H, Zhang W & Roden DM (2009). Probing the mechanisms underlying modulation of quinidine sensitivity to cardiac IKs block by protein kinase A‐mediated IKs phosphorylation. Br J Pharmacol 157, 952–961. [DOI] [PMC free article] [PubMed] [Google Scholar]
- Yang T, Smith JA, Leake BF, Sanders CR, Meiler J & Roden DM (2013). An allosteric mechanism for drug block of the human cardiac potassium channel KCNQ1. Mol Pharmacol 83, 481–489. [DOI] [PMC free article] [PubMed] [Google Scholar]
- Zeng J, Laurita KR, Rosenbaum DS & Rudy Y (1995). Two components of the delayed rectifier K+ current in ventricular myocytes of the guinea pig type. Theoretical formulation and their role in repolarization. Circ Res 77, 140–152. [DOI] [PubMed] [Google Scholar]


