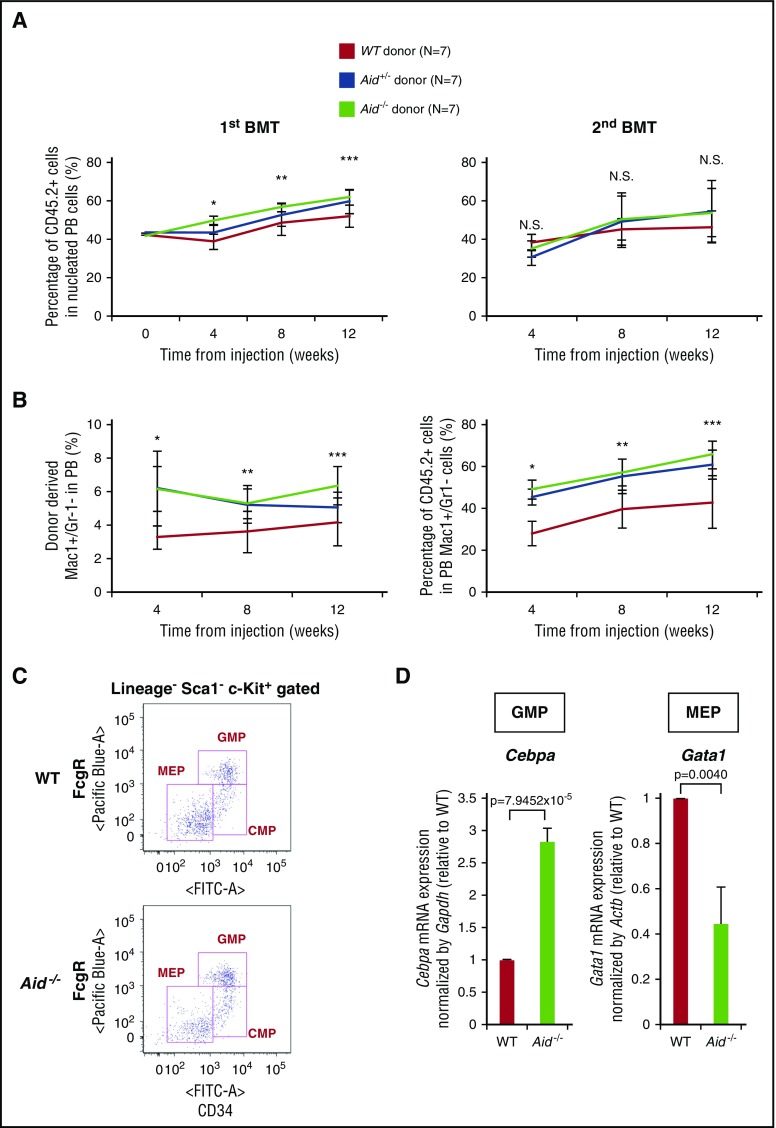
Figure 3.
Ablation of Aid does not affect long-term HSC self-renewal but causes altered expression of Cebpa and Gata1 in myeloid progenitors. (A) Percentage of donor-derived cells (CD45.2+ cells) in PB of primary recipients (left) and secondary recipients (right). The data are mean ± SD (n = 7 for each genotype). The asterisks indicate the P value: *(P = .0444 [WT vs Aid+/−], P = .0072 [Aid+/− vs Aid−/−], P = 3.3075 × 10⁻⁵ [WT vs Aid−/−]); **(P = .0071 [WT vs Aid−/−]); ***(P = .0467 [WT vs Aid+/−], P = .0035 [WT vs Aid−/−]). (B) Left graph shows the percentage of donor-derived Mac1+/Gr1− cells in PB of primary recipients. Asterisks indicate the P value: *(P = .0059 [WT vs Aid+/−], P = .0003 [WT vs Aid−/−]); **(P = .0246 [WT vs Aid+/−], P = .0134 [WT vs Aid−/−]); ***(P = .0368 [Aid+/− vs Aid−/−], P = .0088 [WT vs Aid−/−]). Right graph shows the percentage of donor-derived cells (CD45.2+ cells) in Mac1+/Gr1− cells in the PB of primary recipients. The data are mean ± SD (n = 7 for each genotype). Asterisks indicate the P value: *(P = 2.3610 × 10⁻⁵ [WT vs Aid+/−], P = 7.2218 × 10⁻⁶ [WT vs Aid−/−]); **(P = .0053 [WT vs Aid+/−], P = .0014 (WT vs Aid−/−]); ***(P = .0062 [WT vs Aid+/−], P = .0012 [WT vs Aid−/−]). (C) Gate plot for sorting myeloid progenitors from WT or Aid−/− adult mice around 12 months old. (D) Left bar graph shows the mRNA expression level of Cebpa in WT or Aid−/− GMP cells. Right bar graph shows the mRNA expression level of Gata1 in WT or Aid−/− MEP cells. Data were analyzed by the Δ Ct ratio technique using murine Gapdh or Actb gene as a housekeeping gene. Results are presented as the ratio of the Aid−/− value to the WT value. The data are mean ± SD (n = 3 for each genotype). BMT, bone marrow transplantation.

