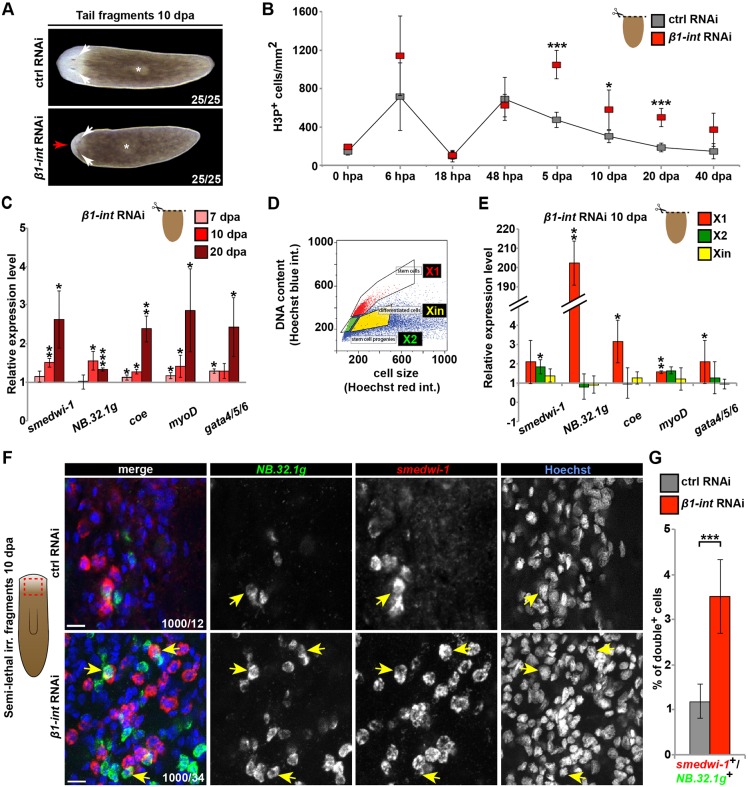
Fig. 1.
Impaired regeneration and altered neoblast behavior in regenerating β1-int RNAi planarians. (A) Control (ctrl) and β1-int RNAi tail fragments at 10 days post amputation (dpa). Red arrow points to small regeneration blastema, white arrows to regenerated eye spots; asterisks indicate regenerated pharynges. (B) Number of H3P+ cells in regenerating ctrl and β1-int RNAi tail fragments. Error bars represent s.d. of at least seven fragments. (C) qPCR analysis of indicated marker genes in ctrl and β1-int RNAi tail fragments. Expression levels in β1-int RNAi fragments were normalized to the corresponding ctrl RNAi samples. Error bars represent s.d. of three biological replicates with ten fragments each per condition. (D) Scheme of cell fractions isolated by FACS according to size and DNA content for gene expression analysis in E: X1 (red; neoblast with 4N DNA), X2 (green; neoblasts/small progeny with 2N DNA) and Xin (yellow; irradiation-insensitive postmitotic cells). (E) qPCR analysis on FACS-sorted planarian cell fractions from tail fragments. Expression levels in β1-int RNAi cell fractions were normalized to the corresponding ctrl RNAi samples. Error bars represent s.d. of three biological replicates with sorted cells from 30 fragments for each condition. (F) Double FISH against smedwi-1 (red) and NB.32.1g (green) indicates an increase in smedwi-1+/NB.32.1g+ cells (yellow arrows) in β1-int RNAi animals at 10 dpa and 11 days post sublethal irradiation (12.5 Gy). DNA is blue (Hoechst). Red box in scheme indicates imaged area in animals. (G) Evaluation of double smedwi-1+/NB.32.1g+ cells in ctrl and β1-int RNAi fragments. Error bars represent s.d. of counted cells from seven animals per condition. Statistical significance (Student's t-test) is indicated (*P≤0.05; **P≤0.01; ***P≤0.001). Scale bars: 10 µm.

