

Abstract
A coupled physical/biological modeling system was used to hindcast the 2005 Alexandrium fundyense bloom in the Gulf of Maine and investigate the relative importance of factors governing the bloom’s initiation and development. The coupled system consists of a state-of-the-art, free-surface primitive equation Regional Ocean Modeling System (ROMS) tailored for the Gulf of Maine (GOM) using a multi-nested configuration, and a population dynamics model for A. fundyense. The system was forced by realistic momentum and buoyancy fluxes, tides, river runoff, observed A. fundyense benthic cyst abundance, and climatological nutrient fields. Extensive comparisons were made between simulated (both physical and biological) fields and in-situ observations, revealing that the hindcast model is capable of reproducing the temporal evolution and spatial distribution of the 2005 bloom. Sensitivity experiments were then performed to distinguish the roles of three major factors hypothesized to contribute to the bloom: 1) the high abundance of cysts in western GOM sediments; 2) strong northeaster storms with prevailing downwelling-favorable winds; and 3) a large amount of fresh water input due to abundant rainfall and heavy snowmelt. Results suggested that the high abundance of cysts in western GOM was the primary factor of the 2005 bloom. Wind forcing was an important regulator, as episodic bursts of northeast winds caused onshore advection of offshore populations. These downwelling favorable winds accelerated the alongshore flow, resulting in transport of high cell concentrations into Massachusetts Bay. A large regional bloom would still have happened, however, even with normal or typical winds for that period. Anomalously high river runoff in 2005 resulted in stronger buoyant plumes/currents, which facilitated the transport of cell population to the western GOM. While affecting nearshore cell abundance in Massachusetts Bay, the buoyant plumes were confined near to the coast, and had limited impact on the gulf-wide bloom distribution.
Keywords: Coastal circulation, Harmful Algal Bloom, Bio-physical Numerical Modeling
1. Introduction
In summer 2005 the Gulf of Maine (GOM) experienced the largest harmful bloom of Alexandrium fundyense in at least 33 years for that region (Anderson et al., 2005). During this event, GOM hydrography, circulation, and surface momentum and buoyancy forcing were all found to be anomalous, some aspects of which may have contributed to the bloom and its impact along the coast (He et al., part 1. submitted). Biological factors may have played an important role as well, as A. fundyense has unique life history characteristics that lead to complicated bloom dynamics. Anderson (1998) summarized the life history of A. fundyense, which includes both a resting cyst and a planktonic phase of vegetative growth. In particular, cyst germination is the key process that initiates recurrent blooms that are self-seeding and propagatory in nature, supplying cells that populate the GOM (Anderson et al. 2005c). As such, the timing, intensity, and spatial distribution of blooms of this meroplanktonic dinoflagellate are determined collectively by complex interactions between the physical environment and biological processes.
While in situ observations provide valuable clues to physical and biological factors that may have been important for the 2005 bloom event, they are too sparse to depict the full space-time evolution of the bloom and to reveal the underlying circulation and bloom dynamics. In this regard, numerical model simulations offer a means by which detailed mechanisms regulating bloom initiation and development can be examined. Prior modeling studies have investigated various aspects of the A. fundyense dynamics in detail. Stock et al. (2005 (2007) examined the factors governing the initiation and development of an A. fundyense bloom in the western GOM during springs of 1993 and 1994. In those studies, coastal circulation was simulated using a three-dimensional Princeton Ocean model forced by climatological boundary conditions and observed winds, heat flux, and river discharge. It was coupled with an A. fundyense population dynamics sub-model constructed from laboratory and field data that estimates the germination and growth rates of A. fundyense as a function of ambient environmental conditions (Anderson et al. 2005c). McGillicuddy et al. (2005) coupled the same A. fundyense sub-model with GOM climatological seasonal mean flow. Simulated bloom conditions matched observations reasonably well, and were used to analyze the mechanisms regulating the mean large-scale seasonal fluctuations in the A. fundyense population.
The goal of this study is to apply an improved coupled physical-biological model that considers realistic surface and open boundary conditions to hindcast the massive A. fundyense bloom in 2005. Based on a combination of physical and biological observations, Anderson et al. (2005) hypothesized that three factors may have contributed to this record bloom: 1) strong northeasterly wind that facilitated onshore transport of offshore cell populations; 2) high river runoff, which increased the water stratification, and southwestward transport via buoyant coastal plume, as well as enhancing growth conditions via nutrient supply; 3) high abundance of A. fundyense cysts in the GOM sediments (the western GOM in particular), which provided an enhanced source population. Our objective here is to test these three hypotheses by performing model sensitivity experiments to differentiate and quantify the relative importance of these processes in regulating the 2005 bloom.
2. Methods
Our coupled modeling system consists of a circulation model and an A. fundyense population dynamics model. These two models are linked with advection and mixing, for which the physical model passes 3-d velocity and turbulence diffusivity fields to the biological model.
2.1. Circulation Modeling
The coastal circulation simulations was performed using the Regional Ocean Modeling System (ROMS), a free-surface, hydrostatic, primitive-equation model in widespread use for estuarine, coastal and shelf-wide applications, e.g. (Dinniman et al. 2003; Lutjeharms et al. 2003; MacCready and Geyer 2001; Marchesiello et al. 2003; Peliz et al. 2003). ROMS employs split-explicit separation of fast barotropic and slow baroclinic modes, and is formulated in vertically stretched terrain-following coordinates using algorithms described in detail by Shchepetkin and McWilliams (1998; 2003; 2005). The ROMS computational kernel includes high-order advection and time-stepping schemes, weighted temporal averaging of the barotropic mode to reduce aliasing into the slow baroclinic motions, and conservative parabolic splines for vertical discretization. A redefinition of the barotropic pressure-gradient term is also applied in ROMS to reduce the pressure-gradient truncation error, which has previously limited the accuracy of terrain-following coordinate models.
To overcome the difficulties associated with defining open boundary conditions for a regional coastal circulation model, we implemented a multi-nested configuration (Figure 1), which allows direct connection between the north Atlantic basin scale circulation with the targeted GOM coastal circulation. The North Atlantic (NA) circulation hindcasts were provided by Naval Research Laboratory and University of Miami using the Hybrid Coordinate Ocean Model (HYCOM). As part of the Global Ocean Data Assimilation Experiment (GODAE), the NA-HYCOM assimilates satellite observed sea surface temperature and sea surface heights, providing daily estimates of North Atlantic Circulation at ~ 10 km resolution (http://hycom.rsmas.miami.edu/dataserver).
Figure 1.

Multi-nested configuration for the regional GOM circulation and A. fundyense bloom modeling. The outermost model is the data assimilative North Atlantic HYCOM, which provides open boundary conditions (OBCs) for the shelf-scale ROMS model, which in turn provides OBCs for the innermost Gulf of Maine ROMS model.
Inside HYCOM, we nested a shelf-scale ROMS, which encompasses both the Gulf of Maine and the Middle Atlantic Bight. Horizontal resolution varies from 5 km near the coast to 10 km in the deep ocean. Vertically, there are 36 terrain-following sigma levels in the water column with higher resolution near the surface and bottom in order to better resolve boundary layers. A one-way nesting approach was used to connect shelf-scale ROMS with the basin scale HYCOM. Specifically, open boundary conditions (OBCs) were applied to tracers and baroclinic velocity following the method of Marchesiello et al. (2001), whereby Orlanski-type radiation conditions were used in conjunction with relaxation (with timescale of 0.5 days on inflow and 10 days on outflow) to HYCOM solutions. Free surface and depth-integrated velocity boundary conditions were specified using the method of Flather (1976) with the external values defined by HYCOM plus tidal harmonics from an ADCIRC simulation of the western Atlantic (Luettich et al. 1992). We applied the method of Mellor and Yamada (1982) to compute vertical turbulent mixing, as well as the quadratic drag formulation for the bottom friction specification. The same one-way nesting approach and OBC treatment were then applied to downscale the shelf-scale circulation to the inner-most nest for the GOM. The GOM ROMS model has a spatial resolution ranging from 1 km near the coast to 3 km in the offshore gulf water. There are also 36 layers in the vertical having the same resolution distribution as the shelf-scale ROMS.
Distinctive advantages of such multi-nested configuration include: 1) it allows us to account for the impacts of upstream and deep-ocean forcing on the GOM circulation in a dynamically consistent and quantitatively accurate manner; and 2) the high resolution enables the GOM ROMS to resolve important small-scale coastal dynamics (e.g., river plumes), which are critical for resolving the transport and distribution of A. fundyense population. Given the nature of one-way nesting, model hindcasts were performed in a sequential order. The nested shelf-scale ROMS hindcast was performed first, in which only the hydrodynamics was computed; then with OBCs from shelf-scale ROMS, the nested GOM ROMS hindcast was carried out, in which both hydrodynamics and the A. fundyense cell concentration were simulated simultaneously. Both the shelf-scale and GOM ROMS hindcasts started on March 1st and end on September 1st, 2005. Initial hydrodynamic conditions for both simulations were taken from HYCOM best estimate conditions for March 1st, 2005.
2.2. A. fundyense Population Dynamics Model
The A. fundyense sub-model is a single-component biological model containing parameterizations of A. fundyense germination, growth, swimming behavior, and mortality. Fundamental to A. fundyense modeling approach is the concept that the ecosystem in which A. fundyense resides is not explicitly modeled. This is justified on the basis that A. fundyense generally constitutes only a small fraction of the phytoplankton assemblage in the GOM (McGillicuddy et al., 2005). As such, although blooms of A. fundyense display considerable interannual variation in terms of their occurrence and magnitude, they are a minor component of GOM phytoplankton community and presumably have little effect on ambient conditions such as nutrient concentration (Love et al., 2005) and the abundance of predators.
The evolution of A. fundyense can be expressed as an advection-diffusion-reaction equation:
where C is the concentration of A. fundyense, and wa are the fluid velocity and A. fundyense upward swimming velocity; K is the diffusivity, μ and m are the cell growth and mortality terms respectively, and Fg is the germination flux from the sediment layer (cyst stage) to the water column (vegetative cell stage). Interested readers are referred to Stock et al. (2005) for detailed description of the model and parameterizations for μ, wa, m and Fg.
The A. fundyense sub-model used in this study includes one important improvement on the Stock et al. (2005) formulation. Rather than using a constant average rate of mortality, we allowed m to vary with ambient water temperature T based on the Q10 formulation (Valiela, 1984; Durbin and Durbin, 1992):
The underlying assumption is that activity of A. fundyense’s predators will increase with temperature (Figure 2), just as the growth rate of A. fundyense increases with temperature (albeit formulated in a different manner—see Stock et al. (2005)). This parameterization of temperature-dependent mortality was found to be more effective in capturing the late-season demise of the bloom, during which loss processes are apparently accelerated. However, this formulation still remains a vast simplification of the suite of loss processes including predation, cell mortality, and encystment. Improved representation of these effects is a topic of ongoing research.
Figure 2.
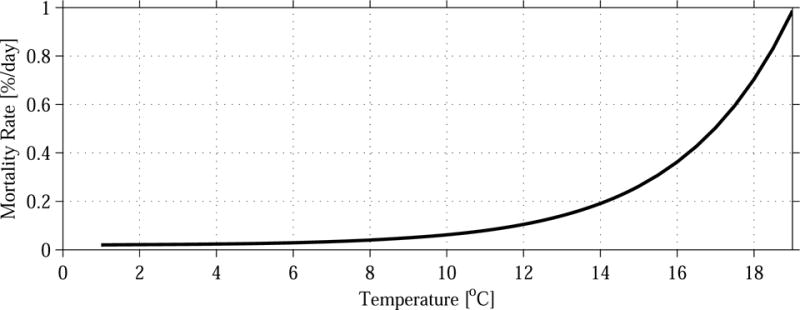
Improved mortality function used in the A. fundyense population dynamics model.
The initial A. fundyense concentration was set to zero everywhere. The distribution of benthic cysts was specified from sediment core surveys (Figure 3) conducted in late 2004 (central hindcast) and fall 1997 (sensitivity experiment). Because no information was available to specify cell concentration along model open boundaries, we applied no-gradient OBCs for A. fundyense at all three GOM ROMS boundaries throughout the simulation. Similarly, the numbers of in-situ nutrient observations in 2005 were insufficient to specify the time evolution of the 3-dimensional nutrient (dissolved inorganic nitrogen, or DIN) fields, so we used the nutrient climatology described by Petrie et al. (1999), linearly interpolated between quarterly fields (Feb 15, May 15, Aug 15 and Nov. 15) provided by that data base.
Figure 3.

Comparison of benthic cyst distribution and abundance between 2004 (upper panel) and 1997 (lower panel). The 2004 cyst abundance data was used to produce the central hindcast of 2005 A. f. bloom.
2.3. Forcing
Table 1 lists the forcing functions used in the model simulations. For both the shelf-scale ROMS and GOM ROMS hindcasts, surface atmospheric conditions from National Oceanic and Atmospheric Administration (NOAA)’s Air Quality Research Lab (ARL) EDAS archive (http://www.arl.noaa.gov/ss/transport/archives.html) were utilized. The spatial resolution of this archive is 40 km. Air-sea fluxes of heat and momentum were computed by applying the standard bulk formulae (Fairall et al. 2003) to EDAS marine boundary-layer winds, air temperature, relative humidity, air pressure, and ROMS generated sea surface temperature (SST) and surface current. In addition, the EDAS solar radiation field was also used in the A. fundyense growth model. Real-time river runoff time series from United State Geological Survey (USGS) were collected to specify freshwater input into the gulf. As tides are important circulation component in this coastal region, the 7 major tidal constitutes (M2, S2, N2, K2, K1, O1, Q1) were introduced by superimposing tidal harmonics on sub-tidal OBCs using the Flather (1976) boundary condition.
Table 1.
Surface and boundary forcing elements used in the coupled physical-biological model hindcast.
| – Major tide constituents: M2, S2, N2, K2, K1, O1, Q1 |
| – 6-hourly wind stress and heat fluxes computed with |
| – NOAA ARL EDAS archives. |
| – River runoff from USGS; |
| – OBCs from “parent” model |
3. Model Results: Central Hindcast Simulation
Standard circulation state variables (sea level, currents, temperature, and salinity) and A. fundyense cell concentration were archived at 6-hr intervals. Interested readers are referred to an online animation showing the spatial and temporal evolution of modeled sea level, surface current, surface temperature and salinity fields, and surface A. fundyense cell concentration (http://science.whoi.edu/users/ruoying/Redtide_05/Papers/avg_fields.avi). Both simulated physical and biological fields display extremely complex spatial and temporal variability, highlighting the synergy between a numerical model and observations in the study of coastal ocean processes.
Because the transport of material properties in the coastal region is largely determined by sub-tidal circulation, the fidelity of our hindcast model in reproducing sub-tidal variability is examined here1. Sea level comparisons (Figure 4) were made at 6 coastal sea level gauges, where both modeled and observed sea levels were 36-hr low-pass filtered to remove tidal variability. It was found that the model is able to resolve sub-tidal sea level variations reasonably well, with correlation coefficients above 0.92 at all 6 stations. The model generally underestimates the magnitude of observed sea level variability, probably due to insufficiency of surface wind forcing, which is on a relatively coarse 40 km grid.
Figure 4.

Comparisons of observed (gray) and modeled (thick) subtidal sea levels at 6 coastal gauges in the GOM.
Model-data comparisons were also made at where Gulf of Maine Ocean Observing System (GoMOOS) mooring data were available. For instance, at GoMOOS buoy B (50-m isobath), the circulation model is able to reproduce the coastal current and transport reasonably well (Figure 5). In particular, three strong southward transport events (two in May and one in June) due to the respective northeaster storms are all captured by the model. The model tracks observed temperature and shows the same seasonal warming trend. Note that the thickness of the observed thermocline in Figure 5 is determined by the coarse vertical spacing of the temperature sensors on the mooring, so it is not possible to evaluate the thermocline structure produced by the model. The simulated and observed salinity perturbations are also similar, testifying the model is capable of resolving significant influence from river runoff. One deficiency of the model solution is a ca. 1 psu offset between the simulated and observed salinity fields. We found the origin of this offset lies in the model’s initial and boundary conditions. Because NA-HYCOM does not account for coastal freshwater input well, the initial salinity field taken from the HYCOM “best estimation” on March 1, 2005 is biased. It is our understanding that HYCOM group is working to correct this salinity bias and will release a new set of reanalysis product in the near future (Chassignet, personal communication). The new HYCOM field should allow us to improve GOM salinity simulation. An alternative means for improvement is to correct such biased initial fields via assimilating in-situ temperature/salinity observations. We will report this effort in a future communication. Nevertheless, these model-data comparisons suggest the circulation model is in general capable of reproducing observed circulation patterns, lending confidence that the biological model is couched in a realistic physical environment.
Figure 5.
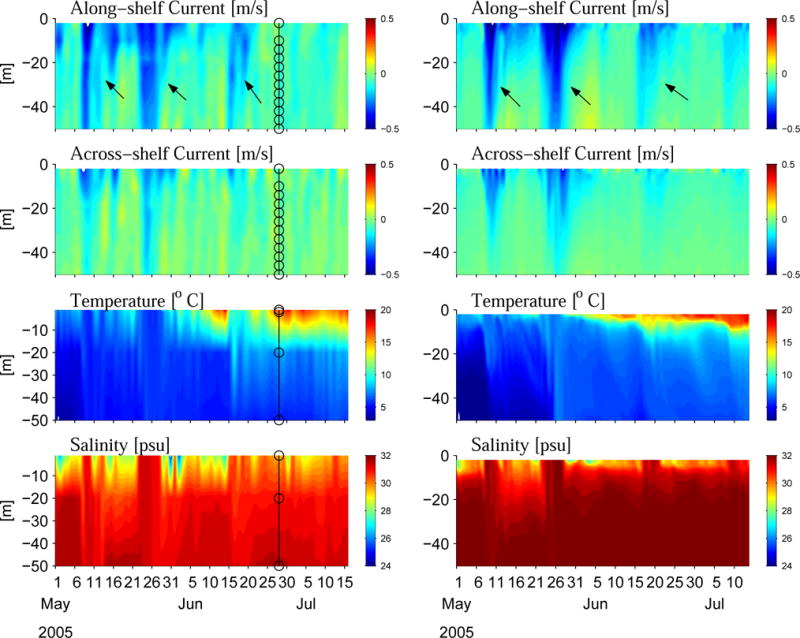
Comparison of observed (left) and simulated (right) time series at GoMOOS mooring B. For both panels, from top to bottom are depths profiles of across-shelf current, along-shelf current, temperature and salinity. Circles in the left hand panels indicate locations of current and temperature/conductivity sensors on mooring B. Three major transport events in May and June are indicated by arrows in both observed and simulated Along-shelf current fields.
To validate the A. fundyense population dynamics model, direct comparisons were made between simulated and observed surface cell concentrations (Figure 6). In situ cell observations were collected during several gulf-wide and sub-regional-scale ship surveys from May through June, 2005 (Anderson et al., 2005). To quantify model-data comparisons, we interpolated simulated cell concentration at each station where in-situ cell counts were made, and computed a point-by-point model-data misfit for each pair of comparisons.
Figure 6.
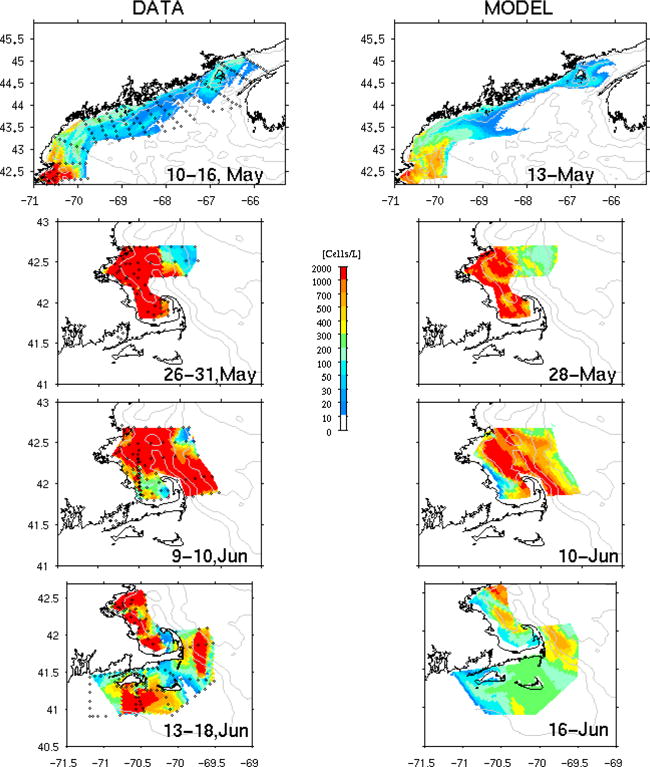
Comparison of observed (left panels) and simulated (middle right) surface A. fundyense cell concentration. In-situ cell counts were collected by in-situ ship surveys in May, June 2005.
Temporal and spatial evolutions of modeled bloom conditions on March 15th, April 15th, May 15th, and June 15th. In each panel, both surface and vertical cell distributions are shown. Note for clear visualization, cell concentration is converted in log10 scale.
Early in the season (May 10–16), observations show a high abundance of cells in the western GOM, with highest concentrations south and east of Cape Ann. A patch of high cell concentration was also present in the offshore water southeast of Casco Bay. In the eastern GOM, cell concentration around the Grand Manan Island was also significant (ca. 200–300 cells per liter). However, there were few/no cells in the coastal region southwest of Nova Scotia, indicating the A. fundyense population did not have an upstream source from Scotia shelf water during this bloom event. The simulated cell concentration (sampled on May 13) displays similar large-scale spatial distribution. The misfit caculation indicates simulated and observed cell abundances are also consistent within ±50 cells/L at 70% of the 133 stations. Some discrepancies are seen, including the model overestimation or underestimation in various regions in the GOM. But given the environmental uncertainties and the temporal aliasing of observations, we may conclude that the A. fundyense population dynamics model works reasonably well during this initial phase of the bloom.
Subsequent sub-regional observations show abundant cell populations were inside Massachusetts and Cape Cod Bays by May 28. Relatively few cells were present in the easternmost stations offshore of Cape Ann. The simulated bloom reproduces the same spatial pattern with consistent cell concentration at more than 50% of the stations. The model tends to overestimate offshore and underestimate in the Bays. Two weeks later (June 10), observations indicate a similar pattern in Massachusetts Bay, and expansion of the bloom in the offshore region. Additional transects east of Cape Cod documented the presence of the bloom in that area as well. The model captures this overall spatial distribution, although it underestimates the concentration at most of stations. By June 17, observations adjacent to Cape Cod show two large patches of high concentration were present, one to the east of Cape Cod, and the other to the south of Martha’s Vineyard and Nantucket Islands. Coincidently, the model indicated elevated cell concentrations in the same two areas, although the absolute cell abundance was significantly underestimated. Recall these areas are in the vicinity of GOM ROMS open boundaries (Figure 1), so the treatment of A. fundyense open boundary conditions (section 2.2) may contribute to the model underestimation. In summary, all of these direct model-data comparisons demonstrate our bloom hindcast is able to track the temporal evolution and large-scale spatial structures of 2005 A. fundyense bloom during its initial and development phase. The model generally underestimates the bloom intensity, and like any regional models, solutions near model boundaries are subject to insufficiency of OBCs specifications, which can lead to large discrepancies with observations2.
With the space-time continuous model realizations, we now depict the evolution and three-dimensional spatial structure of the 2005 bloom (Figure 7). On March 15, A. fundyense was present in very low concentrations (< 50 cells/L). These cells were largely confined in the coastal region between Casco Bay and Penobscot Bay, as well as in the Bay of Fundy, near to the areas of highest cyst abundance (see Fig 3 upper panel). As the germination input increases and vegetative growth proceeds, cell concentration increased 25-fold a month later (by April 15). The largest concentrations were south of Penobscot Bay, with a significant number of cells having entered Massachusetts Bay. Vertical sections reveal that upward swimming cells recently germinated from the cyst bed off the western GOM coast were fueling the surface bloom further downstream. Vegetative cells were concentrated in the upper water column, where light is abundant and temperature is warmer. By May 15th, even more cells were present with maximum cell concentrations close to 3000 cells/L. By this time, the bloom had covered Massachusetts and Cape Cod Bays, and extended to the offshore water to the south and east, the Cape Cod, Martha’s Vineyard, and Nantucket. With the connection of the southward moving Maine Coastal Current (Lynch et al, 1994.), much of the New England coast (with the exception of Rhode Island and Connecticut) was exposed to the massive bloom. By June 15th, the bloom had expanded further, although the maximum cell concentration had begun to decrease. The transport by regional coastal circulation advected cells along the periphery of Georges Bank. While the A. fundyense bloom in the western GOM had begun to decay, the bloom in the eastern GOM and the Bay of Fundy had started intensifying. This seasonal shift of the bloom or the pattern of PSP from west to east through time is consistent with previous observations (Anderson, 1997; Townsend et al, 2001) and model simulations (McGillicuddy et al., 2005). A few weeks later, cell concentration started decaying gulf-wide, and by July 30th (not shown), A. fundyense cells were essentially gone from the nearshore coastal waters, signaling the end of the bloom season.
Figure 7.

Temporal and 3-dimentional spatial evolutions of simulated bloom conditions on March 15th, April 15th, May 15th, and June 15th. In each panel, surface cell concentration map is shown on top of 7 GOM sections showing vertical cell distributions. Note for better visualization, both surface and vertical cell concentrations are scaled by in log10.
4. Model Results: Sensitivity Experiments
Given that the coupled model can produce a generally credible hindcast of the 2005 bloom, it can be used as a basis to investigate the relative importance of the three causative factors suggested by Anderson et al. (2005). A set of model sensitivity experiments (Table 2) were executed to examine these hypotheses. In each case, one aspect of the model was changed and the results were compared with the central hindcast, relative to observations. The nature of the differences provides a means to assess the relative importance of each potential controlling parameter.
Table 2.
Summary of model sensitivity experiments.
| Run ID | Cyst Map | Wind Forcing | River Discharge |
|---|---|---|---|
| Central Hindcast | 2004 | 2005 | 2005 |
| Sensitivity 1: Source | 1997 | 2005 | 2005 |
| Sensitivity 2: Wind | 2004 | 2004 | 2005 |
| Sensitivity 3: Rivers | 2004 | 2005 | 2004 |
| Sensitivity 4: Source | 2004 BOF | 2005 | 2005 |
4.1. Twin experiment 1: Initial cyst abundance
To test whether initial cyst abundance was important for the 2005 bloom, a twin model experiment (with respect to the central hindcast presented above) was performed in which we utilized cyst observations collected by a gulf-wide survey in fall 19973 instead of the fall 2004 cyst survey. Differences between cyst distributions in these 2 years are dramatic (Figure 3): relative to 1997, cyst abundance in 2004 increased by a factor of 2.4 in the Bay of Fundy, and by a factor of nearly 9 in the western GOM. Unfortunately, no cyst observations are available between 1997 and 2004 to elucidate the reasons for such a dramatic change4.
Using the 1997 cyst data, the hindcast model shows simulated cell concentrations are at least 4-fold smaller than the observation and the central hindcast (cf. Figure 8, left column; Figure 6). Differences in bloom’s spatial distribution are also apparent. On May 13th, the offshore (southeast to the Casco Bay) patch of high density cells is absent in the simulation using the 1997 cyst map as the inoculum. Although this model run shows bloom development in Massachusetts Bay by May 28, both the spatial extent and intensity of the bloom are much too small compared to observations. Likewise, very few cells are present south and east of Cape Cod on June 10 and 17, respectively in the simulation using 1997 cysts. All of these contrasting features (with respect to data and central hindcast) suggest high cyst abundance as a primary factor in the 2005 bloom.
Figure 8.

Simulated surface cell concentrations from three sensitivity model experiments. Modeled blooms are sampled on the same observation grid as shown in Figure 6. Left columns show the results from twin experiment 1 that using 1997 benthic cyst distribution; Middle columns show the results from twin experiment 2 that using 2004 surface wind forcing; right columns show the results from twin experiment 3 that using 2004 river runoff data.
4.2. Twin experiment 2: Surface wind
He et al. (part 1, submitted) showed that spring-summer surface wind conditions in 2005 were characterized by anomalous northeasterlies relative to the southwesterly climatological winds. In order to examine if winds played a role in the massive 2005 bloom, a second twin model experiment was performed in which we replaced 2005 surface wind forcing with NOAA EDAS 2004 surface wind forcing. This choice of wind forcing is justified on the basis that the mean wind in May 2004 was nearly identical to climatology (He et al., Part 1 submitted).
Model solutions indicate that a massive regional bloom would have still occurred, although the upwelling favorable winds in 2004 would have pushed the bloom offshore and retarded its southward transport (cf. Figure 8, middle column; Figure 6). In another words, had the wind conditions in 2005 been more typical, i.e., southwesterly, a less-severe bloom would have resulted for nearshore regions, especially in Massachusetts and Cape Cod Bays (see for example the bloom distribution on May 28). There would still have been a substantial A. fundyense population in offshore waters, however. This sensitivity experiment revealed that the episodic northeasterly winds and downwelling-favorable mean wind condition in 2005 led to stronger than normal onshore advection, which in turn significantly enhanced bloom intensity along the coast. Thus, winds in 2005 played an important role in modulating the development and distribution of the regional bloom.
4.3. Twin experiment 3: River runoff
River runoff into the Gulf was anomalously high in 2005 (Anderson et al., 2005; He et al., Part 1, submitted). In order to examine the impact of this river runoff anomaly on the bloom distribution, we conducted a third sensitivity experiment in which the 2005 river discharge data used in the central hindcast was replaced by the river data from 2004. Our examination on the long-term USGS river discharge record shows that the runoff in 2004 was very similar to the long-term mean, with a total spring-summer discharge volume about 50% of that in 2005.
Comparisons with the central hindcast indicate that this sensitivity run produced very subtle differences in the spatial distribution and cell concentrations of the bloom (cf. Figure 8, right column; Figure 6). Further examination of the simulated salinity field and A. fundyense concentrations reveals that the downwelling-favorable winds in 2005 induced strong on-shore transport that confined the river plumes to the nearshore region. While enhanced local buoyancy due to larger river runoff accelerated the near-coastal flow and along-coast transport, the riverine influence on the large-scale bloom distribution was rather limited.
An important caveat is that both the central hindcast and this river sensitivity experiment utilize the same climatological nutrient field. Therefore possible enhancement of nutrient delivery by river discharge was not addressed by these simulations. Anderson et al. (2005) suggested fresh water runoff could provide both macro- and micro-nutrients, including essential trace metals and organic materials that are known to be important growth factors for A. fundyense and other dinoflagellates (Prakash and Rashid, 1968; Gagnon et al., 2005). We are unable to explore such effects suing our model due to the lack of river nutrient data.
4.4. Twin Experiment 4: Relative importance of Cyst Beds- Bay of Fundy versus western GOM
As we show in the pervious section, cysts in both BOF and western GOM were more abundant in fall 2004 than in prior years (Figure 3). Townsend et al. (2001) suggest that A. fundyense in the EMCC can be transported into the western GOM, and therefore A. fundyense populations originating in the Bay of Fundy could influence the entire GOM. Along the same line, Keafer et al. (2005) identified a nearshore pathway (the Gulf of Maine Coastal Plume or GOMCP) for transport of cells from east to west. It is therefore of interest to differentiate the relative importance of the two main cyst beds in the cell abundance and distribution during the 2005 bloom. For this purpose, we carried out another sensitivity experiment in which an artificially constructed cyst map is used in the hindcast (Figure 9). Specifically, this cyst field has the same cyst distribution and abundance in the BOF as in the 2004 cyst map (Figure 3), but everywhere else in the GOM, the cyst abundance was set to zero. In effect, this simulation tests whether the cysts in the BOF are sufficient to cause the 2005 bloom without any further input of cells from “downstream” cyst beds near Penobscot and Casco Bays.
Figure 9.

Artificial benthic cyst abundance data used in sensitivity experiment 4.
Difference between this sensitivity experiment and central hindcast is highlighted by comparing May monthly-mean bloom conditions (Figure 10). Relative to the central hindcast, the bloom produced by this experiment is much weaker. The maximum monthly-mean cell concentration is an order of magnitude smaller than that produced by the central hindcast. Differences are also evident in the timing of the bloom. With the model animation, we tracked newly geminated BOF cells that are entrained and transported by the Maine coastal currents. We found it is not until the end of May that they finally reach Massachusetts Bay (not shown). In 2005, the bloom had already fully developed and reached its peak by that time. This time lag also highlights the importance of the western GOM cyst bed in the massive bloom in 2005. Results here also support conceptual models presented in Anderson et al. (2005c) and McGillicuddy et al. (2005). The cells originating from the WGOM seedbed have a critical augmenting effect on cell populations being transported from east to west in the coastal current system.
Figure 10.

Comparison of May monthly-mean cell concentration produced by central hindcast (upper panel), and twin experiment 4(lower panel) that utilized artificial cyst abundance data (Figure 9).
5. Conclusions
Our central model hindcast successfully reproduced the large-scale spatial distributions of A. fundyense populations in 2005. Point-by-point comparisons indicate that during the initial phase of the bloom, simulated cell abundances agree with in-situ data within ±50 cells/L at 90 out of 133 hydrographic stations. Comparisons with cell count data collected later in the season in the vicinity of Massachusetts and Cape Cod Bays as well as south and east of Cape Cod show the model still tracks spatial distribution of the bloom, albeit with a consistent underestimation of cell abundance. One possible reason for this discrepancy is related to the mortality formulation in the moel. Although the temperature-dependent mortality used herein was effective in capturing the demise of the bloom later in the season, it may be not optimal during the middle of the season. Further refinement of the mortality representation is a topic of ongoing research. Another possible explanation may be related to the nutrient field being used. Because the climatological nutrient database (Petrie et al. 1999) was used in all of our model simulations, possible enhancement of macro- and micro-nutrients, including essential trace metals and organic materials important to A. fundyense growth, were not included.
Model sensitivity experiments provide a means to distinguish the relative importance of three major factors contributing to the bloom. We found that the newly deposited cysts in western GOM were the primary factor for the outbreak. Surface wind forcing in 2005 was an important regulator, in the form of both episodic bursts of northeasterly winds and downwelling favorable mean conditions, causing strong onshore advection of offshore populations. The downwelling favorable winds also helped to accelerate the alongshore currents, transporting the cell population to the south and west more quickly, thereby affecting the timing of the bloom and the areas that were impacted. Even with the “typical” winds in 2004, a bloom would have occurred on a regional scale given the large number of cells provided as an inoculum from the abundant cysts. That bloom night not have had the same impact however, since delivery to shore is responsible for many of the most significant societal impacts (e.g., nearshore shellfish harvesting closures). Model experiments also showed that high river runoff in 2005 produced more intense buoyant plumes that further enhanced along-coast transport of cells. However, these buoyant river plumes were confined near the coast by strong wind-induced onshore transport, and thus had limited impact on gulf-wide A. fundyense cell distribution.
Collectively, our model results suggest that cyst abundance is the most important factor controlling the magnitude of the bloom. Thus, monitoring of benthic cyst distributions could provide a basis for interannual predictions in overall bloom severity. Apparently, other biological factors (germination, growth, mortality) as well as hydrodynamic transport play a major role in shaping the spatial and temporal structure of the bloom, as well as the intense patchiness characteristic of A. fundyense distributions. Deterministic predictions of those aspects will clearly require advanced observational infrastructure together with sophisticated techniques for data assimilation.
Acknowledgments
The authors thank Drs. C. Stock, J. Warner, and R. Signell for many helpful discussions on the implementation of this coupled modeling system. Drs. A. Cambell, E. Durbin, G. Teegarden, and J. Turner provided valuable insights leading to the improved representation of mortality in the A. fundyense model. S. Libby, M. Mickelson, and others associated with the Massachusetts Water Resources Authority monitoring program for Massachusetts Bay provided many valuable observations and helpful discussions. We thank Dr. B. Petrie for providing the Gulf of Maine nutrient climatology used in the simulations. Thanks also to NOAA NOS, NOAA NCEP, USGS, and GoMOOS for providing data product online. Research support was provided through the Woods Hole Center for Oceans and Human Health, National Science Foundation (NSF) Grant OCE-0430723 and National Institute of Environmental Health Science (NIEHS) Grant 1-P50-ES012742-01, ECOHAB program through NSF Grant OCE-9808173 and NOAA Grant NA96OP0099, and GOMTOX program through NOAA Grant NA06NOS4780245.
Footnotes
Note that the modeled tidal characteristics are satisfactory, but will not be shown here for brevity.
The statement here applies to biology sub-model, and simulated A. fundyense field only. Modeled hydrodynamic fields near GOM ROMS open boundary are in fact satisfactory because the shelf-scale ROMS provided dynamically consistent and numerically accurate boundary information for GOM circulation hindcast.
Note that the BOF cyst observations in the map labeled 1997 come from surveys of the Bay of Fundy in 1981 (White and Lewis, 1982), 1982 and 1983 (data provided by Jennifer Martin, DFO).
Anderson et al. (2005) suggest the increase of cyst abundance in the western GOM may have resulted from a large fall bloom of A. fundyense in 2004.
References
- Anderson DM. Bloom dynamics of toxic Alexandrium species in the northeastern US. Limnology and Oceanography. 1997;42:1009–1022. [Google Scholar]
- Anderson DM. Physiology and bloom dynamics of toxic Alexandrium species, with emphasis on life cycle transitions. In: Anderson DM, Cembella AD, Hallegraeff GM, editors. Physiological Ecology of Harmful Algal Blooms. Springer-Verlag; Berlin: 1998. pp. 29–48. (NATO ASI series). [Google Scholar]
- Anderson DM, Keafer BA, McGillicuddy DJ, Mickelson MJ, Keay KE, Libby PS, Manning JP, Mayo CA, Whittaker DK, Hickey JM, He R, Lynch DR, Smith KW. Initial observation of the 2005 Alexandrium fundyense bloom in southern New England: General patterns and mechanism. Deep-Sea Research II. 2005;52:2856–2876. [Google Scholar]
- Dinniman MS, Klinck JM, Smith JWO. Cross shelf exchange in a model of the Ross Sea circulation and biogeochemistry. Deep Sea Research. 2003;50:3103–3120. [Google Scholar]
- Durbin EG, Durbin AG. Effects of temperature and food abundance on grazing and short-term weight change in the marine copepod Acartia hudsonica. Limnology and Oceanography. 1992;37(2):361–378. [Google Scholar]
- Fairall CW, Bradley EF, Hare JE, Grachev AA, Edson J. Bulk Parameterization of Air–Sea Fluxes: Updates and Verification for the COARE Algorithm. Journal of Climate. 2003;16:571–591. [Google Scholar]
- Flather RA. A tidal model of the northwest European continental shelf. Mem Soc Roy Sci Liege, Ser. 1976;6(10):141–164. [Google Scholar]
- He R, McGillicuddy DJ. Gulf of Maine Harmful Algal Bloom in summer 2005-Part 1: In Situ Observations of Coastal Hydrography and Circulation. Journal of Geophysical Research. doi: 10.1029/2007JC004601. submitted to. [DOI] [PMC free article] [PubMed] [Google Scholar]
- Luettich RA, Westerink JJ, Scheffner NW. ADCIRC: An advanced three-dimensional circulation model for shelves, coasts, and estuaries. U.S. Army Engineer Waterways Experiment Station; 1992. [Google Scholar]
- Lutjeharms JRE, Penven P, Roy C. Modelling the shear edge eddies of the southern Agulhas Current. Continental Shelf Research. 2003;23:1099–1115. [Google Scholar]
- MacCready P, Geyer WR. Estuarine salt flux through an isohaline surface. Journal of Geophysical Research. 2001;106:11,629–11,637. [Google Scholar]
- Marchesiello P, McWilliams JC, Shchepetkin AF. Open boundary conditions for long-term integration of regional oceanic models. Ocean Modelling. 2001;3:1–20. [Google Scholar]
- McGillicuddy DJ, Anderson DM, Lynch DR, Townsend DW. Mechanisms regulating large-scale seasonal fluctuations in Alexandrium fundyense populations in the Gulf of Maine: Results from a physical-biological model. Deep-Sea Research II. 2005;52:2698–2714. [Google Scholar]
- Peliz Á, Dubert J, Haidvogel DB, Le Cann B. Generation and unstable evolution of a density-driven eastern poleward current: The Iberian Poleward Current. Journal of Geophysical Research. 2003;108:3268. [Google Scholar]
- Petrie B, Yeats P, Strain P. Nitrate, Silicate and Phosphate Atlas for the Scotian Shelf and the Gulf of Maine. Canadian Technical Report of Hydrography, Ocean Sciences. 1999;203:vii + 96. [Google Scholar]
- Shchepetkin AF, McWilliams JC. Quasi-monotone advection schemes based on explicit locally adaptive diffusion. Monthly Weather Review. 1998;126:1541–1580. [Google Scholar]
- Shchepetkin AF, McWilliams JC. A Method for Computing Horizontal Pressure-Gradient Force in an Oceanic Model with a Non-Aligned Vertical Coordinate. Journal of Geophysical Research. 2003;108:3090. doi: 10.1029/2001JC001047. [DOI] [Google Scholar]
- Shchepetkin AF, McWilliams JC. The regional oceanic modeling system (ROMS): a split-explicit, free-surface, topography-following-coordinate oceanic model. Ocean Modelling. 2005;9:347–404. [Google Scholar]
- Stock CA, McGillicuddy DJ, Solow AR, Anderson DA. Evaluating hypotheses for the initiation and development of Alexandrium fundyense blooms in the western Gulf of Maine using a coupled physical-biological model. Deep Sea Research II. 2005;52:2715–2744. [Google Scholar]
- Stock CA, McGillicuddy DJ, Anderson DA, Solow AR, Signell PS. Blooms of the toxic dinoflagellate Alexandrium fundyense in the western Gulf of Maine in 1993 and 1994: A comparative modeling study. Continental Shelf Research. 2007 doi: 10.1016/j.csr.2007.06.008. [DOI] [Google Scholar]
- Townsend DW, Pettigrew NR, Thomas AC. Offshore blooms of the red tide dinoflagellate, Alexandrium sp., in the Gulf of Maine. Continental Shelf Research. 2001;21:347–369. [Google Scholar]
- White AW, Lewis CM. Resting cysts of the toxic red tide dinoflagellate Gonyaulax excavate in Bay of Fundy sediments. Canadian Journal of Fisheries and Aquatic Sciences. 1982;39:1185–1194. [Google Scholar]