

Abstract
A persistent gyre at the mouth of the Bay of Fundy results from a combination of tidal rectification and buoyancy forcing (Aretxabaleta et al., J. Geophys. Res., vol. 113, 2008). Here we assess interannual variability in the strength of the gyre using data assimilative model simulations. Realistic hindcast representations of the Gyre are considered over the course of cruise surveys in 2005, 2006 and 2007. Assimilation of shipboard and moored ADCP velocities are used to improve the skill of the simulations, as quantified by comparison with non-assimilated drifter trajectories. Our hindcast suggest a weakening of the Gyre system during May 2005. Retention of simulated passive particles in the Gyre during that period was highly reduced. A recovery of the dense water pool in the deep part of the basin by June 2006 resulted in a return to particle retention characteristics similar to climatology. Retention estimates reached a maximum during May 2007 (sub-surface) and June–July 2007 (near-surface). Interannual variability in the strength of the gyre was primarily modulated by the stratification of the dense water pool inside the Grand Manan Basin. These changes in stratification may be attributed to mixing conditions the preceding fall/winter and/or advectively-driven modification of water mass properties.
1. Introduction and Background
The presence of counter-clockwise flow in the lower Bay of Fundy had been inferred from several past observations: dynamic height calculated from hydrography [Watson, 1936], drift bottles [Fish and Johnson, 1937; Hachey and Bailey, 1952; Lauzier, 1967], and current meters [Godin, 1968]. Historically, the circulation of the Bay of Fundy has been described as predominantly tidally-driven. While studies of the barotropic residual circulation, dominated by tidal rectification with flow into the Bay of Fundy along the southeastern side and flow out of the Bay along the northwestern side, are common [Bigelow, 1927; Godin, 1968; Greenberg, 1983], the baroclinic circulation has received less attention. Garrett et al. [1978] explained the balance between tidally-driven mixing and stratification due to surface heating in the region, while Brooks [1994] characterized freshwater inflow influences in the Bay.
In a recent companion study [Aretxabaleta et al., 2008], we presented a climatological description of a persistent cyclonic Gyre in the lower Bay of Fundy (Figure 1). The main result of that study was that both tidal rectification and density-driven circulation control the flow around the Gyre. Residence times longer than 30 days were predicted for particles released in the proximity of the Gyre during the stratified season. The tidally rectified flow is enhanced by the presence of a dense water pool in the deeper area of the basin in the mouth of the Bay. The circulation associated with such dense water pools in the coastal ocean has been described in several studies [Garrett, 1991; Hill, 1996, 1998] and intensely investigated in the Irish Sea [Hill et al., 1994; Horsburgh et al., 2000].
Figure 1.
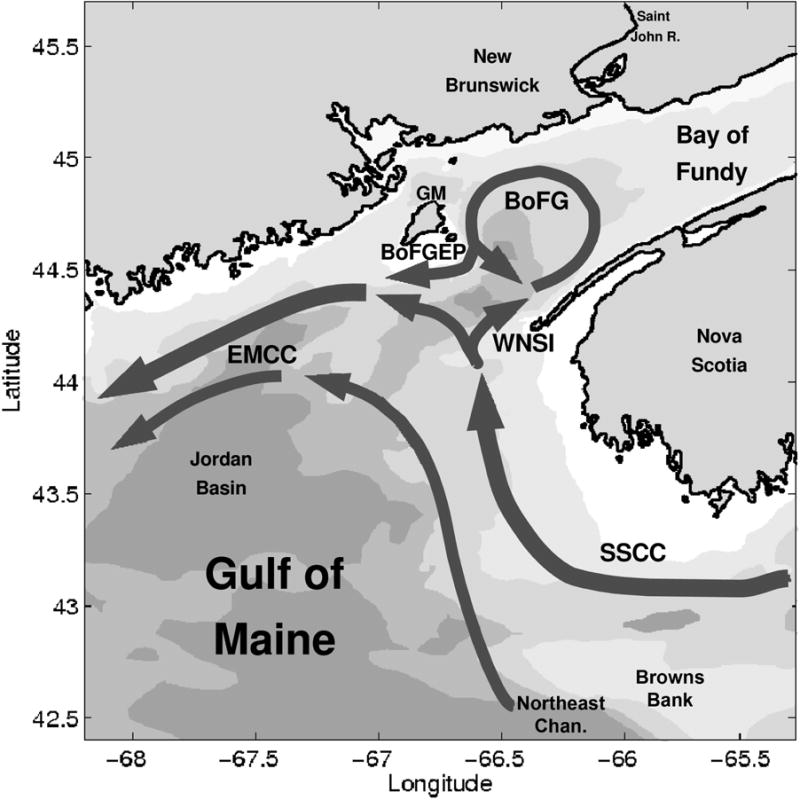
Eastern Gulf of Maine and Bay of Fundy depth-averaged circulation. The major currents in the Eastern Gulf are the Scotian Shelf Coastal Current (SSCC) and the eastern segment of the Maine Coastal Current (EMCC). The Western Nova Scotian Inflow (WNSI) represents the main current into the Bay of Fundy, feeding into the Bay of Fundy Gyre (BoFG), while the Bay of Fundy Gyre Exit Pathway (BoFGEP) represents the main outflow from the Bay. (GM - Grand Manan Island).
Another factor influencing the Bay of Fundy Gyre is the interaction with the surrounding circulation in the adjacent Gulf of Maine (Figure 1). The circulation in the Gulf is determined by the evolution of its density field, stratification, winds, and tides [Bigelow, 1927; Brooks, 1985; Brooks and Townsend, 1989]. The main water sources in the northern Gulf are: 1) The northwestward flow through the Northeast Channel [Ramp et al., 1985; Loder et al., 2001]; 2) the Scotian Shelf Coastal Current (SSCC) flowing between Nova Scotia and Browns Bank [Smith, 1983, 1989a; Brooks and Townsend, 1989]; and 3) the seasonally important river discharge, predominantly from the St. John River [Brooks, 1994; Bisagni et al., 1996]. Scotian Shelf water (SSW) enters the Gulf of Maine around Cape Sable [Smith, 1983; Shore et al., 2000; Pettigrew et al., 2005] and flows north to the mouth of the Bay of Fundy. There, the SSCC undergoes a bifurcation [Xue et al., 2000; Pettigrew et al., 2005] into a branch that continues west to form the eastern segment of the Maine Coastal Current (EMCC, Lynch et al. [1997], Pettigrew et al. [1998]), and a branch that veers northeast to form the Western Nova Scotian Inflow (WNSI) into the Bay of Fundy. The WNSI represents the main inflow into the Bay joining the eastern branch of the Gyre. An additional source of water into the Bay, especially during the spring freshet, is the river runoff from the St. John River [Brooks, 1994; Bisagni et al., 1996; Pettigrew et al., 1998]. Its southward flowing discharge passes mostly west of Grand Manan Island [Brooks, 1994; Lynch et al., 1997] but a portion travels east of the island following the western branch of the Gyre. The Bay of Fundy Gyre Exit Pathway (BoFEP) constitutes the main outflow from the Bay passing east of Grand Manan Island, then turning south to join the EMCC.
The biological implications of the presence of the Gyre have been extensively described to explain retention of several organisms [Fish and Johnson, 1937; Dickie, 1955; Campbell, 1985]. Blooms of the toxic dinoflagellate Alexandrium fundyense in the area have been described since 1935 [Martin and White, 1988; Martin et al., 2008]. The self-sustainability of the Bay of Fundy population of this dinoflagellate is favored by the retentiveness of the Gyre. It has been suggested that the cyst bed located in the Bay [White and Lewis, 1982] could act as a long-term source for the entire Gulf of Maine [Anderson et al., 2005b; McGillicuddy et al., 2005].
The current study presents a description of the recent variability of the circulation associated with the Bay of Fundy gyre and its effects on retention. This work uses hindcast model simulations focusing on the circulation near the mouth of the Bay of Fundy (Figure 2). The recent interannual variability is described by comparing the model results and drifter trajectories for 2005, 2006, and 2007. The intra-annual variability during the stratified season is explored by comparing the circulation during two different periods in 2007.
Figure 2.
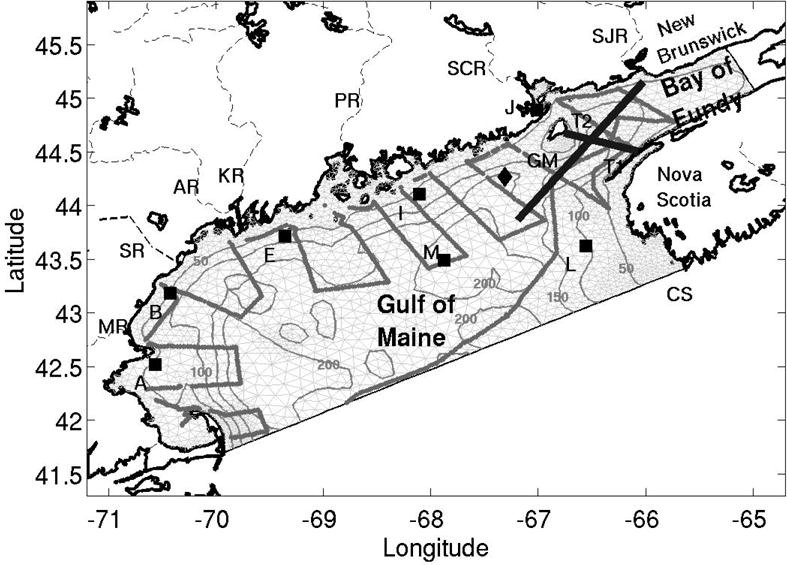
Map of the study region showing the model domain of the Gulf of Maine and Bay of Fundy. The thick black lines indicate the position of two transects through the mouth of the Bay (T1, across-Bay; and T2, along-Bay). The gray line represents the ship-track of the cruise conducted during May 2007. The black diamond indicates the location of the NDBC station 44027. The black squares represent the locations of seven GoMOOS buoys: A, B, E, I, J, L, and M. GM stands for Grand Manan Island and CS for Cape Sable. The seven main rivers in the model domain are indicated with thin dashed lines: Merrimack (MR), Saco (SR), Kennebec (KR), Androscoggin (AR), Penobscot (PR), St. Croix (SCR), and St. John (SJR). The bottom topography contours of 50, 100, 150, and 200 meters are included.
2. Data and Methods
2.1. Observations
The observations used for assimilation, comparison, and validation of the hindcast model results were obtained from hydrographic cruises during late-spring and early summer: R/V Oceanus 412 (May 9–18, 2005), R/V Oceanus 425 (June 6–17, 2006), R/V Endeavor 435 (May 17–June 1, 2007), and R/V Endeavor 437 (June 21–July 6, 2007). The purpose of the cruises was to conduct synoptic mapping of A. fundyense, hydrography, and velocity in the coastal ocean from Massachusetts Bay to the mouth of the Bay of Fundy (example ship-track in Figure 2). During each cruise, several drifters (9 per cruise) were released along a transect across the Bay of Fundy. Shipboard ADCP current measurements, along with currents from several fixed moorings of the Gulf of Maine Ocean Observing System (GoMOOS, http://www.gomoos.org/, Figure 2), were used for assimilation purposes, while the drifters were used only for validation. Temperature and salinity from both National Data Buoy Center (NDBC) and GoMOOS buoys was used for additional validation.
2.2. Model
The data assimilative model structure, developed by the Dartmouth Numerical Methods Laboratory, followed the schematic flowchart in Lynch et al. [2001] as revised and completed by Lynch and Naimie [2002]. It has been successfully used for several studies of the Gulf of Maine [Lynch and Naimie, 2002; Aretxabaleta et al., 2005; He et al., 2005]. The forward model was Quoddy [Lynch and Werner, 1991; Lynch et al., 1996], a 3-D, prognostic, tide-resolving, finite element model with turbulence closure from Mellor and Yamada [1982]. The model domain was a triangular finite element mesh, covering the Gulf of Maine and Bay of Fundy (Aretxabaleta et al. [2008] and Figure 2). The horizontal grid spacing ranged from 1–3 km in regions of steep topography to around 8 km in the deep basin of the Gulf of Maine. A first estimate of the circulation (prior) was computed using best prior estimates of the initial hydrography and boundary conditions (explained in Section 2.3).
The data assimilation procedure reduced the misfit between modeled and observed velocities and improved the predictive skill of the simulations. Two different inverse models were used: 1) The frequency-domain model Truxton [Lynch et al., 1998] to improve the model estimate of several tidal constituents (M2, S2, N2, O1, and K1); and 2) the time-domain Casco model [Lynch and Hannah, 2001] to provide sub-tidal adjustments. Both inverse models provided a set of adjustments to the barotropic elevation boundary condition. The boundary condition adjustments were controlled by regularization terms to ensure physically sensible solutions [Lynch and Naimie, 2002], penalizing amplitude, slope, and temporal gradients. A new forward simulation was computed using the adjusted boundary conditions and the process was repeated iteratively until the misfit was within observational error. The last forward simulation after assimilation (posterior) was considered the best estimate of the circulation.
2.3. Inputs
Initial conditions were produced by updating the Gulf of Maine digital temperature and salinity climatology [Lynch et al., 1996] with the observed CTD measurements (~200 stations per cruise) using an objective interpolation method. The three dimensional objective interpolation was conducted following the iterative method described in Aretxabaleta et al. [in prep.]. This method represents an extension of the basic objective interpolation software by Smith [2004] that has been successfully used in previous studies of the Gulf of Maine [He et al., 2005]. Temperature and salinity differences between observations and the first forward model simulation (prior) at the time of the observations were computed. These hydrographic anomalies were then objectively analyzed and then added to the original fields. The model was then reinitialized with the updated objectively analyzed hydrography and the process was repeated iteratively to achieve non-linear convergence. The last forward simulation (posterior), therefore used our best estimate of both the initial conditions (hydrography) and boundary conditions (barotropic elevation). The benefit of the iterative method was that it avoided aliasing and averaging issues in areas of strong currents (such as the Bay of Fundy) or with strong gradients (frontal regions). Thus, the updated fields were a quasi-synoptic representation of the hydrography of the Gulf of Maine and Bay of Fundy, melded into the climatology where observations were not available.
Best prior estimates of the tidal boundary conditions (elevations and velocities) for five tidal constituents (M2, S2, N2, O1, and K1) were obtained from archived climatological simulations of the Gulf of Maine [Lynch et al., 1996]. Boundary conditions for temperature, salinity and residual elevation were also extracted from the Gulf of Maine climatology [Lynch et al., 1996].
River discharge data were obtained from archived U.S. Geological Survey and Water Survey of Canada stream gauge stations for the seven main rivers in the model domain (Figure 2): Merrimack, Saco, Kennebec, Androscoggin, Penobscot, St. Croix, and St. John. The associated river transport was imposed in the model domain area closest to the location of the measurement station. When discharge data for the St. John river (the closest river to the mouth of the Bay and the most relevant to the dynamics of the Gyre) during the spring preceding each of the cruises was compared with climatological values no significant difference was observed (not shown) and therefore climatological values were used for simplicity.
Hourly wind stress forcing was obtained from National Data Buoy Center (NDBC) station 44027 (Jonesport, ME), which was the closest location to the mouth of the Bay of Fundy not affected by land-sea effects. The observed wind stress from station 44027 (Figure 3) had stronger magnitudes in May 2005 with a storm (peak wind stress, 0.44 Pa) during the early part of the cruise and moderate winds during most of the remaining time. The weakest averaged wind stress was observed during June–July 2007.
Figure 3.
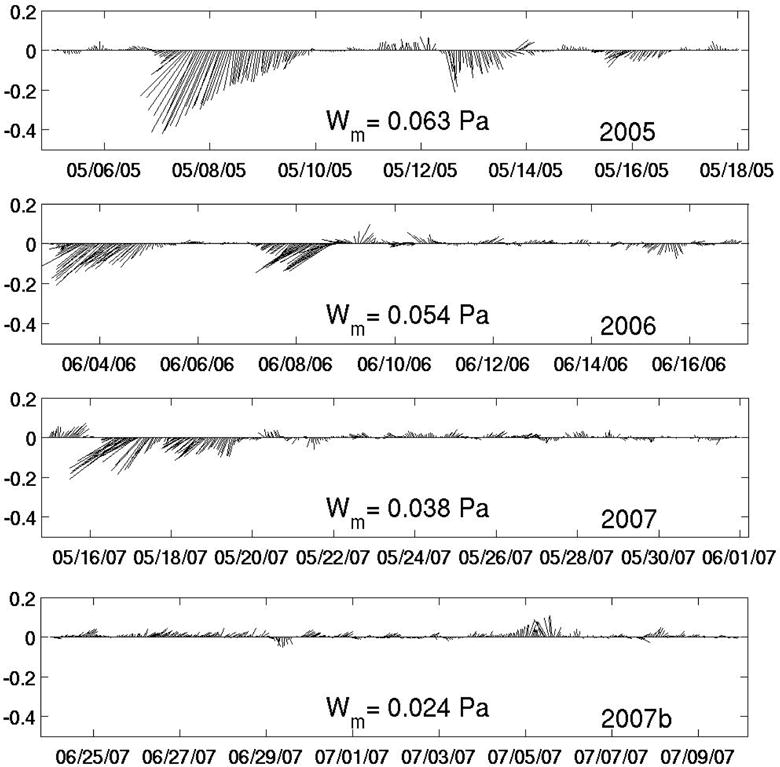
Hourly wind stress from NDBC station 44027 for the four study periods: a) May 2005, b) June 2006, c) May 2007, and d) June–July 2007. The averaged wind stress during each period is also included.
Climatological heat fluxes [Naimie et al., 1994; Lynch et al., 1996; Aretxabaleta et al., 2008] were used. The underlying assumption is that the difference between real fluxes and climatological estimates had a minimal effect on the general circulation over time scales of two weeks (length of hindcast simulations). The heat flux estimates for each year provided by NCEP/NCAR Reanalysis [Kalnay et al., 1996] were not significantly different from monthly climatological estimates (not shown). The influence of the interannual variability in the heat flux and river discharge on density was partially represented by the inclusion of the observed hydrographic data into the initial conditions.
3. Results
3.1. Drifter trajectories
Each year a set of nine drifters (drogued at 15m) were released along a transect across the Bay of Fundy (Figure 4). Drifters released northeast of Grand Manan Island moved south, drifters closer to the Nova Scotian shore moved northeast, while drifters released over the deeper part of the basin moved initially northeast and then northwest. During 2005 (Figure 4, first row), there was a tendency for drifters to exit the Bay of Fundy area south of Grand Manan Island following the BoFGEP and joining the Maine Coastal Current (~6 days for drifters released in the central and western Bay). Thus, drifters during that period followed only the eastern, northern and western side of the Bay of Fundy Gyre. Drifters released during June 2006 (Figure 4, second row) had a stronger tendency to remain in the Bay of Fundy area. Drifters released on the eastern side of the Gyre (Figure 4g,h) completed three or more loops around the Gyre before leaving the Bay of Fundy. During May 2007 (Figure 4, third row), drifters remained in the Gyre area for longer (10–40 days in the Bay) than in 2005, but the tendency to loop around the Gyre was not as strong as in 2006. For instance, a drifter released northeast of Grand Manan Island (Figure 4i) remained in the Gyre area without following the path of the Gyre or the BoFGEP. Finally, during the June–July 2007 period (Figure 4, fourth row), the drifter tracks suggested a strong tendency to remain in the Bay of Fundy area following the path of the Gyre (15–30 days in the Bay). The high variability in the fate of the observed drifters during all periods was consistent with the highly dynamic flow field in the region.
Figure 4.
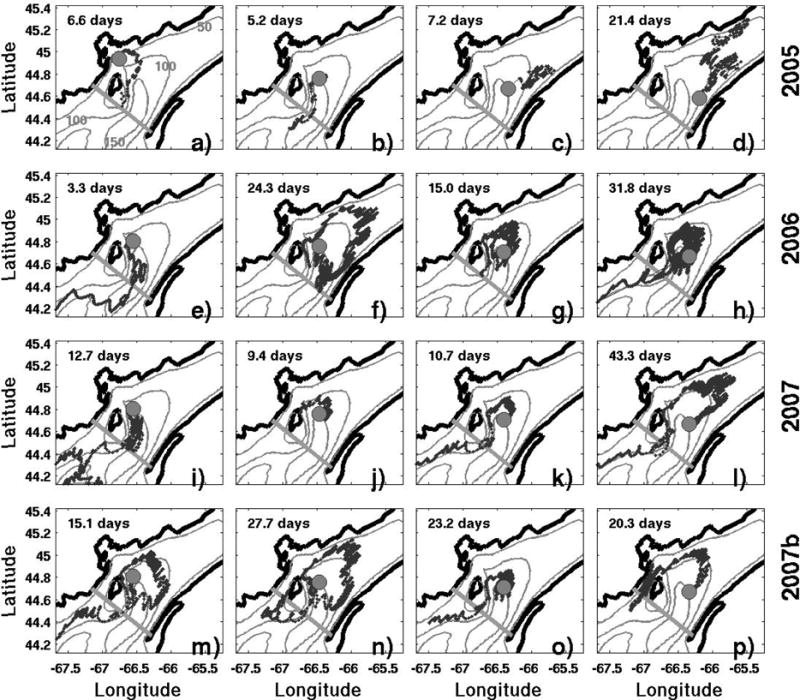
Selected observed drifter paths for four periods: 1st row, May 2005; 2nd row, June 2006; 3rd row, May 2007; and 4th row, June–July 2007. Drifters were released along a transect across the Bay of Fundy and drogued at 15m. Gray dots indicate release locations. The period of time (days) the particles remained in the Bay of Fundy is also included.
3.2. Hindcast evaluation
The fidelity of the hindcast simulations was evaluated based on two comparisons. The first one was misfit reduction, where misfit is the difference between the assimilated ADCP velocities (both shipboard and moored) and the simulated velocities for the same location and time. The second comparison was skill, which was evaluated based on differences on two parameters: a) the difference in position between observed (non-assimilated) drifters and model drifters, and b) the temperature and salinity difference between GoMOOS buoy observations and model solutions. To obtain the most realistic representation of the flow field, experiments with several different assimilation parameters and model inputs were conducted for each period (Table 1). One set of those parameters was found to provide the best performance over all four periods (Table 1, third column).
Table 1.
Options (range) and optimal values chosen for both assimilation parameters and model inputs. Model inputs include initial condition (ICs) sources (climatological or objectively analyzed updated fields), wind stress data, and velocity data sources for assimilation. Data assimilation parameters include: the expected velocity, Vrms (ms−1), and the penalizations on boundary adjustment size (W0), slope (W1), and temporal gradient (W2).
| Options/Range | Optimal values | |
|---|---|---|
| ICs | climatology simple OA update iterative update | iterative update |
|
| ||
| Wind | shipboard NDBC 44027 GoMOOS Buoy I | NDBC 44027 |
|
| ||
| Velocity | shipboard GoMOOS both | both |
|
| ||
| DA Parameters | ||
| Vrms | 0.03–0.2 | 0.03 |
| W0 | 0.1–1.0 | 1.0 |
| W1 | 109–1013 | 3 × 10¹² |
| W2 | 109–1014 | 1.8 × 10¹³ |
The simulation that provided the best level of skill while providing adequate misfit reduction was chosen for each hindcast period. As an example, the drifter skill metric for May 2007 including drifter path and separation rate is given in Figure 5. The comparison between observed and model trajectories was conducted only for the period between release and the end of the cruise (6 days), even if the observed drifters continued moving after that period, as seen in Figure 4. During these 6 days (May 25–June 1, 2007), drifters transited the eastern, northern and western sides of the Gyre. The separation time series (Figure 5, bottom) showed a more rapid separation during the initial days and a slower separation rate over the final days. A similar behavior has been observed in previous studies in several regions (Georges Bank, Aretxabaleta et al. [2005]; Manning and Churchill [2006]; Gulf of Maine, He et al. [2005]; Adriatic Sea, Castellari et al. [2001]).
Figure 5.
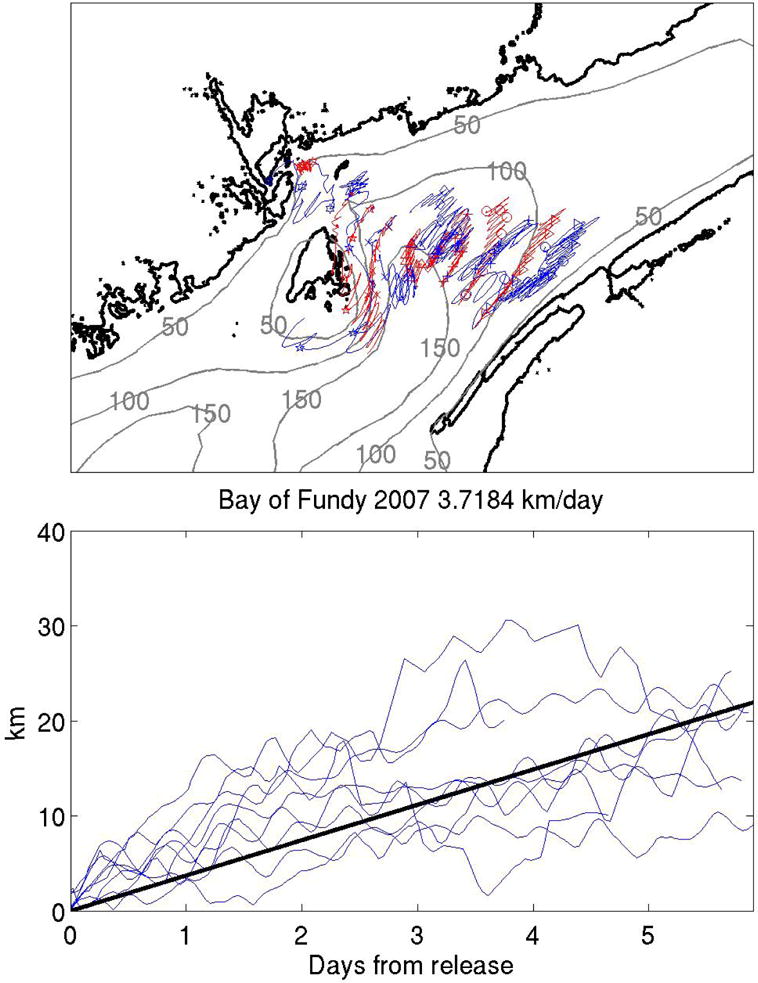
Top Observed (blue) and model (red) drifter paths during the cruise period in May 2007. Drifters were drogued at 15m. Bottom Time series of the separation between modeled and observed drifters as a function of time from release. The skill metric is the averaged separation rate of all drifters. The black line represents the linear fit to all drifters.
The results for both misfit reduction and drifter skill for the best simulation for each period are shown in Table 2. The RMS size of the observed ADCP velocity during June 2006 was larger (0.3 ms−1) than in any other period. The misfit between observations and the first forward run of the model, prior, was similar for all periods (~ 0.12 ms−1). After data assimilation, posterior, the misfit was reduced by 10% between prior and posterior runs (0.10 – 0.11 ms−1). Relaxing the constraints on amplitude and smoothness of the boundary condition perturbations inferred by the data assimilation models, could further reduce the misfit. However, such “overfitting” would produce unrealistic solutions away from the data.
Table 2.
Comparison of misfit reduction (m s−1) and drifter skill level (km day−1) for the four hindcast simulations: May 2005, June 2006, May 2007 and June–July 2007. The first data column is the RMS size of the observed ADCP velocity (shipboard and moorings). The second is the size of the misfit (difference between model and observed velocities) after the prior (forward) run of the model. The third column is the misfit size for the posterior (after data assimilation). The fourth, fifth, and sixth columns are the separation rate (km day−1) between observed and model drifters for three different model simulations: climatological [Aretxabaleta et al., 2008], prior, and posterior, respectively.
| Misfit | Skill | |||||
|---|---|---|---|---|---|---|
| Data | Prior | Posterior | Clim. | Prior | Posterior | |
|
| ||||||
| May 2005 | 0.223 | 0.114 | 0.109 | 7.54 | 5.83 | 5.68 |
| June 2006 | 0.302 | 0.120 | 0.108 | 8.10 | 7.12 | 6.75 |
| May 2007 | 0.213 | 0.118 | 0.103 | 6.01 | 4.05 | 3.72 |
| Jun/Jul 2007 | 0.248 | 0.118 | 0.096 | 6.67 | 5.66 | 5.29 |
A comparison of model velocities with observed mean and tidal velocities at the GoMOOS locations could not be considered as an independent measure of skill because the GoMOOS ADCP velocities were part of the assimilated data. Therefore, they were included as part of the misfit evaluation. The mean residual velocity difference between model and GoMOOS stations was 0.10 m s−1 (ranging from 0.02 m s−1 at Buoy I at 50m during May 2005 and Buoy M at 250m during June 2006 to 0.18 m s−1 at Buoy J at 2m during May 2007). The average tidal velocity difference for all stations was 0.22 m s−1. A comparison between model and observed tidal elevation at coastal stations near the Bay of Fundy showed an average RMS difference of 0.5 m with good magnitude and phase skill (not shown).
The drifter skill metric was estimated for three different simulations (Table 2): the climatological solution from Aretxabaleta et al. [2008]; the prior solution (no assimilation); and the posterior (after assimilation). There was a significant skill improvement by using observed wind and hydrography (prior and posterior) versus climatological fields. A detailed discussion of the skill changes caused by the inclusion of cruise specific updated density fields will be included in Aretxabaleta et al. [in prep.]. The data assimilation provided some further skill improvement ranging from 3% during 2005 to 9% during May 2007. These differences between prior and posterior were expected considering the misfit reduction ranged from 5–15%.
The posterior drifter skill during May 2007 was significantly better than during the rest of the periods. The average skill of the posterior simulations (5.36 km day−1, separation rate between simulated and observed drifters) was larger than previous estimates for other regions: Georges Bank, 3.4 km day−1 [Lynch et al., 2001] and 2.4 km day−1 [Aretxabaleta et al., 2005]; Maine Coastal Current, 1.8 km day−1 [He et al., 2005]. An important factor to consider is the fact that those regions have significantly different circulation regimes. In the mouth of the Bay of Fundy, the surface tidal excursion is 15–25 km. So, small differences in the drifter modeled position could result in large divergences due to the magnitude and strong horizontal shear of the currents. Therefore, the skill level achieved in the current simulations was considered sufficient to justify investigation of the mechanisms underlying interannual variability.
The second skill metric, the difference between modeled and observed temperature and salinity, was estimated by comparing the RMS size of the difference at the location of available observations from the NDBC and GoMOOS buoys (Table 3). The temperature skill of both prior and posterior solutions was slightly better for deeper locations than near-surface ones. The average temperature posterior skill ranged from 0.6 °C in May 2005 to around 1 °C in May 2007. The average salinity skill for the posterior solutions ranged from 0.2 psu in June/July 2007 to 0.4 psu in June 2006. The percentage improvement from prior to posterior ranged from 8% for salinity during May 2007 to around 50% for temperature and salinity during May 2005 and for temperature during June 2006.
Table 3.
Temperature (°C) and salinity skill level for the four hindcast simulations: May 2005, June 2006, May 2007 and June–July 2007. The skill is evaluated as the rms difference between observed and model values. The comparison is conducted at NDBC buoy 44027 and GoMOOS buoys I, J, L, and M at different depths. The average temperature and salinity (bold) for all stations is also included.
| T/S Stat. | Depth | 2005 | 2006 | 2007 | 2007b | ||||
|---|---|---|---|---|---|---|---|---|---|
| Prior | Posterior | Prior | Posterior | Prior | Posterior | Prior | Posterior | ||
|
| |||||||||
| Temp 44027 | 1m | 0.83 | 2.13 | 1.38 | 0.69 | 2.42 | 2.17 | 1.32 | 1.55 |
|
| |||||||||
| Temp I | 1m | 1.15 | 0.24 | 2.10 | 0.96 | 2.28 | 1.10 | 1.19 | 1.51 |
| 2m | 1.23 | 0.27 | 1.97 | 0.80 | 2.38 | 1.22 | 1.16 | 1.66 | |
| 20m | 1.22 | 0.30 | 1.52 | 0.30 | 1.07 | 0.40 | 1.27 | 0.56 | |
| 50m | 1.02 | 0.18 | 1.56 | 0.28 | 1.07 | 0.29 | 1.30 | 0.45 | |
|
| |||||||||
| Temp J | 1m | 1.80 | 0.66 | 1.55 | 0.26 | 2.43 | 1.78 | 0.90 | 0.56 |
| 2m | 1.81 | 0.67 | 1.53 | 0.25 | 2.33 | 1.66 | 1.11 | 1.94 | |
| 10m | 1.72 | 0.67 | 1.64 | 0.27 | 1.84 | 1.11 | 1.53 | 0.93 | |
|
| |||||||||
| Temp L | 1m | 1.72 | 0.94 | 1.47 | 1.11 | 2.13 | 1.66 | 1.12 | 1.15 |
| 2m | 1.78 | 0.99 | 1.39 | 0.99 | 2.37 | 1.89 | 1.03 | 1.13 | |
| 20m | 1.77 | 1.00 | 3.46 | 2.60 | 1.25 | 0.74 | 1.52 | 1.58 | |
| 50m | 1.71 | 0.82 | 2.21 | 1.02 | 1.14 | 0.82 | 0.68 | 0.48 | |
|
| |||||||||
| Temp M | 1m | 2.36 | 0.95 | 2.48 | 1.55 | 2.80 | 1.25 | 3.05 | 0.85 |
| 2m | 2.39 | 0.97 | 2.37 | 1.35 | 2.79 | 1.26 | 3.13 | 0.81 | |
| 20m | N/A | N/A | N/A | N/A | 2.69 | 1.19 | 1.80 | 0.72 | |
| 50m | 0.96 | 0.30 | 0.21 | 0.54 | 1.09 | 0.50 | 0.22 | 0.48 | |
| 100m | 0.72 | 0.26 | 1.02 | 0.13 | 0.47 | 0.55 | 0.45 | 0.22 | |
| 150m | 1.04 | 0.34 | 0.81 | 0.35 | 0.76 | 0.76 | 0.53 | 0.15 | |
| 200m | 0.51 | 0.13 | 0.95 | 0.16 | 0.58 | 0.70 | 0.16 | 0.34 | |
| 250m | 0.56 | 0.28 | 0.89 | 0.13 | 0.17 | 0.38 | 0.25 | 0.30 | |
|
| |||||||||
| Average Temp | 1.38 | 0.64 | 1.61 | 0.72 | 1.70 | 0.97 | 1.18 | 0.87 | |
|
| |||||||||
| Sal I | 1m | 0.54 | 0.25 | 0.47 | 0.51 | 0.19 | 0.20 | 0.21 | 0.16 |
| 20m | 0.33 | 0.27 | 0.27 | 0.44 | 0.19 | 0.21 | 0.26 | 0.11 | |
| 50m | 0.27 | 0.31 | 0.14 | 0.31 | 0.16 | 0.20 | 0.13 | 0.10 | |
|
| |||||||||
| Sal J | 1m | 1.60 | 0.78 | 1.26 | 0.91 | 0.51 | 0.54 | 0.41 | 0.36 |
| 10m | 1.44 | 0.61 | 0.94 | 0.54 | 0.36 | 0.37 | 0.31 | 0.26 | |
|
| |||||||||
| Sal L | 1m | 0.30 | 0.17 | 0.41 | 0.26 | 0.25 | 0.05 | 0.15 | 0.10 |
| 20m | 0.27 | 0.17 | 0.50 | 0.57 | 0.25 | 0.14 | 0.10 | 0.10 | |
| 50m | 0.49 | 0.11 | 0.81 | 0.79 | 0.14 | 0.07 | 0.17 | 0.23 | |
|
| |||||||||
| Sal M | 1m | 0.34 | 0.14 | 0.38 | 0.15 | 0.36 | 0.51 | 0.05 | 0.33 |
| 20m | N/A | N/A | N/A | N/A | 0.11 | 0.23 | 0.15 | 0.16 | |
| 50m | 0.56 | 0.23 | 0.04 | 0.04 | 0.23 | 0.18 | 0.35 | 0.13 | |
| 100m | 0.29 | 0.08 | 0.24 | 0.16 | 0.38 | 0.37 | 0.55 | 0.27 | |
| 150m | 0.32 | 0.06 | 0.12 | 0.10 | 0.32 | 0.18 | 0.39 | 0.12 | |
| 200m | 0.35 | 0.05 | 0.25 | 0.09 | 0.10 | 0.09 | 0.07 | 0.18 | |
| 250m | 0.37 | 0.12 | 0.23 | 0.12 | 0.15 | 0.08 | 0.05 | 0.02 | |
|
| |||||||||
| Average Sal. | 0.53 | 0.24 | 0.43 | 0.36 | 0.25 | 0.23 | 0.22 | 0.18 | |
3.3. Hydrographic structure and circulation
The hydrography and flow field characteristics of the mouth of the Bay of Fundy region were extracted from the best hindcast for each period. Our analysis utilizes the model density field instead of the measured fields to avoid the problem of tidal aliasing. The averaged density structure in a transect across the mouth of the Bay of Fundy (T1, location in Figure 2) revealed significant interannual variability (Figure 6). During 2005, the maximum density (1025.2 Kg m−3) was present in areas deeper than 150 meters, while that density was observed around 80–100 meters in June 2006 and June–July 2007 (Figure 6b,d) and around 50 meters in May 2007 (Figure 6c). The minimum surface density was observed during May 2005 (< 1023 Kg m−3), while during May 2007 the minimum surface density was significantly higher (1024.2 Kg m−3).
Figure 6.
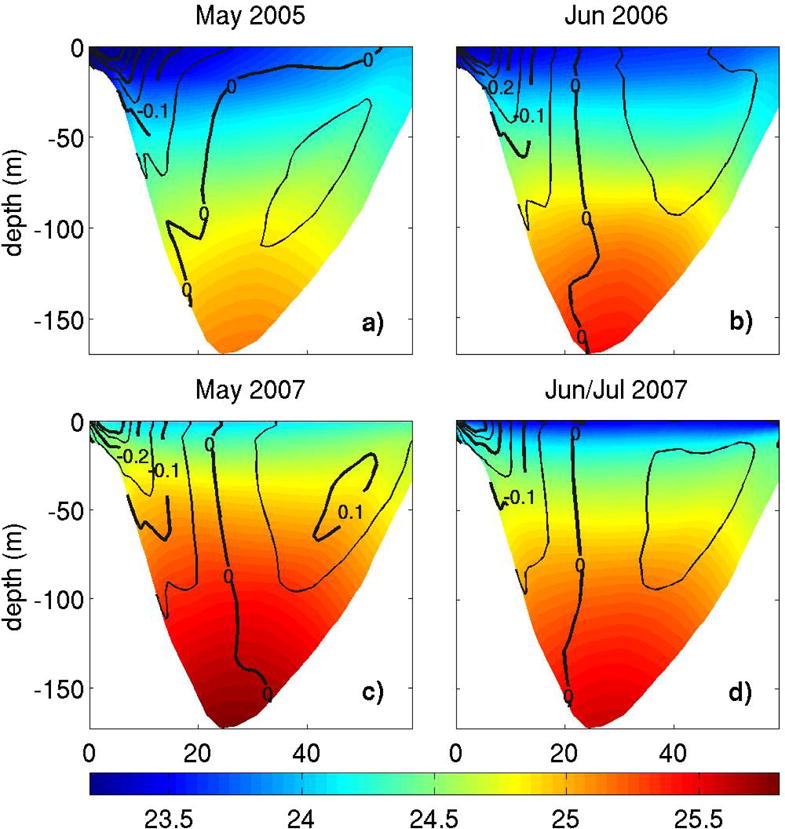
Density (σθ) and normal velocity along transect T1 across the mouth of the Bay of Fundy (Figure 2) for the four hindcast periods: a) May 2005, b) June 2006, c) May 2007, and d) June–July 2007. σθ surfaces are represented in color and normal velocity with contours. Thick contours represent intervals of 0.1 ms−1, while thin contours are intervals of 0.05 ms−1. Positive values indicate flow into the Bay. X-axis is distance (km) from northern edge of transect T1.
Interannual variability could explain some of the differences between periods. However, because the observations were collected in different periods of the stratified season (observations from May through July), we expect seasonal variability to influence as well. Interannual physical factors include differential surface mixing due to wind stress, differences in heat flux between years, and advection of different water masses into the Bay. Averaged tidal mixing was similar for all cruise periods because they included entire spring-neap cycles, but the specific hydrographic transects were conducted during different phases of the spring-neap cycle (transition from spring to neap, May 2005; peak spring tide, June 2006; transition from neap to spring tide, May and June–July 2007). As mentioned before, the discharge of the St. John river was not significantly different from climatological values for any of the years studied (not shown), and its significant fresh water effect on density structure was present during each period. The posterior solutions included an improved representation of the salinity structure associated with the St. John river plume (note the improvement in salinity difference at GoMOOS buoy J, Table 3).
The normal velocity across transect T1 showed similar general patterns during the different periods (Figure 6), with flow into the Bay in the eastern side of the transect, and stronger flow out of the Bay in the western side. Within this general pattern, important differences between each period were evident. During May 2005 (Figure 6a) the flow into the Bay (WNSI) was mostly less than 0.05 ms−1, whereas during May 2007 (Figure 6c) there was a subsurface maximum of more than 0.1 ms−1. In the western side of the transect, during 2005 the −0.1 ms−1 contour extended to a depth of 45 meters, while during the rest of the periods that contour was present around 55–70 meters.
The averaged density structure in a transect (T2) along the axis of the Bay of Fundy exhibited high variability in the strength and extent of the dense water pool at the center of the Gyre (Figure 7). During May 2005, the dense water pool was barely recognizable at the bottom of the basin at the mouth of the Bay (near-bottom density, 1025.2 Kg m−3, Figure 7a). During the rest of the periods the density in the basin was higher, with near-bottom density reaching a maximum during May 2007 (1025.7 Kg m−3, Figure 7c). Also note that the vertical and horizontal density gradients were weaker during May 2005. In the area south of the mouth of the Bay of Fundy (x = 50 km in Figure 7), the near-bottom density was slightly lower during May 2005 than during the rest of the periods.
Figure 7.
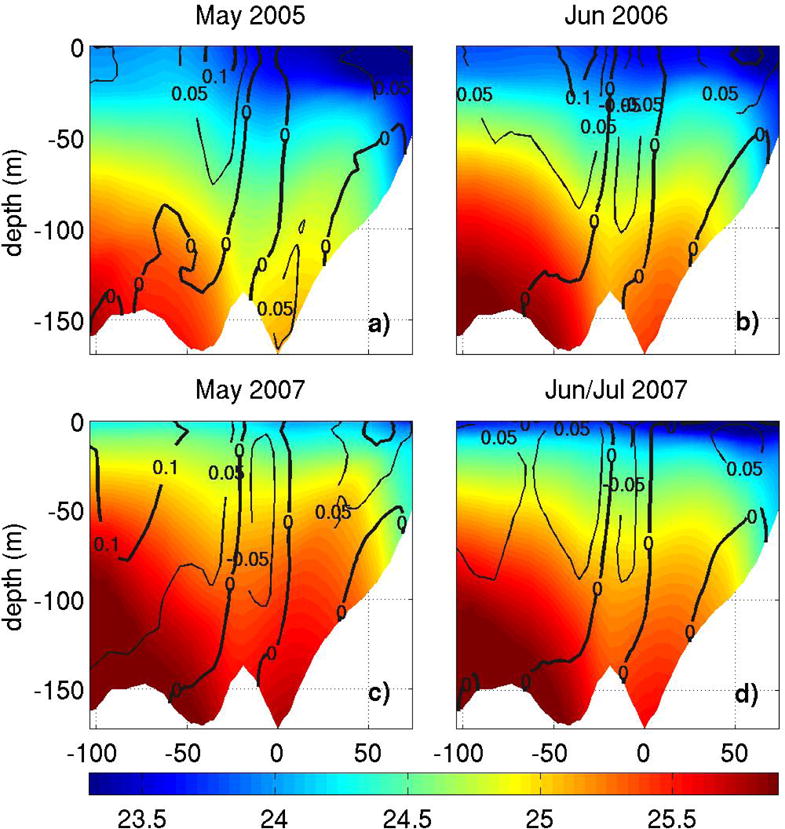
As in Figure 6 but for transect T2 along the axis of the Bay (Figure 2) Positive values indicate NW flow (toward Maine and New Brunswick). X-axis is distance (km) from deeper part of basin at the mouth of the Bay in transect T2, with positive values going into the Bay.
During all periods, the normal velocity in transect T2 (Figure 7) showed the presence of three aspects of the circulation: 1) the direct connection between the SSCC and the EMCC (positive velocity from the beginning of the transect at −100km to −20km in Figure 7), 2) the southeast flow that represented the southern branch of the Gyre (negative velocity from −20km to 0km, over the deeper part of the basin), and 3) the northwest flow as part of the northern branch of the Gyre in the rest of the transect (at all depths except near-bottom starting around 30km). The southeast flow associated with the southern branch of the gyre was weaker during May 2005 (Figure 7a) than during the rest of the periods. There was a slight maximum in extension and strength (more negative velocities) during May 2007 (Figure 7c). The northern branch of the Gyre had a similar behavior with a minimum during May 2005 and a maximum during May 2007. The strength of the flow connecting the SSCC and the EMCC in this transect was maximum during June 2006 and May 2007 (Figure 7b,c) with slightly higher velocities than during May 2005 but substantially stronger than June–July 2007 (Figure 7d). The flow formed a relatively narrow jet during May 2005, while during June 2006 the jet was still recognizable but its horizontal extent had increased. During 2007, there was a southwest displacement of the flow connecting the SSCC and the EMCC (Figure 7c,d).
Estimates of averaged transports in the mouth of the Bay associated with the Gyre are listed in Table 4. The average transport for every period and all branches of the Gyre was around 0.1 – 0.2 Sv. The least intense branch during all periods was the southeast flow associated with the southern edge of the Gyre. Minimum transports were estimated for May 2005 (0.08 – 0.15 Sv) while May 2007 exhibited maximum values (0.14 – 0.2 Sv). Tidal flow significantly modified transports across the transects at any given time with instantaneous transports being up to 5 times larger than the mean for the eastern branch of the Gyre. The difference between Eulerian and Lagrangian transports was less than 10% (not shown). The transport of the connecting flow associated with the SSCC exhibited a peak during May 2007 (0.8 Sv) and a minimum during May 2005 (0.3 Sv).
Table 4.
Mean transports (Sv) of the different branches of the Gyre and the connecting flow associated with the SSCC for the four hindcast periods: May 2005, June 2006, May 2007, and June–July 2007. Transports were calculated along two vertical transects of the mouth of the Bay of Fundy: T1 (cross-Bay), east and west branch transports; and T2 (along-Bay), north and south branches, and SSCC transports. Positive transports correspond with northeastward flow (east branch) in the T1 transect and northwestward flow (north branch) in the T2 transect.
| May 2005 | Jun 2006 | May 2007 | Jun/Jul 2007 | |
|---|---|---|---|---|
|
| ||||
| East | 0.13 | 0.17 | 0.20 | 0.15 |
| North | 0.15 | 0.20 | 0.21 | 0.17 |
| West | −0.12 | −0.15 | −0.16 | −0.14 |
| South | −0.07 | −0.14 | −0.14 | −0.10 |
| SSCC | 0.34 | 0.49 | 0.82 | 0.51 |
Consistent with the normal velocity, the depth-averaged velocity structure in the Bay of Fundy region (Figure 8) showed the presence of the Gyre during all periods. The intensity and extension of the flow around the Gyre varied for each period. The gyre was weakest during May 2005 (Figure 8a), as was the intensity of the EMCC. An intensification of the Gyre, the SSCC, and the EMCC was found in June 2006 (Figure 8b). During May 2007, maximum flow around the Gyre and associated with the EMCC was present (Figure 8c). Finally, a slight decrease in extension and intensity of the Gyre was found between May 2007 and June–July 2007 (Figure 8c,d). The flow associated with the BoFEP showed almost no variability during all periods because the BoFEP is controlled by tidal rectification associated with the steep bathymetry around Grand Manan Island and has a smaller baroclinic contribution [Aretxabaleta et al., 2008].
Figure 8.
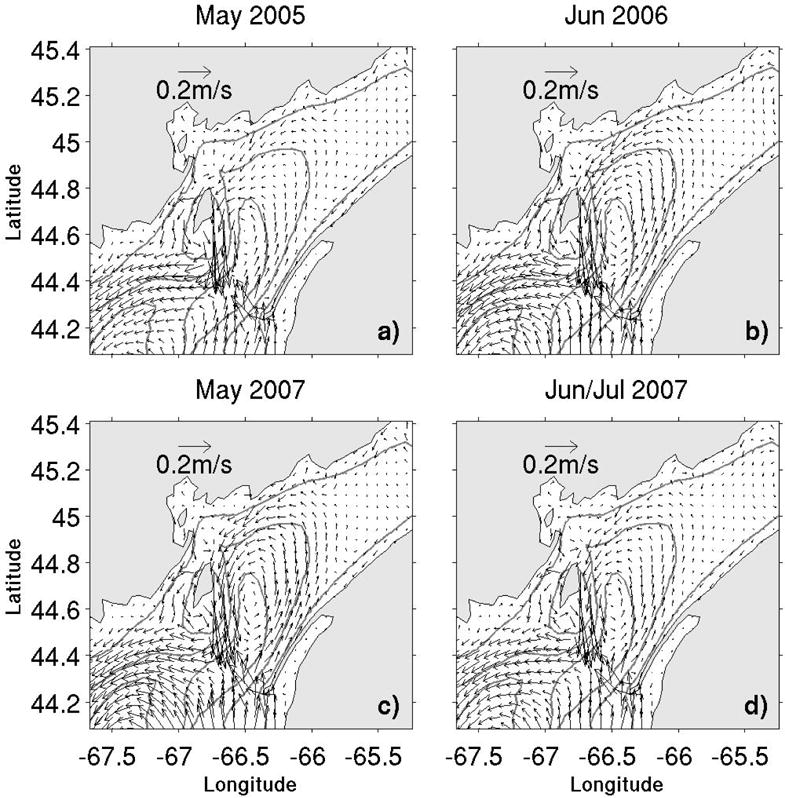
Mean depth-averaged velocity for the four hindcast simulation periods: a) May 2005, b) June 2006, c) May 2007, and d) June–July 2007. The flow was de-tided and averaged for the length of each cruise (~ 2 weeks).
The large differences in the deep density structure between the two 2007 cruises (May and June–July, Figure 7c,d) suggested that advection of different water masses into the Bay of Fundy region by the SSCC is one of the main contributors to the observed variability. The advection effect on Bay variability is consistent with results from nearby regions such as the deep basins of the Gulf of Maine [Brown and Irish, 1992; Smith et al., 2001]. Time series of hydrographic conditions observed at 50 meters at GoMOOS buoy L (north of Browns Bank, Figure 2) exhibited month-to-month fluctuations of similar magnitude, as well as large interannual variability (Figure 9). A strong seasonal cycle was observed in temperature (Figure 9b) with differences between years remaining small and with higher variabilities during summer and fall. Observed salinities during winter and spring 2005 (Figure 9a) were 1 – 1.5 psu fresher than during the other observed years at this station. In fact, low salinities were present starting in fall 2004. The resulting densities (Figure 9c) were controlled by the salinity variability with significant buoyancy anomalies during winter and spring 2005. A smaller density difference was observed at 20 meters at the same station (not shown) with significantly higher variability.
Figure 9.
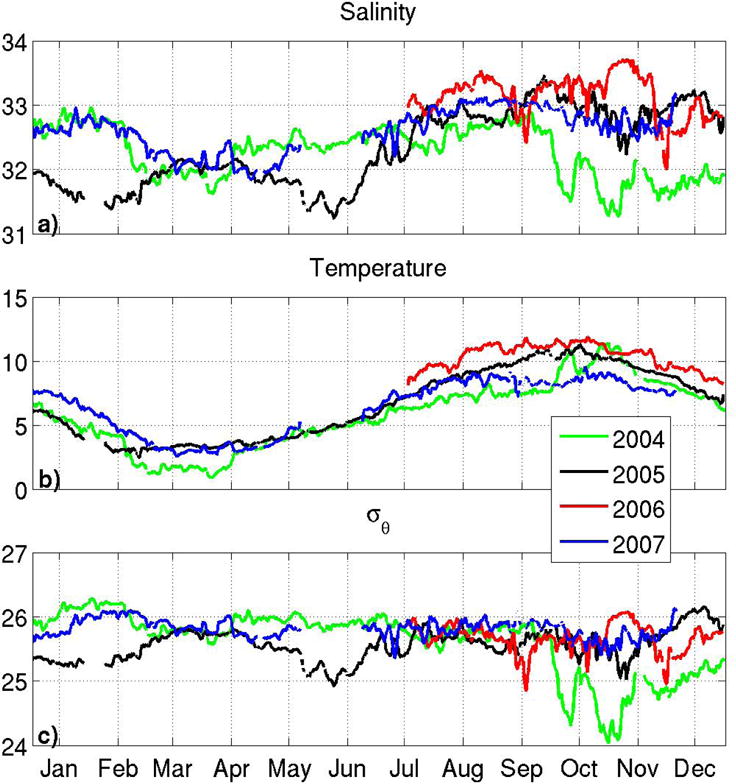
Observed (a) salinity, (b) temperature, and (c) σθ at 50 meters measured at GoMOOS buoy L (location in Figure 2) during the 2004–2007 period. Data has been low-pass filtered.
3.4. Numerical Particle Retention
The retention of simulated particles in the Gyre exhibited variability consistent with the hydrographic variability described above. Two separate experiments were conducted: 1) with fixed-depth particles, and 2) with passive particles. A constant number of numerical particles (~ 20000) was released at each of three different depths (3m, 10m, and 20m below mean sea level) inside the Gyre in each of the experiments. The position of the Gyre was taken from Aretxabaleta et al. [2008] May–June climatological simulations. The particles were tracked for 60 tidal cycles (~ 1 month). As an example, the initial and final position of the fixed-depth particles for the May 2007 period is shown in Figure 10. During that period, a large percentage of the total particles initially released at each level remained inside the Bay after 60 tidal cycles: 42.6% of the particles at 3m, 62.1% of the particles at 10m, and almost all (96.5%) at 20m.
Figure 10.
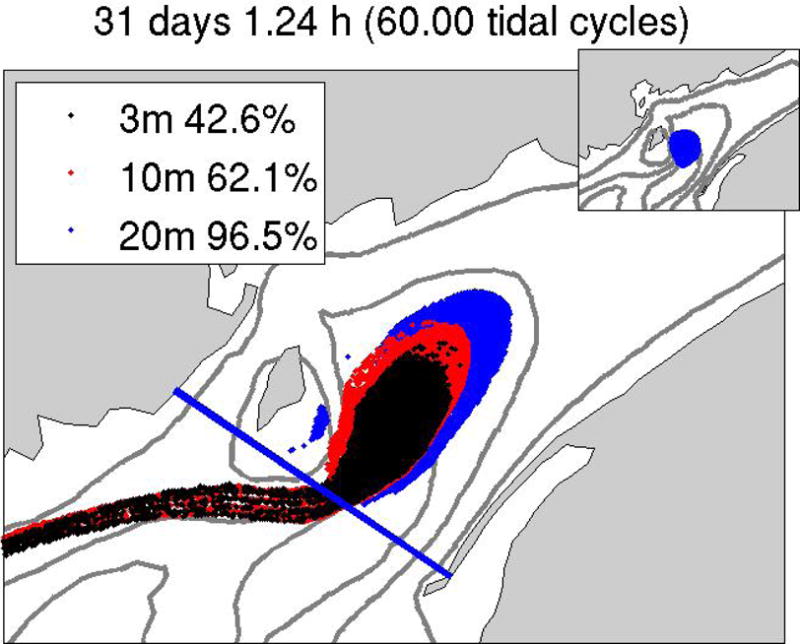
Fixed-depth particles released in May 2007 time-dependent 3-D velocity field. Particles are released (top right inset) at the beginning of a 1 month simulation in a region defined by the 0.11 Sv transport streamline of the May–June climatological depth-averaged velocity [Aretxabaleta et al., 2008] at three depths: 3m, 10m, and 20m. The final position after 60 tidal cycles for the 3m particles are shown with black dots, the final position for 10m are represented by red dots, and the 20m ones by blue dots. The percentage of the initial number of particles present inside the Bay of Fundy at each depth is indicated in the legend.
In order to quantify the retentive properties of the Gyre, functions were fitted to the evolution of the decay in the total number of particles (Figure 11). To describe the observed distribution and following the companion study by [Aretxabaleta et al., 2008], we used a modified logistic curve:
| (1) |
where P(t) is the particle concentration at any time, P0 is the initial number of released particles, κ is the number of particles remaining at t → ∞, and λ is the particle decay rate. P(t) is the solution of the differential equation:
| (2) |
where is a dimensionless particle concentration and β∞ = κ/P0 is the concentration at t → ∞. The root mean square difference (RMSD) between the fitted curve and the retention simulated by the model was calculated as a measure of the error of the fit. In all periods and for all depths, the error was less than 5% of the total signal (range between 1.0% and 4.8%).
Figure 11.
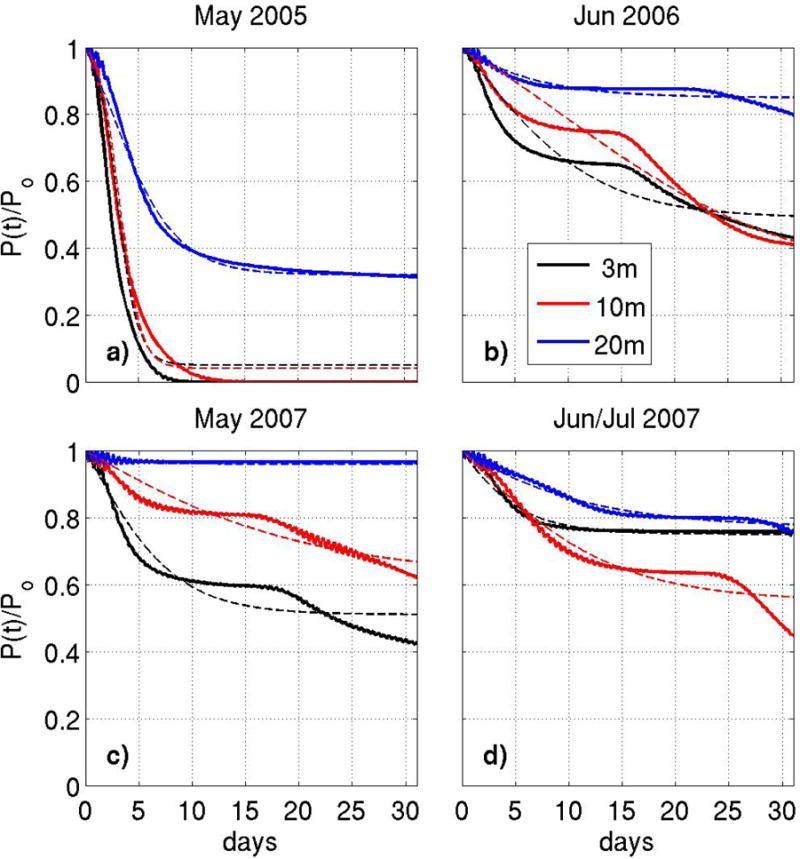
Evolution of the decay in the total number of fixed-depth particles that remained in the Bay of Fundy for the different periods (solid lines) and fit to logistical curves (dashed lines). Three different depths (3, 10, and 20m) are represented by lines of black, red, and blue color, respectively. P (t) is the number of particles inside the Bay of Fundy as a function of time and P0 is the initial number of particles.
Thus, the retention characteristics of the Gyre for different periods can be summarized according to two parameters: 1) half life time scale (t1/2), the time when the mean value between κ and P0 was reached; and 2) β∞, the concentration of particles that tended to remain in the Gyre after the period of initial decay. Table 5 and Table 6 present the retention parameters for each period and depth for fixed-depth and passive particles, respectively. The main differences in retention between fixed-depth and passive particles are: usually fewer passive particles tend to remain in the Gyre (smaller β∞), and consistently, the half lives of the particles that leave is shorter (smaller t1/2).
Table 5.
Retention parameters for fixed-depth particles for all simulations (May 2005, June 2006, May 2007 and June–July 2007) and climatological values for the May–June period [Aretxabaleta et al., 2008]. A logistical curve is used to fit the particle concentration decay in the Gyre (as in Figure 11). β∞, concentration (percentage) of particles at t → ∞, and t1/2, half life decay time (days).
| clim | May 2005 | Jun 2006 | May 2007 | Jun/Jul 2007 | ||||||
|---|---|---|---|---|---|---|---|---|---|---|
| β∞ | t1/2 | β∞ | t1/2 | β∞ | t1/2 | β∞ | t1/2 | β∞ | t1/2 | |
|
| ||||||||||
| 3m | 16% | 7.9 | 5% | 3.0 | 49% | 6.7 | 51% | 4.6 | 73% | 3.2 |
| 10m | 55% | 5.3 | 4% | 3.3 | 30% | 16.1 | 62% | 11.9 | 58% | 6.3 |
| 20m | 52% | 9.0 | 32% | 4.3 | 85% | 4.6 | 96% | 1.7 | 78% | 8.2 |
Table 6.
As Table 5, but for passive particles. β∞, concentration (percentage) of particles at t → ∞, and t1/2, half life decay time (days).
| clim | May 2005 | Jun 2006 | May 2007 | Jun/Jul 2007 | ||||||
|---|---|---|---|---|---|---|---|---|---|---|
| β∞ | t1/2 | β∞ | t1/2 | β∞ | t1/2 | β∞ | t1/2 | β∞ | t1/2 | |
|
| ||||||||||
| 3m | 14% | 7.4 | 6% | 4.4 | 29% | 4.6 | 48% | 5.3 | 72% | 9.3 |
| 10m | 46% | 6.9 | 5% | 5.2 | 48% | 6.7 | 60% | 5.9 | 61% | 4.9 |
| 20m | 43% | 9.5 | 27% | 6.8 | 75% | 5.9 | 88% | 3.1 | 68% | 5.0 |
In general, retention increased with depth, with lower retention near the surface and higher β∞ at 20m. The largest retention (percentage of particles remaining) in the deeper layers was estimated for May 2007 (~60% at 10m and ~90% at 20m). Near the surface, the retention was largest during June–July 2007. The lowest retention for all layers corresponded to May 2005. When the retention characteristics for the different years were compared with climatological estimates [Aretxabaleta et al., 2008], the results from May 2005 suggest that this year was much less retentive than a normal year at all depths for both fixed-depth and passive particles. On the other hand, during the later three periods (2006–2007), the retentions both near-surface and at 20m were larger than climatology, while values at 10m remained near climatological values.
Climatological simulations could have underestimated retention because of the relationship suggested in Aretxabaleta et al. [2008], where strong density gradients at depth were associated with high retention. Unfortunately, the iterative objective analysis used for the hindcast simulations to remove tidal aliasing on temperature and salinity could not be applied to climatological estimates because of insufficient time information for the hydrographic profiles contained in the historical database. Therefore, the climatological density field is smeared by tidal aliasing, and the associated flow could have been underestimated. Thus, the anomalies in retention with respect to climatology must be interpreted with caution.
4. Discussion
4.1. Interannual variability
To quantify the recent interannual variability of the Bay of Fundy Gyre, both observations and model results for May 2005, June 2006, and May 2007 were compared. As described in Section 3.3, the water in transects across the Bay of Fundy was significantly less dense during 2005 than in later years (Figure 6 and Figure 7), both near-surface and at depth. Some of the differences between periods could be attributed to the fact that the cruises did not occur at the same time each year, and an estimate of the intra-annual variability will be given in Section 4.2. The observed hydrographic variations exceeded that which could be explained by local sources, suggesting advection played an important role.
Observations from GoMOOS mooring L north of Browns Bank provide some insight into the advective contributions to the observed water mass variability in the Bay. Although the observed interannual variability in temperature at a mooring north of Browns Bank (Figure 9b) remained small, the significant salinity anomaly during fall 2004, winter and spring 2005 (Figure 9a) in the SSCC controlled the density structure at that site. The observed mid-depth low salinities at Buoy L during 2004 and early 2005 could have been advected into the basin at the mouth of the Bay of Fundy by the mean flow. The relatively weak along-shelf northwest velocity measured at the mooring during spring 2005 would be consistent with lag times of 30–40 days between Buoy L and the Bay (not shown). During this period, the mean density flux, , from Buoy L was highly correlated (lagged correlation) with the observed conditions at NDBC Buoy 44027 and Buoy I (not shown). The advection of the lower density waters could explain the decrease in stratification at mid-depth (50–80 meters) in the Bay observed during the May 2005 cruise and thereby may have contributed to the reduction of the strength of the Gyre.
The observed conditions during the June 2006 cruise could be considered a transition between 2005 and 2007. However, moored observations were not available for spring 2006, and the June 2006 cruise was conducted later in the stratified season than the May 2005 cruise and in between the May 2007 and June–July 2007 cruises. The density structure in 2006 is likely to have been affected by increased heat flux creating lighter waters near the surface as the season progressed, as well as advective processes.
During May 2007, the observed along-shelf velocity at Buoy L (not shown) and modeled velocity during the cruise period (Figure 8c) exhibited the strongest flows in the SSCC, the BoF Gyre, and the EMCC. Denser waters from the Scotian Shelf in 2007 were advected by the relatively strong SSCC into the Bay of Fundy region (15–25 day lag times between Buoy L and the Bay) creating strong stratification with increased sloping of the isopycnals in the deeper part of the basin.
Although the signature of remote forcing of the Bay of Fundy is clear, the mechanisms underlying that forcing are not completely defined in the current study. We have used the observed variations in water properties and velocity at Buoy L as proxies for quantifying advective influences, and a variety of processes could be responsible for those variations. These include: 1) fluctuations of the Browns Bank gyre [Smith, 1989a, b], 2) the Scotian Shelf circulation and hydrographic conditions [Smith, 1989a; Loder et al., 1997, 2001; Hannah et al., 2001], 3) the inflow through the Northeast Channel [Ramp et al., 1985], and 4) the influence of Gulf Stream rings [Brooks, 1987; Smith, 1989a]. Detailed diagnosis of how these various factors may have contributed to hydrographic variations observed in the Bay go beyond the scope of the current study. Nevertheless, previous studies have described a clear connection between the variability of the deep basins inside the Gulf of Maine and the advected water masses into the Gulf [Smith, 1989a; Brown and Irish, 1992; Smith et al., 2001; Pershing et al., 2001]. For instance, large salinity anomalies of up to 1 psu in the Jordan and Georges Basins were associated with modifications on the influx of Scotian Shelf water [Smith et al., 2001]. The basin at the entrance of the Bay of Fundy is directly connected with the northern Gulf and therefore fluctuations occurring in the Gulf could modify the water mass characteristics inside the Bay. In fact, several studies have shown the relationship between the variability at a station in the western Bay of Fundy near Grand Manan Island (Prince 5 station, at the 100 m isobath) and the water offshore of the Scotian Shelf, with increased westward flow of Scotian Shelf water leading to cooling and freshening trends [Petrie and Drinkwater, 1993; Drinkwater, 1996].
4.2. Intra-annual variability
The variability of the Bay hydrography and circulation during the stratified season can be assessed by comparing the two cruises during 2007. Climatological results predict the strongest flow for the May–June period and a slight decrease during July–August [Aretxabaleta et al., 2008]. During 2007, the strength of the circulation around the Gyre (Figure 8c,d) decreased in a similar manner. In June–July, the density across the mouth of the Bay of Fundy decreased at all depths, resulting in a weakening of the deep (> 50 m) stratification (Figure 6 and Figure 7). The partial disappearance of the dense near-bottom waters (dense pool) could explain the decreased Gyre strength. Stratification above 50 meters was stronger during June–July than in May, as a result of the warming caused by surface heat flux as the season progressed and additional river discharge from the St. John river. The magnitude of the near-surface intra-annual variability observed in density between May and June–July 2007 was comparable to the climatological mean differences between the May–June and July–August periods while near-bottom the differences were slightly larger. Model simulations suggested that the decrease in density between May and June–July 2007 was associated with the advection of lower density water from the Scotian Shelf. The model indicates stronger than normal flow in both the SSCC and through the Northeast Channel during May 2007. However observations to corroborate this result were not available.
4.3. Factors contributing to variability in retention
The variability of particle retention during the four periods suggests May 2005 was significantly less retentive than the following years. Several factors can contribute to variability in retention, including wind stress, stratification, strength of the Gyre, and the interaction with the adjacent circulation of the Gulf of Maine. Because the strength of the Gyre is influenced by local and remote forcings, the above factors were linked directly and indirectly.
The circulation of the Gyre was primarily controlled by the variability of the well-described dynamics associated with dense water pools [Garrett, 1991; Hill, 1996, 1998]. A balance between stratification and friction is established around a dome of dense water, where the near-bottom density gradient results in geostrophic shear, creating flow around the periphery of the basin affecting the water column especially over the dense water pool. The mechanism is the same as in other bottom-dominated fronts [Garrett and Loder, 1981; Garrett, 1991]. This type of circulation appears for both top to bottom well-mixed fronts in shallow areas, and well-mixed bottom boundary layer fronts. The circulation associated with such dense water pools in the coastal ocean has been intensely investigated in the case of the Irish Sea [Hill et al., 1994; Horsburgh et al., 2000].
The interaction between the Gyre and the adjacent circulation was affected by the changing density structure and stratification of the dense water pool, and vice versa. During 2005, when the deep stratification was eroded and the slopes of the density surfaces were least steep, the WNSI was weakened and the SSCC followed the branch that directly connected with the EMCC. After the dense water pool was recovered in 2006, normal steepness of the isopycnals returned and the Gyre intensified. A comprehensive study of the influences of the variability in the SSCC and SSW (both seasonal, Smith [1983] and Hannah et al. [2001]; and interannual Loder et al. [2001]) is needed to fully understand these interactions and is beyond the scope of the current study.
Another consequence of the interaction between Bay and Gulf circulation was the appearance of two regions of relative near-surface convergence at the mouth of the Bay: 1) the confluence of the WNSI and the southern branch of the Gyre on the eastern side of the Bay, and 2) the interaction between the southwest flowing BoFGEP and the westward flow of the EMCC. These areas of near-surface convergence were associated with strong downwelling (not shown). In particular, more intense convergence and downwelling in the steepest topographic gradient area between the 40m and 100m isobaths inside the Bay resulted in increased retention of particles. The hindcast simulations were consistent with climatological results [Aretxabaleta et al., 2008] in this respect: lower retention (Figure 11a) was observed when the EMCC and the WNSI were weaker (Figure 8a) in 2005; and when the adjacent currents were more intense and the convergence at the mouth of the Bay was stronger (Figure 8c), so was particle retention (Figure 11c).
Wind stress influenced retention both by the direct effect of wind-driven flow on the transport of particles out of the Bay through the BoFGEP, and by indirect changes on local stratification that determine Gyre strength. Ekman transport induced by northwest, north, and especially northeast winds favored loss of particles from the Bay. During May 2005, mean wind stress was stronger than during other periods (Figure 3a), while the weaker winds of 2007 (Figure 3c,d) coincided with higher retention. Wind intensity was weakest during June–July 2007 resulting in a significantly higher near-surface retention.
Near-surface stratification (20–40 meters) and horizontal density gradients were large during May 2005 and June 2006, causing stronger vertical shear in velocity and increased cross-Bay surface flow (not shown). Strong cross-Bay flow can result in a decrease in retention [Aretxabaleta et al., 2008]. On the other hand, strong deep stratification associated with the presence of the cool and saltier water pool leads to an intensification of the circulation around the Gyre and, therefore, an increased retention in the Bay. May 2007 represented a clear example of strong Gyre flow and the resulting higher retention (Figure 11c).
Interannual variations of wind intensity also affect the structure of the hydrography and flow fields in the Bay. The wind stress magnitude during fall and winter 2004–2005 was significantly higher than both later years and climatological values (Table 7). The strong winds during fall and winter led to increased surface mixing in the Bay, while tidal mixing remained basically constant during all years. The resulting increased mixing could have contributed to the erosion of the stratification associated with the dense water pool at the center of the basin. The wind stress effect may not have been restricted to the previous fall-winter period, and several seasons of strong wind mixing (as during 2003–2005) likely resulted in increased erosion of the density structure. Although winter normal conditions consist of a weakly stratified water column, examples of winter mixing causing stratification erosion at least to mid-depths by vertical overturning have been described in the Gulf of Maine [Brown and Beardsley, 1978]. Observed winter profiles of the Bay of Fundy region are sparse. Temperature profiles in the Bay during winter 1932 [Hachey, 1934] exhibited well mixed conditions. Repeated hydrographic profiles in a station over the 100m isobath in western Bay of Fundy (Prince 5, Page et al. [2000]) exhibited almost no stratification for the entire water column during most of winter 1999, while long-term average (1961–1990) temperature and salinity conditions at that station suggested mixed conditions during winter extending at least to mid-depths.
Table 7.
Fall and winter average wind stress magnitude at NDBC station 44027 for each year of the period 2003–2007 and climatological averaged. The averaged period extends from September 15 of the first year until May 15 of the second year.
| climatology | 2003–2004 | 2004–2005 | 2005–2006 | 2006–2007 | |
|---|---|---|---|---|---|
| Magnitude | 0.057 | 0.192 | 0.100 | 0.046 | 0.059 |
Therefore, the different factors affecting variability could have been intrinsically interconnected. Wind-induced mixing may have modified stratification strength and the slope of the isopycnals. The interaction with adjacent circulation influenced the transports in and out of the Bay and the advection of anomalous water masses. This advection in turn determined the density structure and the strength of the Gyre through the bottom boundary layer front. Thus, isolating the effects of the different factors remains a challenge.
5. Summary and Conclusions
The recent variability of the Bay of Fundy Gyre during the stratified season and its effects on particle retention have been described. Observations and model results for May 2005, June 2006, and both May and June–July 2007 were analyzed to estimate both inter- and intra-annual variability. The presence of a dense (relatively cool and salty) water pool in the deeper part of the basin at the mouth of the Bay during the stratified season was suggested in a companion study [Aretxabaleta et al., 2008] as the main factor controlling the cyclonic flow.
During May 2005, the density and its vertical gradient and slope in the mouth of the Bay of Fundy were reduced. Thus, flow around the Gyre was slower than normal (compared to climatological values for May–June in Aretxabaleta et al. [2008]) and the loss of particles was significantly higher (Figure 11a). By June 2006, the dense water pool had returned to the deep part of the basin and, associated with it, retention of particles increased at all layers (Figure 11b). Residence times during that period were longer than 30 days for 30–85% of the particles and the half life time for the particles that escaped was 5–16 days (larger than climatological estimates). The density gradient in the deep cool and salty pool and the associated circulation around the Gyre reached a maximum during May 2007. Most of the particles released during that period remained in the Gyre (Figure 11c, 96% of particles at 20m remaining). By June–July 2007, the Gyre circulation weakened slightly associated with a relaxation of the deep density gradient. The retention of particles during this last period decreased slightly in the sub-surface layers (10m and 20m) while increasing near the surface (Figure 11d).
The variability associated with the advection of water masses with different characteristics to the mouth of the Bay region was an important factor contributing to the retention variability through modifications of the dense water pool. The strengthening of the density gradient associated with the bottom boundary layer front resulted in an intensification of the flow around the Gyre. Advection of lower than normal mid-depth salinities from the Scotian Shelf during the period between fall 2004 and spring 2005 by the SSCC resulted in less dense waters inside the Bay and an almost non-existent dense water pool. The interaction between Gulf of Maine currents (EMCC and SSCC) and the Gyre had both direct (modification of Gyre strength and convergence regions) and indirect (influence on the dense water pool) effects on retention. Further characterization of the these interactions is needed.
Interannual variations in wind stress constitute a significant source of variability in hydrographic and flow structure during the stratified season (spring-summer). While neither river discharge nor heat flux were significantly different between 2005 and the following years, the mean wind stress magnitude during the two fall-winter periods before spring 2005 were nearly four times (2003–2004) and twice (2004–2005) that of climatological values. The increased surface mixing in the Bay could have contributed to erosion of the stratification associated with the dense water pool, resulting in a weakening of the cyclonic flow during the spring season and, thus, reducing the retentiveness of the Gyre. Additionally, the direct action of strong winds (especially in the northeast direction) produced excess transport of near-surface particles out of the Bay through the BoFGEP. Strong northeast winds during May 2005 contributed to the loss of particles, while weaker winds during June–July 2007 resulted in the highest near-surface retention.
It is of interest to examine the significance of these interannual fluctuations on biological processes. Because the Bay of Fundy is one of the two key source regions for blooms of A. fundyense in the Gulf of Maine [Anderson et al., 2005a; McGillicuddy et al., 2005], interannual variability in the retentiveness of the Gyre can potentially influence the regional dynamics of these blooms. Assuming the Bay of Fundy source population (benthic cysts) is stable over time [He et al., 2008], more retention of vegetative cells within the Gyre would reduce the flux of cells into the adjacent waters of the Gulf of Maine. The interannual variability in Gyre retentiveness described herein is consistent with the overall patterns in A. fundyense regional bloom dynamics during 2005–2007. When the Gyre was least retentive in 2005, the entire Gulf of Maine but especially the western part experienced one of the worst A. fundyense blooms in three decades [Anderson et al., 2005b]. Although the main cause of the anomalous 2005 western Gulf of Maine bloom is thought to be a tenfold increase in the western Gulf of Maine cyst bed [He et al., 2008], augmented advective flux by a leakier-than-average Bay of Fundy Gyre may have also contributed. Initial assessments of the blooms in 20061 and 20072 suggest a decrease in overall magnitude with time. Although this may be primarily a result of decreasing cyst concentrations in the Gulf of Maine cyst bed during that same period, increased retentiveness of the Bay of Fundy Gyre would also tend to diminish the magnitude of these downstream blooms by reducing the inflow of vegetative cells into the Gulf.
Therefore, characterization of the formation and evolution of dense water and their interaction with the adjacent circulation is important not only for the understanding of the hydrography and circulation, but also for biological dynamics of the coastal ocean. The use of a combined observation and modeling strategy offers an effective approach to problems of such complexity.
Acknowledgments
The preparation of this paper was supported by NSF grant OCE-0430724 and NIEHS grant 1P50-ES01274201 (Woods Hole Center for Oceans and Human Health) and NOAA grant NA06NOS4780245 (GOMTOX). Additional support was provided by NSF grant DMS-0417769. We thank the crews of R/V Oceanus and R/V Endeavor for their assistance during the cruises. This is ECOHAB contribution number 259. Finally, we thank the two anonymous referees for suggestions that helped clarify the text.
Footnotes
References
- Anderson DM, Stock CA, Keafer BA, Bronzino A, McGillicuddy DJ, Keller MD, Thompson B, Matrai PA, Martin J. Alexandrium fundyense cyst dynamics in the Gulf of Maine. Deep-Sea Research II. 2005a;52:2522–2542. [Google Scholar]
- Anderson DM, et al. Initial observations of the 2005 Alexandrium fundyense bloom in the southern New England: General patterns and mechanisms. Deep-Sea Research II. 2005b;52:2856–2876. [Google Scholar]
- Aretxabaleta AL, Manning JP, Werner FE, Smith KW, Blanton BO, Lynch DR. Data assimilative hindcast on the southern flank of Georges Bank during May 1999: Frontal circulation and implications. Cont Shelf Res. 2005;25:849–874. [Google Scholar]
- Aretxabaleta AL, McGillicuddy DJ, Smith KW, Lynch DR. Model simulations of the Bay of Fundy gyre: 1. Climatological results. J Geophys Res. 2008;113 doi: 10.1029/2007JC004480. [DOI] [PMC free article] [PubMed] [Google Scholar]
- Aretxabaleta AL, Smith KW, McGillicuddy DJ. Dynamic Adjustments for Objective Analysis of Oceanographic Data in the Bay of Fundy. in prep. [Google Scholar]
- Bigelow HB. Physical oceanography of the Gulf of Maine. Bull US Bur Fish. 1927;49:511–1027. [Google Scholar]
- Bisagni JJ, Gifford DJ, Ruhsam CM. The spatial and temporal distribution of the Maine Coastal Current during 1982. Cont Shelf Res. 1996;16:1–24. [Google Scholar]
- Brooks DA. Vernal Circulation of the Gulf of Maine. J Geophys Res. 1985;90:4687–4705. [Google Scholar]
- Brooks DA. The influence of warm-core rings on slope water entering the Gulf of Maine. J Geophys Res. 1987;92:8183–8196. [Google Scholar]
- Brooks DA. A model study of the buyancy-driven circulation in the Gulf of Maine. J Phys Oceanogr. 1994;24:2387–2412. [Google Scholar]
- Brooks DA, Townsend DW. Variability of the coastal current and nutrient pathways in the eastern Gulf of Maine. J of Marine Research. 1989;47:303–321. [Google Scholar]
- Brown WS, Beardsley RC. Winter circulation in the western Gulf of Maine: Part 1. Cooling and water mass formation. J Phys Oceanogr. 1978;8:265–277. [Google Scholar]
- Brown WS, Irish JD. The annual evolution of geostrophic flow in the Gulf of Maine: 1986–1987. J Phys Oceanogr. 1992;22:445–473. [Google Scholar]
- Campbell A. Application of a yield and egg-per-recruit model to the lobster fishery in the Bay of Fundy. N Am J Fish Manag. 1985;5:91–104. [Google Scholar]
- Castellari S, Griffe A, Ozgokmen TM, Poulain PM. Prediction of particle trajectories in the Adriatic Sea using Lagrangian data assimilation. Journal of Marine Systems. 2001;29:33–50. [Google Scholar]
- Dickie LM. Fluctuations in abundance of the giant scallop, Placopecten magellanicus (Gmelin), in the Digby Area of the Bay of Fundy. J Fish Res Bd Canada. 1955;12:797–857. [Google Scholar]
- Drinkwater KF. Atmospheric and oceanic variability in the Northwest Atlantic during the 1980s and early 1990s. J Northw Atl Fish Sci. 1996;18:77–97. [Google Scholar]
- Fish CJ, Johnson MW. The biology of the zooplankton population in the Bay of Fundy and Gulf of Maine with special reference to production and distribution. J Biol Bd Can. 1937;3:189–322. [Google Scholar]
- Garrett CJR. Marginal mixing theories. Atmos-Ocean. 1991;29:313–339. [Google Scholar]
- Garrett CJR, Loder JW. Dynamical aspects of shallow sea fronts. Phil Trans R Soc Lond. 1981;302:563–581. [Google Scholar]
- Garrett CJR, Keely JR, Greenberg DA. Tidal mixing versus thermal stratification in the Bay of Fundy and Gulf of Maine. Atmos-Ocean. 1978;16:403–423. [Google Scholar]
- Godin G. Tech rep, Marine Sciences Branch, Energy Mines and Resources. Ottawa, Canada: 1968. The 1965 current survey of the Bay of Fundy: A new analysis of the data and an interpretation of results. Manuscript Rep. Ser. No. 8; p. 97. [Google Scholar]
- Greenberg DA. Modeling the mean barotropic circulation in the Bay of Fundy and Gulf of Maine. J Phys Oceanogr. 1983;13:886–904. [Google Scholar]
- Hachey HB. The replacement of Bay of Fundy waters. J Biol Bd Can. 1934;1:121–131. [Google Scholar]
- Hachey HB, Bailey WB. Tech rep, Fish Res Bd Canada. St Andrews, N.B., Canada: 1952. The General Circulation of the waters of Bay of Fundy. MS Rep. Biol. Sta., No. 455; p. 100. [Google Scholar]
- Hannah CG, Shore J, Loder JW, Naimie CE. Seasonal circulation on the western and central Scotian Shelf. J Phys Oceanogr. 2001;31:591–615. [Google Scholar]
- He R, McGillicuddy DJ, Lynch DR, Smith KW, Stock CA, Manning JP. Data assimilative hindcast of the Gulf of Maine Coastal Circulation. J Geophys Res. 2005;110 [Google Scholar]
- He R, McGillicuddy DJ, Keafer BA, Anderson DM. Historic 2005 Toxic Bloom of Alexandrium fundyense in the Western Gulf of Maine: 2. Coupled Biophysical Numerical Modeling. J Geophys Res. 2008;113 doi: 10.1029/2007JC004602. [DOI] [PMC free article] [PubMed] [Google Scholar]
- Hill AE. Spin-down and the dynamics of dense pool gyres in shallow seas. J of Marine Research. 1996;54:471–486. [Google Scholar]
- Hill AE. Buoyancy effects in coastal and shelf seas. In: Brink KH, Robinson AR, editors. The Sea. Vol. 10. Academic Press; 1998. pp. 21–62. [Google Scholar]
- Hill AE, Durazo R, Smeed DA. Observations of a cyclonic gyre in the western Irish Sea. Cont Shelf Res. 1994;14:479–490. [Google Scholar]
- Horsburgh KJ, Hill AE, Brown J, Fernand L, Garvine RW, Angelico MMP. Seasonal evolution of the cool pool gyre in the western Irish Sea. Progr Oceanogr. 2000;46:1–58. [Google Scholar]
- Kalnay E, et al. The NCEP/NCAR 40-year Reanalysis Project. Bulletin of the American Meteorological Society. 1996;77:437–471. [Google Scholar]
- Lauzier LM. Bottom residual drift on the Continental Shelf area of the Canadian Atlantic coast. J Fish Res Bd Canada. 1967;24:1845–1859. [Google Scholar]
- Loder JW, Han G, Hannah CG, Greenberg DA, Smith PC. Hydrography and baroclinic circulation in the Scotian Shelf region: Winter versus summer. Can J Fish Aquat Sci. 1997;54(Suppl 1):40–56. [Google Scholar]
- Loder JW, Shore JA, Hannah CG, Petrie BD. Decadal-scale hydrographic and circulation variability in the Scotia-Maine region. Deep-Sea Research II. 2001;48:3–35. [Google Scholar]
- Lynch DR, Hannah CG. Inverse model for limited-area hindcasts on the continental shelf. Journal of Atmospheric and Oceanic Technology. 2001;18:962–981. [Google Scholar]
- Lynch DR, Naimie CE. Hindcasting the Georges Bank Circulation, Part II: Wind-band inversion. Cont Shelf Res. 2002;22:2191–2224. [Google Scholar]
- Lynch DR, Werner FE. Three-dimensional hydrodynamics on finite elements. Part II: Non-linear time-stepping model. Int J Numer Methods Fluids. 1991;12:507–533. [Google Scholar]
- Lynch DR, Ip JTC, Naimie CE, Werner FE. Comprehensive coastal circulation model with application to the Gulf of Maine. Cont Shelf Res. 1996;16:875–906. [Google Scholar]
- Lynch DR, Holboke MJ, Naimie CE. The Maine Coastal Current: Spring climatological circulation. Cont Shelf Res. 1997;17:605–634. [Google Scholar]
- Lynch DR, Naimie CE, Hannah CG. Hindcasting the Georges Bank Circulation: Part I, Detiding. Cont Shelf Res. 1998;18:607–639. [Google Scholar]
- Lynch DR, et al. Real-time data assimilative modeling on Georges Bank. Oceanography. 2001;14:65–77. [Google Scholar]
- Manning JP, Churchill JH. Estimates of dispersion from clustered-drifter deployments on the southern flank of Georges Bank. Deep-Sea Research II. 2006;53:2501–2519. [Google Scholar]
- Martin JL, White AW. Distribution and abundance of the toxic dinoflagellate Gonyaulax excavata in the Bay of Fundy. Can J Fish Aquat Sci. 1988;45:1968–1975. [Google Scholar]
- Martin JL, Hanke AR, LeGresley MM. Long term phytoplankton monitoring, including harmful algal blooms, in the Bay of Fundy, eastern Canada. J Sea Res. 2008 [Google Scholar]
- McGillicuddy DJ, Anderson DM, Lynch DR, Townsend DW. Mechanisms regulating large-scale seasonal fluctuations in Alexandrium fundyense populations in the Gulf of Maine: results from a physical-biological model. Deep-Sea Research. 2005;52:2698–2714. [Google Scholar]
- Mellor G, Yamada T. Development of a turbulence closure model for geophysical fluid problems. Rev of Geophys Space Phys. 1982;20:851–875. [Google Scholar]
- Naimie CE, Loder JW, Lynch DR. Seasonal variation of the three-dimensional residual circulation on Georges Bank. J Geophys Res. 1994;99:15,967–15,989. [Google Scholar]
- Page FH, Ringuette M, Spry J, Clement P. Physical and biological monitoring at Prince 5 during 1999. Tech rep, Can Stock Assess Secret Res Doc 2000/098. 2000 Available at http://www.dfo-mpo.gc.ca/csas/
- Pershing AJ, Wiebe PH, Manning JP, Copley NJ. Evidence for vertical circulation cells in the well-mixed area of Georges Bank and their biological implications. Deep-Sea Research II. 2001;48:283–310. [Google Scholar]
- Petrie BD, Drinkwater KF. Temperature and salinity variability on the Scotian Shelf and in the Gulf of Maine 1945–1990. J Geophys Res. 1993;98:20,079–20,089. [Google Scholar]
- Pettigrew NR, Townsend DW, Xue H, Wallinga JP, Brickley PJ, Hetland RD. Observations of the Eastern Maine Coastal Current and its offshore extentions in 1994. J Geophys Res. 1998;103:30,623–30,639. [Google Scholar]
- Pettigrew NR, Churchill JM, Janzen CD, Mangum LJ, Signell RP, Thomas AC, Townsend DW, Wallinga JP, Xue H. The kinematic and hydrographic structure of the Gulf of Maine Coastal Current. Deep-Sea Research II. 2005;52:2369–2391. [Google Scholar]
- Ramp SR, Schlitz RJ, Wright WR. The deep flow through the Northeast Channel, Gulf of Maine. J Phys Oceanogr. 1985;15:1790–1808. [Google Scholar]
- Shore JA, Hannah CG, Loder JW. Drift pathways on the western Scotian Shelf and its environs. Can J Fish Aquat Sci. 2000;57:2488–2505. [Google Scholar]
- Smith KW. Tech rep, Numer Model Lab. Dartmouth College; Hanover, NH: 2004. Objective Analysis for Circulation Initialization (OACI) 1.2 users’ guide. Available at http://wwwnml.dartmouth.edu/circmods/gom.html. [Google Scholar]
- Smith PC. The mean and seasonal circulation off southwest Nova Scotia. J Phys Oceanogr. 1983;13:1034–1054. [Google Scholar]
- Smith PC. Seasonal and interannual variability of current, temperature and salinity off southwest Nova Scotia. Can J Fish Aquat Sci. 1989a;46(Suppl 1):4–20. [Google Scholar]
- Smith PC. Circulation and dispersion on Browns Bank. Can J Fish Aquat Sci. 1989b;46:539–559. [Google Scholar]
- Smith PC, Houghton RW, Fairbanks RG, Mountain DG. Interannual variability of boundary fluxes and water mass properties in the Gulf of Maine and on Georges Bank: 1993–1997. Deep-Sea Research II. 2001;48:37–70. [Google Scholar]
- Watson EE. Mixing and residual currents in the tidal waters as illustrated in the Bay of Fundy. J Biol Bd Can. 1936;2:141–208. [Google Scholar]
- White AW, Lewis CM. Resting Cysts of the Toxic, Red Tide Dinoflagellate Gonyaulax excavata in Bay of Fundy sediments. Can J Fish Aquat Sci. 1982;39:1185–1194. [Google Scholar]
- Xue H, Chai F, Pettigrew NR. A model study of the seasonal circulation of the Gulf of Maine. J Phys Oceanogr. 2000;30:1111–1135. [Google Scholar]