Abstract
An extensive Alexandrium fundyense bloom occurred along the coast of the Gulf of Maine in late spring and early summer, 2005. To understand the physical aspects of bloom’s initiation and development, in-situ observations from both a gulf-wide ship survey and the coastal observing network were used to characterize coastal circulation and hydrography during that time period. Comparisons between these in-situ observations and their respective long term means revealed anomalous ocean conditions during May 2005: waters were warmer and fresher gulf-wide due to more surface heating and river runoff; coastal currents were at least two times stronger than their climatological means. Surface winds were also anomalous in the form of both episodic burst of northeaster storms and downwelling favorable mean condition. These factors may have favored more vigorous along-shore transport and near shore aggregation of toxic A. fundyense cells (a red tide) in 2005.
Keywords: Coastal circulation, Harmful Algal Bloom
1. Introduction
Blooms of the toxic dinoflagellate Alexandrium fundyense are a common feature during the late spring and summer months in the Gulf of Maine (GOM). These blooms pose a serious human health threat due to the accumulation of neurotoxins in shellfish that feed on the algal cells, resulting in a potentially fatal illness known as paralytic shellfish poisoning (PSP). Earlier studies have shown that A. fundyense blooms are regulated by a suite of complex biological and physical processes, and the timing and distributions of the bloom are closely related to the GOM coastal circulation (see for example, Anderson et al., 2005 DSR II Special Volume).
The general circulation of the GOM (Figure 1) is cyclonic (e.g., Bigelow, 1927; Brooks, 1985; Brown and Irish, 1993; Lynch et al., 1997; Pettigrew et al., 1998; Pettigrew et al., 2005). The eastern segment of the circulation is comprised of the Eastern Maine Coastal Current (EMCC), and inflow from the Scotian shelf. The EMCC is a turbulent, cold coastal current. It often veers offshore south of Penobscot Bay. Some EMCC waters continue moving offshore, and some return shoreward to form the western Maine Coastal Current (WMCC). Downstream, the WMCC waters separate into two branches near Cape Ann, one enters the Massachusetts Bay, and the other travels along the eastern flank of Stellwagen Bank. Further downstream, the Stellwagen Bank segment undergoes another bifurcation, one leaving the GOM at the Great South Channel, and the other traveling to and around Georges Bank. Another element in the coastal current system is the so-called Gulf of Maine Coastal Plume (GOMCP) (Keafer et al., 2005). This transport pathway is shoreward of both EMCC and WMCC. It carries fresh river water emanating from riverine sources along the coast all the way to the western GOM, making direct connection between eastern and western gulf, especially during the spring / early summer when river runoff is large. These “mean” circulation features mentioned above are in fact very dynamic. Depending upon the local and deep ocean forcing conditions, the intensity, and spatial and temporal structures of the coastal current may vary dramatically, and in turn significantly affect the transport and distribution of A. fundyense populations and other material properties.
Figure 1.
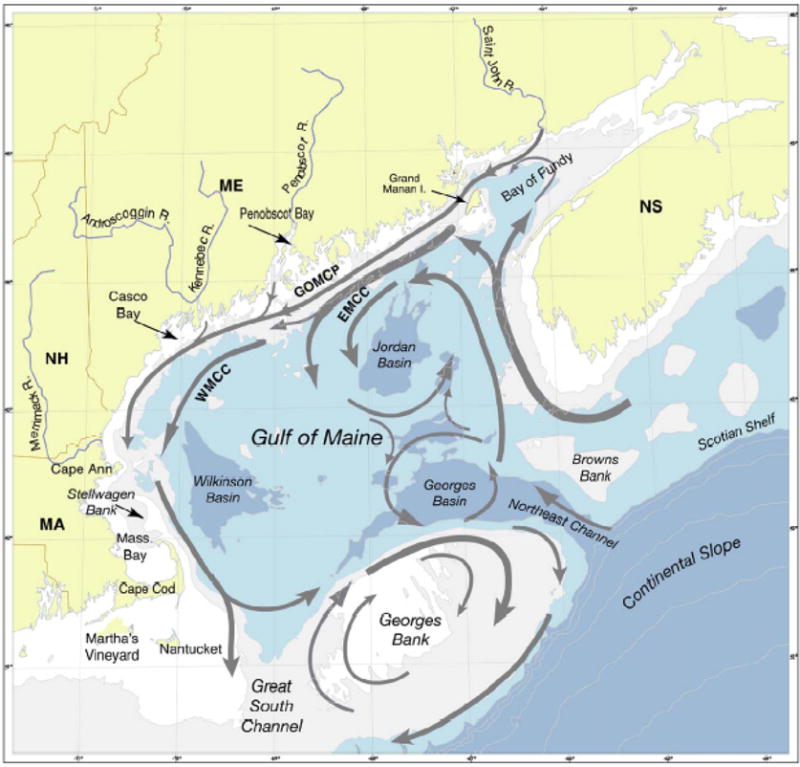
Gulf of Maine surface circulation (ME-Maine; MA-Massachusetts; BOF-Bay of Fundy; NS-Nova Scotia; EMCC-Eastern Maine Coastal Current; WMCC-Western Maine Coastal Current). Map adopted from Anderson et al., (2005a)
The extensive A. fundyense bloom that occurred in 2005 was considered as the worst in at least 33 years (Anderson et al., 2005a). The entire coastline from central Maine to Massachusetts, as well as 40,000 square kilometers of federal waters offshore were closed to shellfish harvesting. A fundamental question of both scientific and societal interest is why did this extensive bloom occur in 2005? Anderson et al. (2005a) presented some initial observations and suggested several biological and physical factors that may have contributed to the bloom. Our objective here is to explore physical factors pertinent to this bloom event in detail. We utilize in situ observations collected by a gulf-wide ship-survey and the regional coastal ocean observing network. The gulf hydrography, coastal circulation and its associated forcing conditions during this bloom event are further characterized with respect to their long-term mean conditions.
2. Data
2.1. Ship Observations
The gulf-wide ship survey was executed on the R/V Oceanus (Voyage OC412) between May 9th and 18th, 2005- a period coinciding with the initial phase of bloom development. During the 10-day field survey, a total of 133 hydrographic stations between the Massachusetts Bay and the Bay of Fundy were occupied (Figure 2). CTD casts were conducted at each station, providing vertical profiles of hydrographic properties including temperature, salinity, in-situ fluorescence, and light transmission. Water samples were also collected from the Niskin bottles on the CTD rosette for nutrient analysis and A. fundyense cell counts. In addition, shipboard Acoustic Doppler Current Profiler (ADCP) measurements were made underway, providing depth profiles of current speed and direction throughout the survey.
Figure 2.
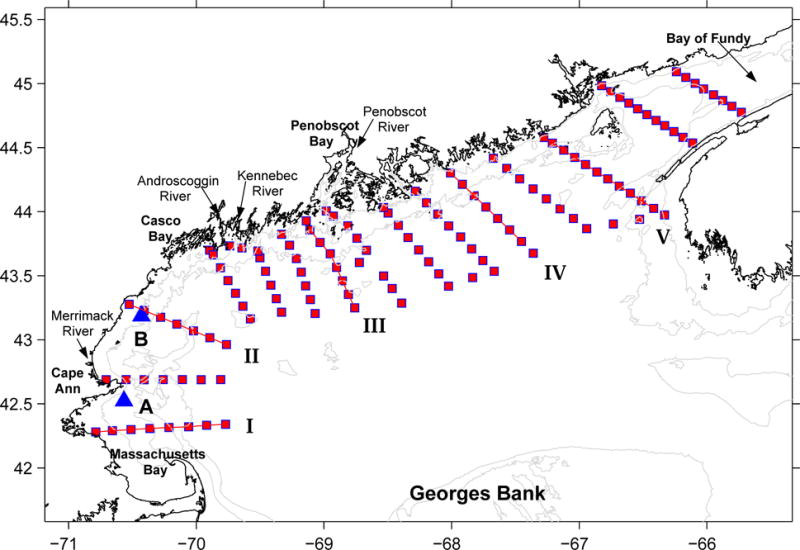
Locations of CTD stations of May 2005 Oceanus survey in the GOM. Also shown are the locations of 5 (I–V) transects where across-shelf temperature and salinity data are examined, and the geographic locations (indicated by triangles) of GoMOOS mooring A, and B.
2.2. Observations from Coastal Observing Network
Time series measurements of surface wind, sea level, and river runoff were obtained from National Oceanic and Atmospheric Administration (NOAA), National Ocean Service (NOS) coastal tidal gauges and United States Geological Survey (USGS) river gauges. Meteorological and hydrographic data measured by buoys of the Gulf of Maine Ocean Observing System (GoMOOS, http://www.gomoos.org/) were also collected throughout this bloom event. Surface wind fields in the GOM have been found to be spatially heterogeneous (e.g., Feng and Brown, 1998; He et al., 2005). As such, we also utilized NOAA NCEP surface flux reanalysis data (http://www.ncep.noaa.gov) to examine the temporal and spatial variability of wind fields in 2005.
3. Results
3.1. Ship Data
3.1.1. Hydrography
Temperature and salinity data from CTD casts provide a gulf-wide, synoptic view of the hydrographic conditions in May 2005 (Figure 3). Sea surface temperatures (SST) in the western GOM were several degrees warmer than in the eastern gulf, a common characteristic of SST in the GOM. This contrast is primarily due to stronger tidal mixing in the eastern gulf, which brings cold deep-water up to the surface. The salinity field indicates a continuous, alongshore band of low salinity water (< 31.5 psu), corresponding to the GOMCP concept proposed by Keafer et al. (2005).
Figure 3.
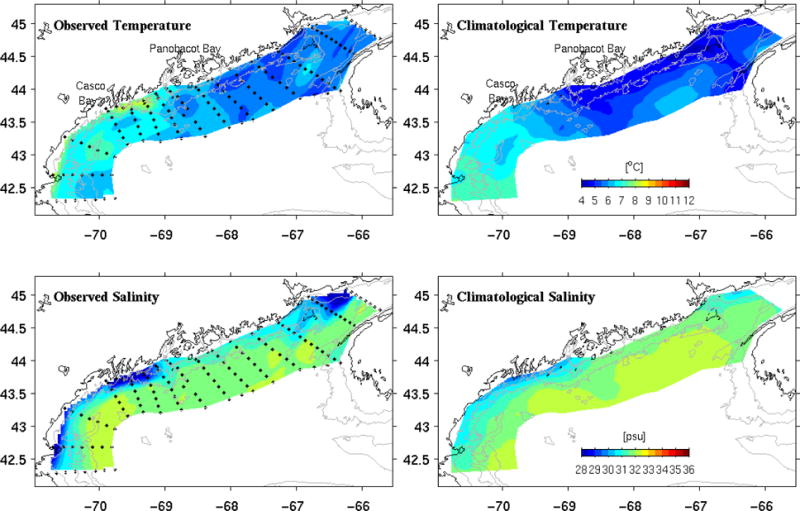
Comparisons of observed surface temperature (upper left) and salinity (lower left) and their climatological counterparts (upper and lower right).
Several unique features stand out when comparing these data with May climatological surface temperature and salinity fields (Lynch et al., 1996). First, surface water temperatures in May 2005 (Figure 3a) were generally warmer than its climatological mean condition (Figure 3b). A northwest-to-southeast temperature gradient from ca. 4°C to 6°C is apparent in the climatology off mid-coast Maine. This gradient appears to have been shifted from east of Casco Bay in the climatology to east of Penobscot Bay in the observed field, indicating that relatively warm water occupied the western GOM in May 2005. Second, coastal waters in May 2005 were fresher than the climatological mean salinity field by up to 4 psu along the coast and 1 psu in the gulf interior. Anderson et al. (2005a) shows all of the large local rivers (e.g., the Merrimack, Kennebec, Androscoggin, and Penobscot, see Figure 2) in the GOM had discharges 50% higher than their respective 80-year averages due to heavy snow melt and excessive precipitation in spring and summer 2005. The contrasts between observed salinity field (Figure 3c) and its climatological counterpart (Figure 3d) therefore reflect a consequence of excessive fresh water input. However, the salinity comparison shows the freshening was actually gulf-wide, including the coastal region southwest of Nova Scotia. Given the connectivity between coastal waters in this region and waters on the Scotian shelf and further upstream, the freshening must have been influenced by remote sources as well.
To explore subsurface water property differences, observed temperature and salinity fields were compared with their climatological counterparts across 5 transects in the gulf (Figure 4). Except transect I (the southernmost transect), observed across-shelf temperatures were all about 1–2 °C warmer than the climatology in the upper 100m. The mid-depth temperature minimum (“cold pool”) usually observed at 30–40 m was much less prominent and the thermal stratification significantly reduced in 2005. Associated with the weakened thermal stratification was the strengthened haline stratification. Nearshore salinity in 2005 was 2–4 psu fresher than its climatology due to excessive river runoff and the resultant larger river plumes. As indicated by the salinity transects maps, the river plumes extended to more than 50 m at depth. Both temperature and salinity determine the water density field. The mean buoyancy frequency for the gulf in 2005 is 5.6 ×10⁻⁵ s−2, substantially higher than the climatological value 4.1×10⁻⁵ s−2, suggesting the gulf waters in May 2005 were over all more buoyant than the normal condition.
Figure 4.
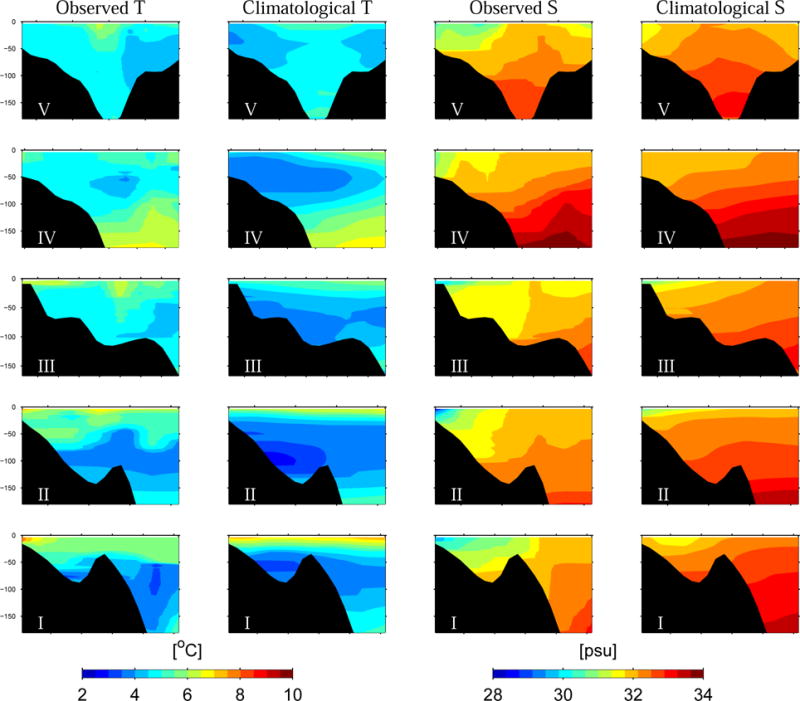
Comparison of observed and climatological temperature (left 2 columns), and salinity (right 2 columns) fields along 5 across-shelf transects (Fig 1) in the GOM.
These temperature and salinity observations in May 2005 also document substantial departures from climatological water mass characteristics. Based on the definitions of Brown and Irish (1993), the Maine Intermediate Water (MIW) is classified as the water having 31.75 to 33.25 psu in salinity range and 1.5 to 6 °C in temperature range; while the Maine Surface Water (MSW) is referred to waters fresher than 31.75 psu. As such, the comparison of T-S diagrams between observations and the climatology (Figure 5) reveals that much more MSW in fact resided in the GOM in May 2005. We recognize that part of the reason for such apparent increase in MSW may because the nearshore regions, especially estuaries and freshwater plumes, are not well represented in the climatology (Lynch et al., 1997).
Figure 5.
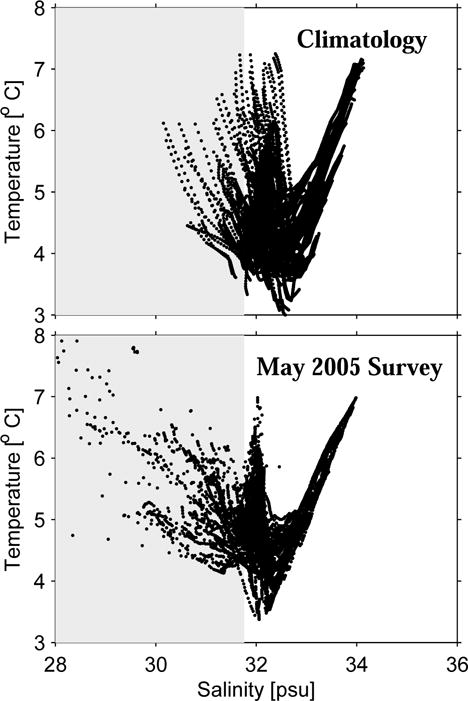
Comparison of climatological T-S diagram (upper) and its observed counterpart (lower). Shaded areas indicate the range where the Maine Surface water resides based on Brown and Irish (1993).
3.1.2. Geostrophic Currents
Temperature, salinity and depth data measured by CTD were used to compute the dynamic height (DH) field (Figure 6a). The geostrophic calculation assuming a level of no-motion at the bottom (Csanady, 1979) provides a means to assess the synoptic baroclinic coastal circulation. Because the gulf water was relatively warmer and fresher near the coast in 2005, the computed DH is larger nearshore than it is further offshore. Some local DH maxima are associated with large fresh water runoff, and are clearly seen in the vicinity of major rivers (i.e., St. Johns, Kennebec & Androscoggin, and Merrimack).
Figure 6.
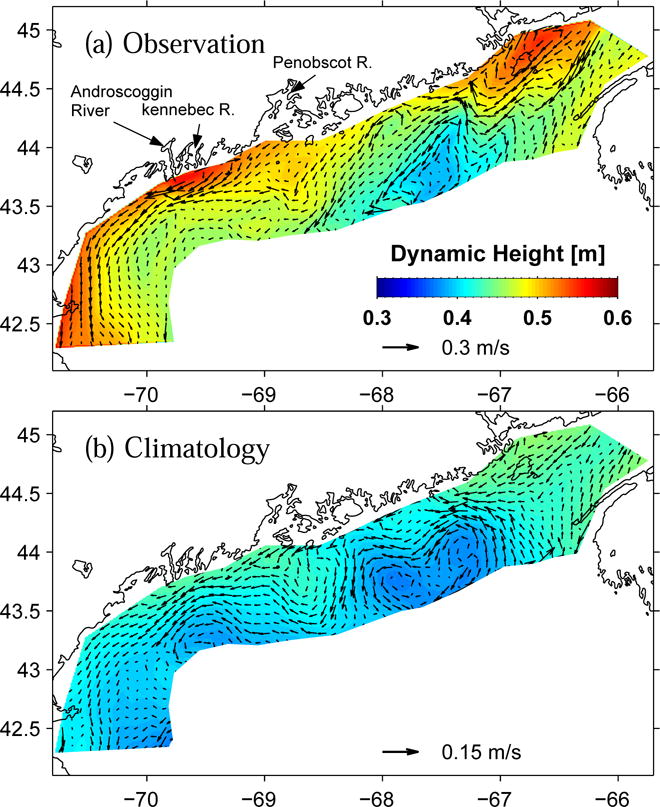
Surface dynamic height and its associated geostrophic current field computed with CTD data collected in Oceanus survey (a) and their climatological counterparties (b). Note the change of vector scale.
While there is an uncertainty in the assumption of the level of no motion, the resulting geostrophic currents (GC) successfully capture many known GOM circulation features in this season, including the inflow from Scotia shelf, the EMCC, its offshore turning off Penobscot Bay, and the WMCC. Differences are evident when comparing DH and GC in May 2005 with their climatological counterparts (Figure 6b). The DH near the coast is more than 0.10m higher in 2005 than the mean condition. The resulting stronger than normal across-shelf pressure gradient consequently produces a GC that is 2 times larger in 2005 than the climatological GC (note the change of vector scale in the figure).
3.1.3. Ship-board ADCP Currents
Ship-board Acoustic Doppler Current Profiler (ADCP) data provide more complete measurements of coastal current in that both baroclinic and barotropic components of velocity are captured. Depth-averaged along-track ADCP currents are noisy in this region (Figure 7a) due to the presence of strong, time-dependent tidal currents, particularly in the eastern GOM. To recover the subtidal circulation that dominates material property transport, we first constructed the barotropic tidal current at each time and location where the ADCP current was sampled in the survey. For such purpose, we applied the harmonic tidal prediction method of Pawlowicz et al. (2002) in conjunction with a North Atlantic tidal harmonic constant database generated by the ADCIRC model (Luettich et al., 1992). The resulting barotropic tidal currents were then subtracted from the depth-averaged ADCP measurements to produce the depth-averaged synoptic sub-tidal circulation field occurred during the survey period (Figure 7b).
Figure 7.
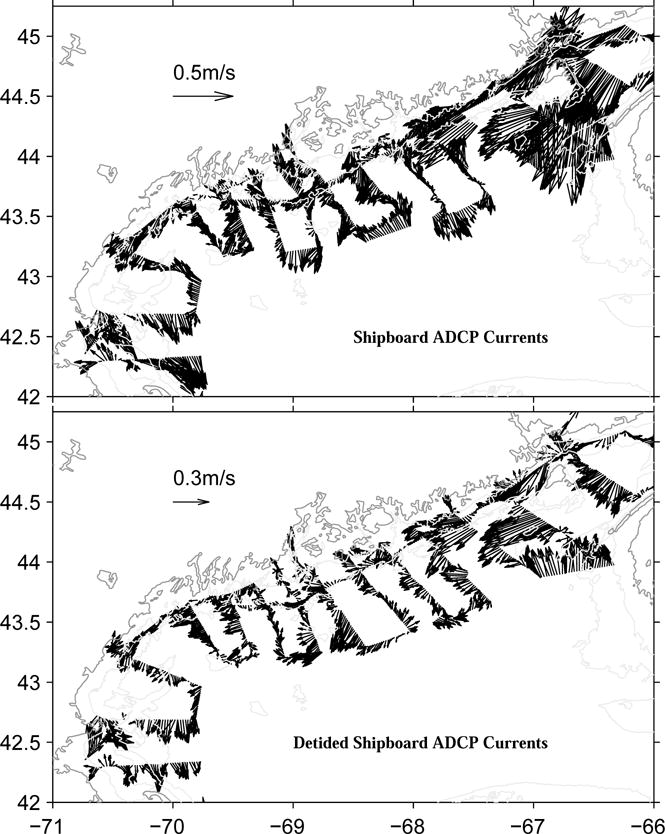
Depth-averaged shipboard ADCP current field (upper panel) and its de-tided (subtidal) rendition (lower panel). Note the change of vector scale.
While some tidal residuals are still present due to inaccurate tidal solutions in some local areas, the spatial structure of the de-tided (sub-tidal) current field is consistent with the GC calculation shown in Figure 6a. With additional contribution from barotropic currents, which are driven by both local wind and large-scale pressure field, the magnitude of sub-tidal currents exceeds the GC by another 30–40%. Stronger than normal coastal currents in May 2005 therefore provided much more vigorous transport than usual for delivering A. fundyense population and any other material properties in the gulf.
3.2. Mooring Data
To put these synoptic observations in the context of longer temporal scale, we next examine meteorological and oceanic data collected by moorings of the Gulf of Maine Ocean Observing System [GoMOOS] (http://gomoos.org). Most of GoMOOS coastal moorings cover the period from July 2001 to present, thereby providing highly valuable dataset for evaluating the variability of GOM coastal circulation and hydrography on time scales from hours to years.
3.2.1. Surface Current
Surface currents (1-m) were examined from south to north at GoMOOS mooring A (at 65m isobath), B (at 62m isobath), C (at 46m isobath), E (at 100m isobath), and I (at 100m isobath). At each mooring location, hourly u and v components of the surface velocity data were 36-hour low pass filtered to remove tides, and then averaged to form a monthly mean velocity vector for May 2005 (Figure 8). To reveal how these surface velocity vectors vary with respect to the “mean” May condition, surface velocity data in May 2002, 2003, and 2004 were processed in the same manner, and then averaged into the “long-term mean” May surface vectors. In addition, the long-term mean velocity hodograph ellipses were also computed to provide principal variances information for each station.
Figure 8.
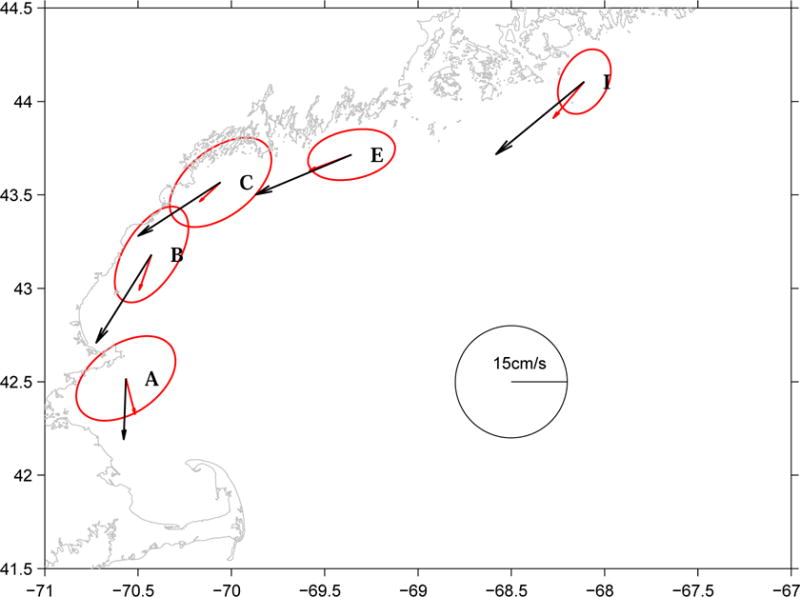
Comparison of coastal surface currents between May 2005 monthly means (black vectors) and long-term May monthly means averaged over 2002–2004 at moorings A, B, C, E, and I. Also shown are the long-term velocity hodograph ellipses for principal variances at each station. Data are obtained from GoMOOS moored buoy program (http://gyre.umeoce.maine.edu/GoMoos).
Comparisons of surface velocity vectors between May 2005 and the “mean” May conditions highlight dramatic interannual difference in GOM circulation. Consistent with the geostrophic calculation and ship board ADCP data shown above, the speed of the surface circulation in May 2005 was at least 2 times larger than the long term mean and significantly exceeded the normal range of principal variance. This implies the transport of material properties in the west GOM from Penobscot Bay to Massachusetts Bay would take only 1–2 weeks versus 2–4 weeks in the normal condition. Moreover, mean velocity vectors in May 2005 also had more onshore components than the normal condition, which would enhance shoreward transport, and nearshore aggregation of material properties, such as A. fundyense.
3.2.2. Surface Salinity
Given the importance of salinity in determining GOM dynamic height/pressure field (Figure 6a), we now examine the temporal evolution of surface salinity with 5-year time series collected by conductivity sensors on GoMOOS moorings A and B.
For each time series, seasonal cycle was first constructed by fitting the raw salinity observations to a mean and annual harmonics:
where t is time in days, ω=2π/365 day−1, and a and b are coefficients of the harmonic fit. The resulting Sseasonal was then subtracted from the original salinity time series to form salinity anomaly at each station, i.e. Sanomaly = Sraw − Sseasonal. A 30-day low pass filter was then applied to Sanormaly to remove high-frequency variability. The resulting salinity anomaly time series are thus suitable for studying the underlying inter-annual variability (Figure 9).
Figure 9.
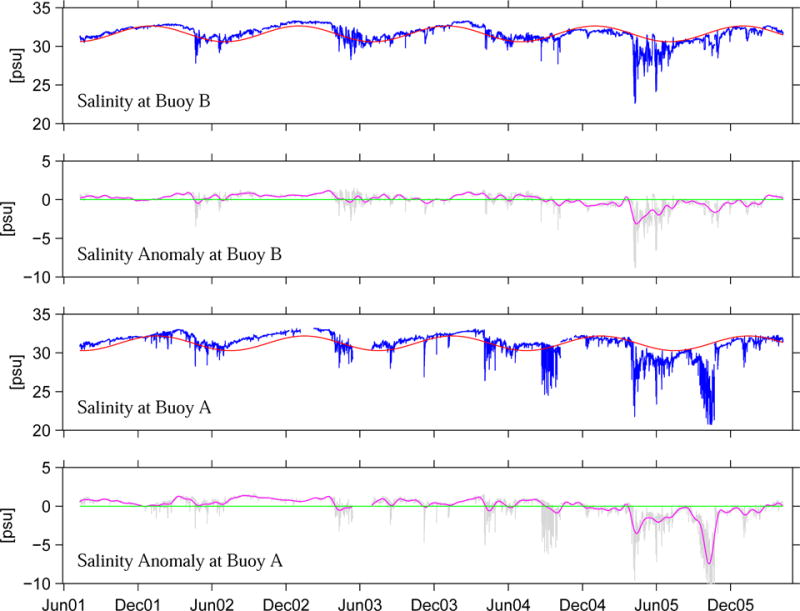
Time series of surface salinity measured by GoMOOS moorings for the period from June 2001 to June 2005. For each time series, a seasonal cycle Sseasonal is fitted and superposed with raw hourly data in panels 1 and 3. The salinity residual (Sraw-Sseasonal) and its 30-day low-passed filtered rendition are shown in panel 2 and 4, respectively for moorings B, and A.
At Mooring B, the low-pass filtered salinity anomaly from July 2001 to December 2004 had rather small (<1 psu) departures from the seasonal cycle, implying the balance between fresh water inputs from local and upstream river runoff, plus evaporation-precipitation (E-P), and the salt content of the ambient coastal water was in its typical range during this 3-year time period. The following period from January, 2005 to March, 2006 was rather different, showing a 15-month long negative salinity anomaly. Such freshening trend reached its peak (−3 psu) in April–May 2005 and continued, although with reduced magnitude until the following March.
Similar conditions are also observed at Mooring A. At this site, the confluence of fresh water originated from both local and upstream river sources produced even larger salinity anomaly. Two peaks are evident, one in April–May 2005 as at mooring B, and the other in October 2005, which reached −8 psu. The former freshening peak was caused by large river runoff due to snow melt and spring precipitation, as documented by Anderson et al. (2005b). The latter event was related to another strong river runoff event in the western GOM due to the record rainfall in October–November 2005. In fact USGS record shows October 2005 is the wettest October, and the second wettest month on record for the western GOM. As an example, Figure 10 shows the discharge time series of Kennebec River (see Figure 1 for its location) in 2004 and 2005, indicating its river inflow in 2005 was about 3-fold more than that in 2004. Such anomalously large riverine input will be the subject of a model sensitivity experiment in Part 2 of our study.
Figure 10.
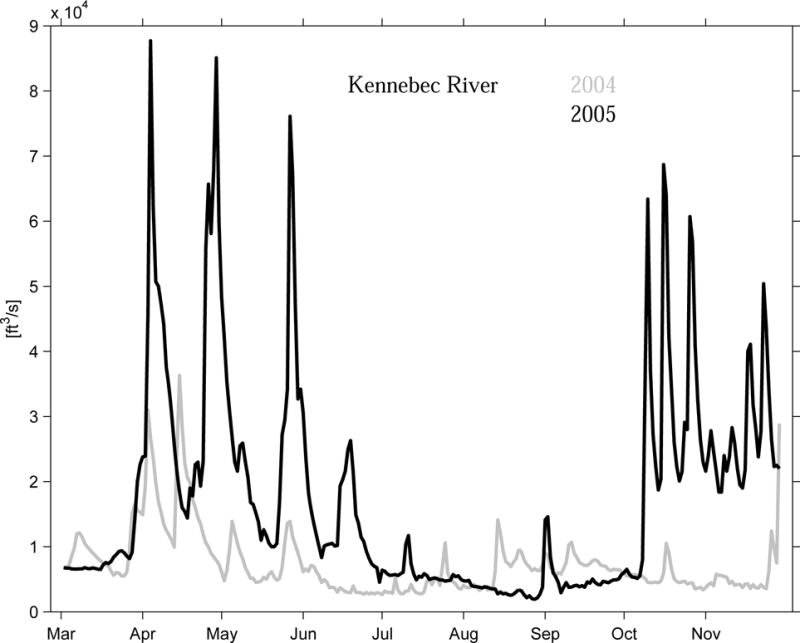
Time series of Kennebec River discharge during March to November in 2004 and 2005.
3.2.3. Surface Wind
As most of GoMOOS coastal buoys are equipped with meteorological sensors that measure wind speed and direction, it is possible to examine surface wind time series and its interannual variability as well. Using GoMOOS mooring B in the western GOM for example, comparison of surface wind time series between May 2004 (a “typical” year, see 3.3 below) and May 2005 show wind characteristics were completely different (Figure 11): May 2004 was characterized with more southerly to southwesterly winds, whereas winds in May 2005 were more northeasterly due to successive northeaster storms.
Figure 11.
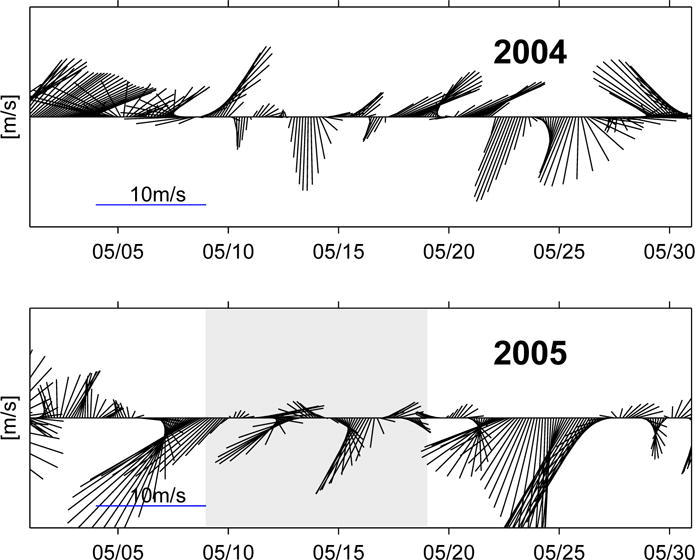
Surface wind time series measured by GoMOOS mooring B in May 2004 (upper panel) and May 2005 (lower panel). The shaded area in the lower panel indicates the time period when the Oceanus survey was performed.
To first order, the rate of water parcel displacement can be computed simply as the Ekman transport divided by the Ekman layer depth h (assumed to be comparable with the local water depth at mooring B), then the corresponding displacement is:
where t is the duration of wind event, τs is the surface wind stress, ρ is water density, and f is Coriolis parameter. Based on this, we used GoMOOS mooring B surface wind time series in May 2004 and May 2005 to estimate their corresponding water parcel net displacement over a month period (i.e., progressive vector diagram [PVD] calculation). We found upwelling favorable May 2004 winds would cause 35 km net offshore displacement, whereas downwelling favorable winds in May 2005 would result in 80 km net onshore displacement. Although spatial heterogeneity precludes strict interpretation of the PVD net displacement calculation, these results suggest the winds in May 2005 would cause much stronger on-shore transport of an offshore bloom, enhancing along coast aggregation of the A. fundyense population.
3.3. Surface Wind and Heat Flux Reanalysis
To put the aforementioned surface wind characteristics into a spatial context, temporally and spatially continuous wind fields were obtained from NOAA NCEP reanalysis. We constructed the GOM wind climatology for May by averaging wind fields over 58 years (from 1948 to 2005). Similarly, monthly mean wind fields for May 2004 and May 2005 were also produced respectively by averaging wind data over each of those two months (Figure 12). Comparisons of these means reveal the southwesterly flow in 2004 was typical with respect to the climatology. In contrast, the mean wind field in May 2005 was predominantly from the northeast, causing downwelling-favorable conditions over the entire gulf.
Figure 12.
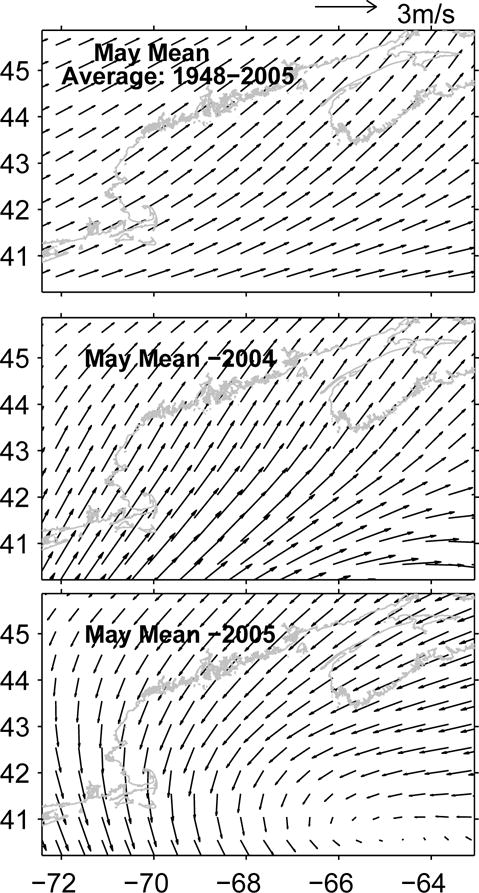
Comparisons of May monthly mean wind fields among climatology (upper panel), 2004 (middle panel), and 2005 (lower panel). Data are taken from NOAA NCEP reanalysis (http://www.cdc.noaa.gov/cdc/reanalysis).
A similar analysis was applied to NCEP net surface heat flux reanalysis and its four constituents: shortwave radiation, longwave radiation, sensible heat, and latent heat. Because the ocean responds to surface heat flux variability more slowly (on the order of month) than it does to surface wind variability (pendulum day), we also included heat flux data in the proceeding month (i.e., April) in the comparison. That is, for each heat flux component, we computed the difference between its April–May mean in 2005 and its climatological April–May mean obtained by averaging over 58 years form 1948–2005 (Figure 13). We found the short wave radiation in April–May 2005 was less than its climatological counterpart by 5–10 w/m2 in the western GOM and by 15–20 w/m2 in the eastern gulf. In contrast, the long wave radiation, sensible heat and latent heat in 2005 all exceeded their climatological counterparts by 10–15 w/m2 over almost the entire gulf. Consequently, the net heat flux in April–May 2005 was ~5–10 w/m2 larger than the climatological net heat flux. The largest difference is located in the coast region between Casco Bay and Grand Manan Island (see Figure 1), coincident with the south-to-north position shift of the surface temperature front (see Figure 3).
Figure 13.
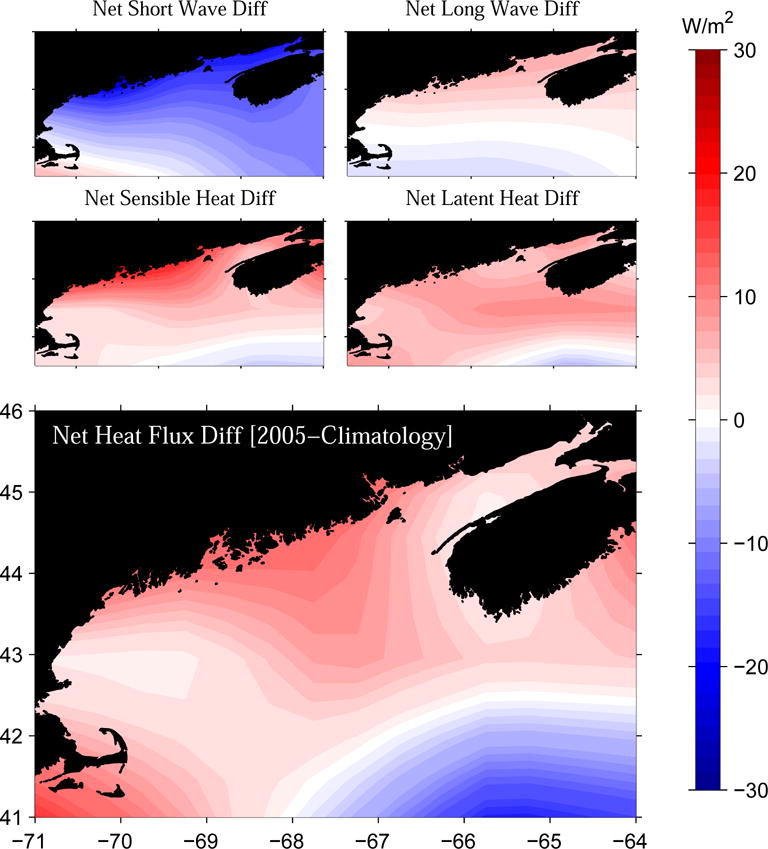
Differences between April–May, 2005 mean heat fluxes and climatological April–May mean (58-year average) heat fluxes.
Assuming a one-dimensional temperature balance, i.e., ∂T/∂t = Q/(ρCpH), where Q is net surface heat flux, ρ water density, Cp the water specific heat, and H and local water depth, 5–10 w/m2 more heat flux would increase temperature of 50m water column approximately by ~1 degree over one month period. This estimation is consistent with hydrographic observations that show surface water temperatures in May 2005 were generally warmer than the climatological condition by 1°C (i.e., Figure 3), suggesting anomalous heating was likely the reason for warmer water temperatures in 2005.
4. Discussion
The anomalous hydrographic conditions in May 2005 may have contributed to the historic A. fundyense bloom in several ways. First, Gulf temperatures were warmer than the average due to enhanced surface heating. At the same time, coastal waters were fresher, due to excessive river runoff and precipitation in 2005. The freshening trend started in January 2005, and reached a peak low salinity in April–May (at Mooring A, another low salinity peak was observed in October 2005). Hydrographic survey data indicated this freshening event was in fact gulf-wide, suggesting inflow waters from the Scotian shelf were also fresher. Both anomalous temperature and salinity conditions were advantageous for A. fundyense, as biologically the cells’ germination and growth processes favor warm and fresh ambient condition (McGillicuddy et al., 2005; Stock et al., 2005). Taking the A. fundyense growth model in Stock et al. (2005),
where G(T,S) is the A. fundyense growth rate, T and S are ambient temperature and salinity, and μ is the light and nutrient saturation coefficient, a 1 degree increase in temperature and 5 psu decrease in salinity would cause approximate 30% increase in the growth term G under the same light and nutrient conditions.
In addition, warmer and fresher coastal waters supported larger dynamic pressure surface along the coast, and subsequently stronger than normal coastal current that facilitates along-coast transport of A. fundyense (Franks and Anderson, 1992). Both geostrophic current calculations and shipboard ADCP current measurements indicated coastal current in summer 2005 were at least 2 times stronger than the normal mean current. These observations were further confirmed by GoMOOS mooring data with respect to the means of long-term current records. Stronger alongshore transport could allow material properties be delivered from the eastern GOM to western GOM much more quickly, therefore may have affected the timing of A. fundyense bloom in 2005.
Surface wind fields were also anomalous in May 2005. In contrast to the typical upwelling-favorable mean condition, winds in May 2005 were downwelling favorable as a result of successive northeaster storms. Such anomalous wind forcing facilitated alongshore and onshore transport of cell population. As a result, offshore A. fundyense populations could be effectively transported shoreward and cause large accumulation along the coast. One possible wind forcing scenario is that more upstream and offshore cell populations were steered into Massachusetts Bay rather than flowing along the eastern flank of Stellwagen bank. This could explain why Massachusetts Bay received such an extensive exposure of the A. fundyense bloom in 2005.
5. Conclusions
The combined effect of coastal hydrography, circulation and forcing conditions has favored the A. fundyense bloom in spring-summer 2005. In situ observations, long-term time series of GoMOOS mooring data and NCEP reanalysis fields all quantify significant variability in the GOM coastal ocean environment during this time period. Many details of the bloom dynamics still remain unanswered with only physical oceanographic data. For instance, what is the relative importance of the physical factors enumerated above in controlling and regulating the bloom? How do biological and physical factors interplay to determine the timing and ultimate distribution of the bloom? Answering these questions necessitates the use of a coupled hydrodynamic and A. fundyense population dynamic model that may fill the temporal and spatial gaps of in-situ observations. Model realizations of the physical and biological states will also be valuable to reveal detailed mechanisms controlling this complex coupled system. We will report the coupled model simulation and model analyses in Part 2 of this study.
Acknowledgments
The authors thank technical and logistical support provided by B. Keafer, K. Norton, A. Molitor, O. Kosnyreva, V. Kosnyreva, and L. Anderson. Thanks to the captain, crews and support personnel of the R/V Oceanus. We are grateful to NOAA NOS, NOAA NCEP, and GoMOOS for providing data product online. Research support was provided through the Woods Hole Center for Oceans and Human Health, National Science Foundation (NSF) Grant OCE-0430723 and National Institute of Environmental Health Science (NIEHS) Grant 1-P50-ES012742-01, ECOHAB program through NSF Grant OCE-9808173 and NOAA Grant NA96OP0099, and GOMTOX program through NOAA NA06NOS4780245.
References
- Anderson DM, et al. The ecology and oceanography of toxic Alexandrium fundyense blooms in the Gulf of Maine. Special issue of Deep-Sea Research, Part II. 2005;52:19–21. [Google Scholar]
- Anderson DM, Keafer BA, McGillicuddy DJ, Mickelson MJ, Keay KE, Libby PS, Manning JP, Mayo CA, Wittaker DK, Hickey JM, He R, Lynch DR, Smith KW. Initial observation of the 2005 Alexandrium fundyense bloom in he southern New England: general patterns and mechanisms. Deep Sea Research II. 2005a;52:2856–2876. [Google Scholar]
- Bigelow HB. Physical Oceanography of the Gulf of Maine. Fisheries Bulletin. 1927;40:511–1027. [Google Scholar]
- Brooks DA. Vernal circulation in the Gulf of Maine. Journal of Geophysical Research. 1985;90:4687–4705. [Google Scholar]
- Brown WS, Irish JD. The annual variation of the mass structure in the Gulf of Maine: 1986–1987. Journal of Marine Research. 1993;51:53–107. [Google Scholar]
- Franks PJS, Anderson DM. Alongshore transport of a toxic phytoplankton bloom in a buoyancy current: Alexandrium tamarense in the Gulf of Maine. Marine Biology. 1992;112:153–164. [Google Scholar]
- He R, McGillicuddy DJ, Lynch DR, Smith KW, Stock CA, Manning JP. Data assimilative hindcast of the Gulf of Maine coastal circulation. Journal of Geophysical Research. 2005;110:C10011. doi: 10.1029/2004JC002807. [DOI] [Google Scholar]
- Keafer BA, Churchill JH, McGillicuddy DJ, Anderson DM. Bloom development and transport of toxic Alexandrium fundyense population within a coastal plume in the Gulf of Maine. Deep Sea Research II. 2005;52:2674–2697. [Google Scholar]
- Luettich RAJ, Westerink J, Scheffner NW. ADCIRC: An advanced three-dimensional circulation model for shelves, coasts and estuaries. U.S. Army Engineer Waterways Experiment Station; 1992. [Google Scholar]
- Lynch DR, Ip JTC, Naimie CE, Werner FE. Comprehensive coastal circulation model with application to the Gulf of Maine. Continental Shelf Research. 1996;16(7):875–906. [Google Scholar]
- Lynch DR, Holboke MJ, Maimie CE. The Maine coastal current: spring climatological circulation. Continental Shelf Research. 1997;17:605–639. [Google Scholar]
- McGillicuddy DJ, Signell RP, Stock CA, Keafer BA, Keller MD, Hetland RD, Anderson DM. A mechanism for offshore initiation of harmful algal blooms in the coastal Gulf of Maine. Journal of Plankton Research. 2003;25(9):1131–1138. [Google Scholar]
- Pawlowicz R, Beardsley R, Lentz S. Classical Tidal Harmonic Analysis including Error Estimates in MATLAB using T_Tide. Computers and GeoSciences. 2002;28:929–937. [Google Scholar]
- Pettigrew NR, Townsend DW, Xue H, Wallinga JP, Brickley PJ, Hetland RD. Observations of the Eastern Maine coastal current and its offshore extensions in 1994. Journal of Geophysical Research. 1998;103(30):623–639. [Google Scholar]


