

Abstract
Fluorescence microscopy reveals that the contents of many (membrane-free) nuclear bodies exchange rapidly with the soluble pool while the underlying structure persists; such observations await a satisfactory biophysical explanation. To shed light on this, we perform large-scale Brownian dynamics simulations of a chromatin fiber interacting with an ensemble of (multivalent) DNA-binding proteins able to switch between an “on” (binding) and an “off” (nonbinding) state. This system provides a model for any DNA-binding protein that can be posttranslationally modified to change its affinity for DNA (e.g., through phosphorylation). Protein switching is a nonequilibrium process, and it leads to the formation of clusters of self-limiting size, where individual proteins in a cluster exchange with the soluble pool with kinetics similar to those seen in photobleaching experiments. This behavior contrasts sharply with that exhibited by nonswitching proteins, which are permanently in the on-state; when these bind to DNA nonspecifically, they form clusters that grow indefinitely in size. To explain these findings, we propose a mean-field theory from which we obtain a scaling relation between the typical cluster size and the protein switching rate. Protein switching also reshapes intrachromatin contacts to give networks resembling those seen in topologically associating domains, as switching markedly favors local (short-range) contacts over distant ones. Our results point to posttranslational modification of chromatin-bridging proteins as a generic mechanism driving the self-assembly of highly dynamic, nonequilibrium, protein clusters with the properties of nuclear bodies.
Introduction
In all living organisms, from bacteria to man, DNA and chromatin are invariably associated with binding proteins, which organize their structure (1, 2, 3). Many of these architectural proteins are molecular bridges that can bind at two or more distinct DNA sites to form loops. For example, bacterial DNA is looped and compacted by the histonelike protein H-NS, which has two distinct DNA-binding domains (4). In eukaryotes, complexes of transcription factors and RNA polymerases stabilize enhancer-promoter loops (5, 6, 7, 8), while HP1 (9), histone H1 (10), and the polycomb-repressor complex PRC1/2 (11, 12) organize inactive chromatin. Proteins also bind to specific DNA sequences to form larger structures, like nucleoli and the histone-locus, or Cajal and promyeloleukemia bodies (13, 14, 15, 16, 17, 18). The selective binding of molecular bridges to active and inactive regions of chromatin has also been highlighted as one possible mechanism underlying the formation of topologically associated domains (TADs)—regions rich in local DNA interactions (6, 8, 19).
From a biophysical perspective, a system made up of DNA and DNA-binding proteins exhibits many kinds of interesting and seemingly counterintuitive behavior, such as the clustering of proteins in the absence of any attractive interaction between them. This process is driven by the “bridging-induced attraction” (20). In conjunction with the specific patterning of binding sites found in human chromosomes in vivo, this attraction can drive folding into TADs in the appropriate places on the chromosome (8).
In the simple case where there is only a nonspecific DNA-protein interaction (i.e., proteins can bind to any point on DNA), bridging-induced clustering can be understood as being due to a thermodynamic feedback loop: binding of bridges to multiple DNA segments causes an increase in local DNA concentration which, in turn, recruits further DNA-binding proteins, and further iterations then sustain the positive feedback. Subsequently, the ensuing clusters coarsen, and eventually phase-separate into one macroscopic cluster of DNA-bound bridges in equilibrium with a (diluted) pool of unbound proteins (21, 22). In the more complex case with specific DNA-binding interactions, clustering is associated with the formation of DNA loops. Looped structures incur an entropic cost that increases superlinearly with the number of loops, and can stop the growth of a cluster beyond a critical size (8, 23, 24, 25, 26). Such specific binding drives the formation of promoter-enhancer loops (2); however there are several proteins that interact mainly nonspecifically with large regions of the genome, such as histone H1 and other heterochromatin-associated proteins (2). For this latter class of proteins, the abundance of binding sites in the nucleus would lead to clusters that coarsen progressively. However, this indefinite growth is not observed: we suggest that reversible posttranslational protein modifications may be the reason underlying the arrested coarsening.
Specifically, here we consider a biochemical reaction that can modify DNA-binding proteins. In our model, these proteins continuously switch between an active and an inactive state at rate α. While active, the proteins can thermodynamically bind to, and unbind from, DNA; but when inactive, proteins do not have any affinity for DNA. Such a reaction can arise in several biologically relevant scenarios. For instance, a complex of transcription factors and an RNA polymerase might stabilize a promoter-enhancer loop; upon transcription termination, the complex could dissociate and the loop disappear (2, 3). Alternatively, phosphorylation, or other posttranslational modifications of transcription factors (27), may affect their affinity for chromatin, as might a conformational change in a protein or the reversible addition of a subunit to a protein complex, which might be driven by ATP hydrolysis.
In this work, we show that accounting for this nonequilibrium posttranslational mechanism strikingly broadens the range of physical behavior displayed by the chromatin/protein ensemble. In particular, we find that including switching proteins, which interact nonspecifically with a chromatin fiber, leads to qualitatively and quantitatively different results compared to nonswitching proteins. We observe that the continuous changing of state due to protein modification leads to an arrest of the coarsening of the clusters triggered by the bridging-induced attraction. Importantly, the size of the resulting clusters can be tuned by altering the switching rate α and we propose a mean-field calculation that supports this finding. Furthermore, we show that if proteins bind both specifically and nonspecifically, switching results in the formation of highly dynamic clusters, which are qualitatively different from those formed by nonswitching proteins. In the former case, proteins in the cluster exchange with the soluble pool, while the general shape of the cluster persists. These dynamic clusters recover quickly after simulated photobleaching, hence they closely resemble some of the nuclear bodies of eukaryotic cells. Finally, we consider a simplified model for the formation of TADs in chromosomes, and show that protein switching leaves the location of the domains unaltered, but strongly disfavors long-range inter-TAD interactions. All these findings point to an important and generic role of reversible protein modification in chromatin and nuclear organization.
Materials and Methods
Details on the Brownian dynamics simulation method we use (including parameter values) and on the continuum mean field model (derivation, linear stability analysis, and amplitude equation) are given in the Supporting Material, where we also show additional results and figures that are discussed here in the main text.
Results and Discussion
Protein switching arrests coarsening of chromatin bridges that bind nonspecifically
We perform Brownian dynamics simulations of a flexible chromatin fiber modeled as a bead-and-spring polymer (thickness 30 nm, persistence length 90 nm) interacting nonspecifically with either nonswitching or switching proteins. These proteins can bind to the fiber at more than one location (in our case through a Lennard-Jones potential; see the Supporting Material for details of the force field, and Fig. 1, A and B, for a schematic). For simplicity, we assume that the proteins are the same size as the chromatin beads (a realistic assumption, as each is likely to be a protein complex). We also assume proteins stochastically switch between on- and off-states at an equal rate, α. (Note: relaxation of either of these assumptions does not qualitatively alter our results.)
Figure 1.

Protein switching arrests cluster coarsening. In (A)–(D), active and inactive proteins are colored red and gray, respectively; chromatin is represented by strings of blue beads. (A) Schematic of the model (Brownian dynamics simulations). (i) Proteins (single spheres) switch between red and gray states at rate α. (ii) Only proteins in the red state can bind chromatin. (iii) Red and gray beads interact via steric repulsion only. (iv) Proteins can bind to ≥2 sites to create molecular bridges and loops. (B) Snapshots illustrating protein binding/unbinding. Bound active proteins have clustered and compacted chromatin. Bound active proteins 1 and 2 (gray circles) switch and become inactive and dissociate (gray arrows); inactive proteins a–c in the soluble pool (red circles) are activated and may bind to the cluster (red arrows). (C) Snapshots taken (i) 104 and (ii) 2 × 10⁴ simulation units after equilibration. The simulation involved a 5000-bead fiber (corresponding to 15 Mbp) and N = 4000 nonswitchable proteins, of which half are able to bind. (D) As in (C), but for N = 4000 switchable proteins (α = 0.0003 inverse Brownian times). (E) Average cluster size as a function of time. Error bars denote standard deviations of the mean. (i) Nonswitching proteins. (ii) Switching proteins; from top to bottom, α equals 0.0001, 0.0002, 0.0003, 0.0004, and 0.0005 inverse Brownian times (or α−1 ≃ 10–60 s in real units). To see this figure in color, go online.
First, we consider the case of nonswitching proteins (i.e., we set α = 0; Fig. 1 C). This case was previously studied in the literature (6, 20, 21, 28), and it was shown to lead to polymer collapse (6, 20, 21, 28) and clustering of proteins (20, 21), depending on the protein concentration. For the concentrations used here, clusters coarsen and grow at the expense of smaller aggregates. During the early stages, this resembles the Ostwald ripening characteristic of liquid-gas phase separation; later on, we also observe coalescence of smaller clusters into larger ones (Movie S1). The average cluster size—measured as the number of bound proteins per cluster—increases with time with no sign of saturation until all clusters merge into one (Fig. 1 Cii; Movie S1). For early times, cluster size (which is also proportional to its volume) increases approximately linearly with time, as would be expected for Ostwald ripening in density-conserving model B (29). For later times, cluster growth is much slower, with a sublinear exponent (close to 0.25 for our parameters; Fig. 1 Ei). This slowing is due to the underlying polymer dynamics—as in blob formation during the collapse of a homopolymer, which is also slower than simple model B kinetics (30).
The dynamics with protein switching (i.e., α > 0), is remarkably different: coarsening is completely arrested, and the system achieves a microphase-separated state in which clusters have a well-defined average size (Fig. 1 D; Movie S2) that decreases with α (Fig. 1 Eii). The arrested phase separation can be understood intuitively as follows: on the one hand, thermodynamics dictates that the system should try to minimize interfaces, and this leads to coarsening, initially via Ostwald ripening, given the growth laws in Fig. 1 Ei; on the other hand, protein switching is a Poisson process, so active proteins switch off at a constant rate α, and leave the cluster. (Note: this is not the case for equilibrium proteins that can only unbind thermodynamically; not only is the unbinding rate slower, but such proteins are also highly likely to rebind to a nearby site before ever leaving a cluster.) Then, active proteins only have a timescale of the order α−1 in which to form a cluster before a significant proportion of proteins in that cluster inactivate. Hence, phase separation is arrested.
A mean field theory quantitatively explains the arrest of coarsening, and predicts average cluster size
To understand more quantitatively how protein switching arrests coarsening, we consider a simplified mean field theory that follows the time evolution of the chromatin density , and the active protein density . Our equations describe the binding of the proteins to the chromatin together with the diffusion of all components, and they read as follows:
| (1) |
These equations can be formally derived starting from a suitable underlying free energy density, and adding protein modification as a reaction term—the details are discussed in the Supporting Material. In the expressions in Eq. 1, and are the chromatin and protein mobility, respectively, so that and represent effective diffusion coefficients, while χ is the coefficient describing bridging between active proteins and chromatin. Further, g captures steric repulsion in the chromatin fiber, k accounts for effective surface tension effects, and finally the last term in the equation for Φ models the biochemical reaction, where proteins switch from binding to nonbinding, and back, at a rate α. For α = 0, the expressions in Eq. 1 ensure conservation of the global density of both chromatin and proteins—in other words, this is an example of generalized model B dynamics (17, 29).
To identify the key parameters in our system, we now choose dimensionless time and space units and and redefine Φ as . In these units, our equations become
| (2) |
| (3) |
so that the whole parameter space is spanned by the four dimensionless numbers , , , and .
One solution of Eqs. 2 and 3 is given by the uniform phase , which is stable in the absence of bridging . To see how the interplay of bridging and biochemical switching can create patterns, we performed a linear stability analysis of this uniform state (Fig. 2, detailed in the Supporting Material). The result is that small perturbations of the uniform phase grow if , where . This instability criterion translates in physical units to
| (4) |
From Eq. 4, it is important to notice that the instability toward nonuniform phases is driven by bridging (i.e., χ needs to exceed a certain threshold), whereas diffusion of chromatin and proteins , the excluded volume g, and the protein modification α, all tend to stabilize uniform chromatin-protein distributions. This can be readily understood by considering rapidly switching proteins (i.e., the case of large α). In this scenario, proteins switch between the on- and off-states so rapidly that cluster formation becomes possible only by increasing the binding strength χ. A similar argument applies if the diffusion of the components is very fast or the short-range repulsion very strong. Finally, Eq. 4 also tells us that there is no lower bound in protein concentration for the onset of this bridging-induced instability, because does not appear in the equation.
Figure 2.

Mean field theory predicts arrested coarsening with protein modification. (A) Dispersion relation, showing the growth rate, λ, as a function of the magnitude of the wavevector, q, for fluctuations around the uniform solution of Eq. 2, for = A = 1, and X = 3.5 (cyan), corresponding to linear stability of the uniform phase, X = Xc = 4.0 (blue), marking the onset of instability, and X = 4.5 (red), revealing the growth of clusters with a characteristic length scale. (Dotted black line) Typical dispersion relation in the absence of protein modification, which leads to a long wavelength instability. (B) Scaling between number of proteins in a cluster and switching rate found from Brownian dynamics simulations. Points show saturation values (±SD) of number of particles per cluster N (after 1.5 × 10⁵ simulation units); the line shows a least-squares fit with a slope of −0.756. To see this figure in color, go online.
Calculating the wavenumber at the onset of instability (see the Supporting Material) unveils the remarkable role played by the biochemical reaction for structure formation. Specifically, we find for the dimensionless onset wavenumber, translating in physical units to the typical length scale of
| (5) |
Hence, in contrast to models without protein modification, this system exhibits a short wavelength instability (Fig. 2 A), which turns into a long wavelength instability only in the limit (which would lead to , dotted black line in Fig. 2 A). Our linear stability analysis therefore suggests that the presence of the biochemical reaction has qualitative consequences for the clustering in the system, in that it leads to self-limiting cluster sizes, or put differently, to microphase separation rather than to macrophase separation—in full agreement with the simulations shown in Fig. 1.
To further confirm that within our mean-field theory, clusters cannot coarsen indefinitely, we also performed a weakly nonlinear expansion, through which we found that the amplitude of the chromatin density fluctuations close to the uniform state obey the “real Ginzburg Landau equation” (which is associated with formation of stationary patterns of well-defined self-limiting size (31); and also see the Supporting Material). Finally, Eq. 5 also predicts that, at least close to the onset of clustering, the average number of proteins in any aggregate should scale as . This behavior is reported in Fig. 2 B, where we show the very good agreement of this scaling argument with the results from the Brownian dynamics simulations.
While estimating values for the parameters appearing in Eq. 5 is challenging, the cluster size predicted by our model through the Brownian dynamics simulations compares favorably with that obtained experimentally. In Fig. 2 B, the typical number of proteins in a cluster found by simulations ranges from 25 to 100 for inverse Brownian times. From these values, one can extract the typical cluster size as 70–100 nm (a protein, here, is ∼30 nm). These values are in line with, for example, STORM experiments performed on Polycomb nuclear bodies in Drosophila (11, 12). As the Brownian time is ms (see the Supporting Material), the inverse switching rate is ∼1 min, which is reasonable for posttranslational modifications such as phosphorylation or acetylation (32).
This specific example shows that the cluster size we get in our simulations is similar to that of nuclear protein clusters. We will come back to a comparison to experiments in the next section, where we consider the case of specific binding, which is more relevant to nuclear bodies in vivo. There, we also simulate a typical photobleaching experiment to assess the kinetic recycling of nuclear bodies.
Switching proteins with specific binding self-assemble into recycling nuclear bodies
The model considered in Fig. 1 assumes that proteins bind nonspecifically. While this is a good approximation for generic heterochromatin-binding proteins in silenced regions of the genome, most transcription factors bind strongly to specific sites in active regions and to most other DNA nonspecifically (33). Therefore, we consider proteins binding with high affinity to every 20th bead (i.e., every 60 kbp), and with low affinity to all others. (Note: similar results are expected for different patterns of binding sites (8, 20).) Now bound proteins self-assemble into clusters of self-limiting size even when α = 0 (Fig. 3; Movie S3). In other words, coarsening is always arrested. As suggested previously (20, 23, 25), specific binding creates loops that are associated with entropic costs that scale superlinearly with loop number. In turn, this limits cluster growth (23).
Figure 3.

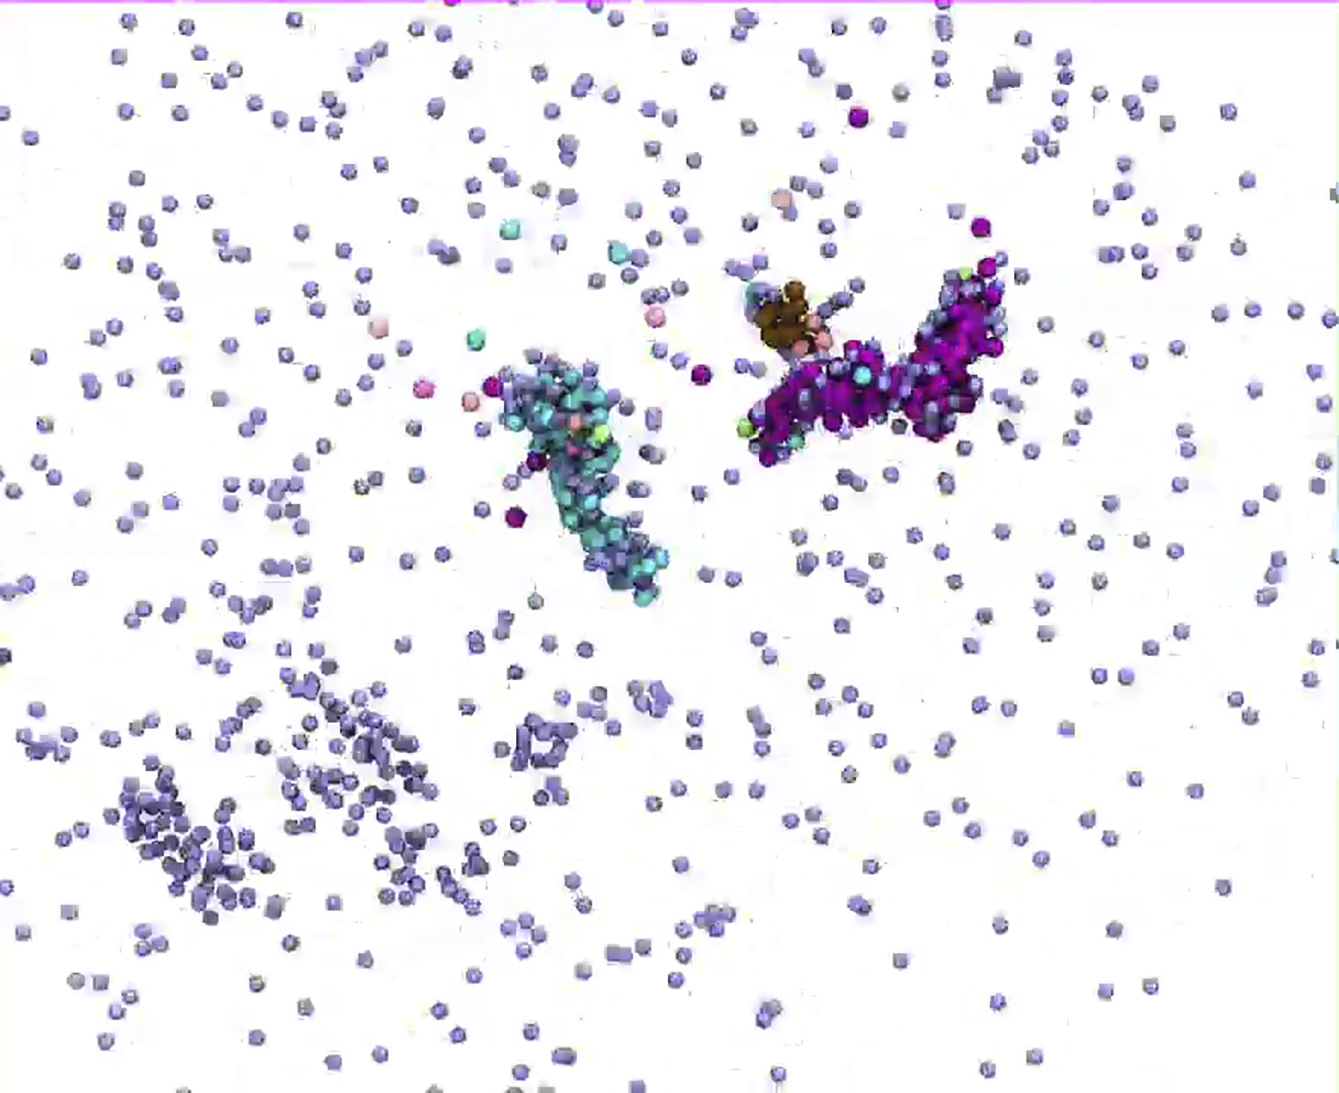
In silico FRAP (Brownian dynamics simulations). (A) Snapshots taken 104 (i and ii) or 2 × 10⁴ (iii and iv) after equilibration, during an in silico FRAP experiment (only proteins—and not chromatin beads—are shown for clarity). (i) The simulation begins with N = 2000 equilibrium proteins, half of which are able to bind the chromatin fiber, both specifically (interaction strength 15 kBT, cutoff 1.8σ) to every 20th bead in the polymer, and nonspecifically (interaction strength 4 kBT, cutoff 1.8σ) to any other bead. After 104 time units, a structure with multiple clusters forms. The snapshot shows only a portion of this, for clarity; five clusters of bound proteins have developed (unbound proteins are gray; bound proteins in the five clusters are blue, pink, purple, and green). Circled areas will be photobleached. (ii) Photobleaching involves making bound proteins invisible (the bleached proteins are still present in the simulation). (iii) If proteins can switch, clusters reappear in the same general place (as new proteins replace their bleached counterparts). (iv) If proteins cannot switch (i.e., α = 0), clusters do not recover (as their protein constituents do not recycle). (B) FRAP recovery. Error bars give SD of mean, and time is given in multiples of 104 simulation units; the values of α, in units of inverse Brownian times, are as indicated in each panel. Only the postbleaching signal is shown (the prebleaching value would be constant and equal to 1 in these units). (i) Number of unbleached proteins in the bleached volume (a sphere of 50σ) as a function of time, after bleaching. The signal is normalized with respect to the number of proteins initially in the bleached volume. (ii) Number of unbleached proteins in clusters as a function of time after bleaching, after all proteins in clusters at a given instant are bleached. The signal is normalized with respect to the proteins in clusters at the time of bleaching. To see this figure in color, go online.
Although coarsening is arrested whatever the value of α, there is still a major difference between the dynamics of the equilibrium and switching proteins. Without switching, proteins can only unbind thermodynamically, which requires a long time: as a result, proteins rarely exchange between clusters (Fig. 3; Movie S3). With switching, there is a constant turnover of proteins within the clusters, which recycle all their components over a time ∼α−1 (Fig. 3; Movie S4). Reducing the strength of the specific interactions can also lead to protein turnover (Fig. S1), but this requires fine-tuning of the parameters to simultaneously ensure stable binding and the recycling of proteins in clusters. In contrast, protein modification naturally leads to such recycling for any values of specific and nonspecific binding affinity.
To quantitatively characterize the dynamics of turnover within clusters, we perform a simulated fluorescence-recovery-after-photobleaching (FRAP) experiment (34). In such an experiment some of the clusters are photobleached at a given time, and recovery of fluorescence is then monitored (Fig. 3). The fluorescence signal (proportional to the number of nonphotobleached active proteins in the clusters) recovers quickly in the α > 0 case (Fig. 3, Aiii and B), but not in the α = 0 case (Fig. 3, Aiv and Bi), at least for large values of the specific interaction strength. The dynamics of recovery can be measured by counting the number of unbleached proteins in the photobleached volume (Fig. 3 Bi); this is proportional to the fluorescence intensity measured in a standard FRAP experiment. Alternatively, the number of unbleached proteins in clusters can be used (Fig. 3 Bii). Both approaches give similar recovery timescales, and confirm that protein modification is required to create clusters in which proteins can recycle.
The clusters found in Fig. 3 typically contain ∼20–100 proteins that recycle (Fig. S2 A) and give average cluster sizes of ∼70–100 nm. Cluster size depends on both protein concentration and interaction energy (e.g., in Fig. S2 B, there are only ∼5–10 proteins per cluster). Therefore, this mechanism can produce clusters with a wide range of sizes. Note that nuclear bodies range from large nucleoli (up to several micrometers), through Cajal and promyelocytic leukemia bodies (∼1 μm) (14, 15, 16), to transcription factories containing ∼10 active transcription complexes, and to polycomb bodies (∼100 nm) (3, 11, 35, 36). Importantly, like most nuclear bodies, our clusters also retain a memory of their shape. Thus, in Fig. 3 A, when most of the components of the pink cluster on the left have turned over, the general shape of the cluster persists (see also Movies S4, S5, and Fig. S3). This is because the chromatin scaffold associated with the protein clusters (i.e., the sites of specific binding) retains a general three-dimensional structure that does not change much over time (Fig. S4). Taken together, these results strongly support the conjecture that nuclear bodies emerge from the aggregation of bound switching proteins, and that switching both arrests phase separation and ensures that bound proteins continually exchange with the soluble pool.
Notably, the nuclear bodies that our clusters resemble generally show FRAP recovery times in the range of tens of minutes (37, 38, 39). These are too slow to be accounted for by diffusion, and too fast to be compatible with the thermodynamic unbinding of tightly bound proteins (see the Supporting Material); remarkably, our simulations can instead readily account for these timescales.
Thus, within our model, the recovery time over which nuclear bodies recycle their proteins is linked to protein modification, and it is simply proportional to α−1. Typical rates of posttranslational protein modification can be of the order of minutes (and will be slower within nuclear bodies due to macromolecular crowding), and transcription termination also occurs within minutes after initiation. In light of this, our simulations predict recovery timescales of the order of α−1, or minutes, in broad agreement with those measured experimentally (37, 38, 39). Further to this, there is biological evidence that protein modifications can take place within nuclear bodies (37). For instance, enzymes performing posttranslational modifications are found in Cajal bodies (37), and phosphorylation or ubiquination of the BMI1 subunit of the PcG PRC1 complex are important factors that determine the kinetics of exchange in polycomb bodies (38).
Protein switching preserves TAD structure, while suppressing long-range interactions
Clustering of bridging proteins can lead to the formation of chromatin interaction domains (6, 8, 12, 20) resembling TADs found in Hi-C data (19). It is therefore of interest to ask how switching affects TAD structure and dynamics. Here, we return to a toy model first considered elsewhere (8): the fiber has a regular pattern of binding and nonbinding regions (Fig. 4 A), and each binding region spontaneously and reproducibly assembles into a TAD that is flanked by a disordered nonbinding region (8). The regular interspersion of nonbinding segments in Fig. 4 A fixes the locations of TAD boundaries; consequently, clusters form (Fig. 4, B and C) at reproducible positions along the fiber, and this in turn yields TADs seen in averaged contact maps (Fig. 4 D). Such patterns resemble those seen in Hi-C data obtained from cell populations.
Figure 4.

Switching promotes intra-TAD contacts, but suppresses inter-TAD ones. (A) Overview: Simulations involved N = 2000 nonswitching (α = 0) or N = 2000 switching proteins (α = 0.0001 inverse Brownian times); for α = 0, half of the proteins are binding. In both cases, interaction energy and cutoff values were 4 kBT and 1.8σ. The fiber (length 15 Mbp) consisted of regularly interspersed segments containing runs of binding (blue) and nonbinding (black) beads (segment sizes 1.2 Mbp and 300 kbp, respectively). (B and C) Snapshots taken after 105 simulation units. Nonbinding (gray) and binding (red) proteins are shown. (D) Contact maps (averages from 10 simulations) for nonswitching (top-left triangle), and switching proteins (lower-right triangle). The scale (right) indicates contact frequencies. (E) The evolution of the ratio of nonlocal contacts over time. A local (nonlocal) contact is one between beads separated by less (more) than 1.2 Mbp along the fiber. Here the simulation was run for 105 simulation units with nonswitching proteins; switching was then turned on (α = 0.0001 inverse Brownian times) and the simulation was run for a further 105 simulation units. To see this figure in color, go online.
Variations in α have several effects (Fig. 4). First, the configurations found at steady state are qualitatively different. Although cluster growth is limited for both α = 0 and α > 0, the (recycling) clusters formed by switching proteins are much smaller (Fig. 4, B and C; Movie S6). Second (and notwithstanding this qualitative difference), the contact maps close to the diagonal are remarkably similar (Fig. 4 D; compare patterns on each side immediately next to the diagonal); this indicates that local TAD structure is largely unperturbed by switching. However, for α > 0, nonlocal contacts (i.e., between chromatin segments far apart along the fiber) are strikingly suppressed (Fig. 4 D, compare patterns on each side far from the diagonal, see also Fig. S5), and higher-order folding of one TAD onto another is suppressed.
This observation can be explained as follows. First, the timescale for the formation of TADs is comparable to (or smaller than) that of protein recycling within a TAD (see Supporting Material for an estimate of such timescales). Computer simulations of TAD formation in Drosophila and human chromosomes also suggest that the local structure can be formed very rapidly (at most, in minutes) (8, 12). Therefore, it is plausible that local TAD folding is fast enough not to be perturbed much by protein modification. Second, when a particular protein switches from binding to nonbinding, a contact is lost, and it is likely that local ones can reform faster than nonlocal ones.
In light of this, the nonequilibrium switching we account for in this model provides a mechanism allowing faster large-scale rearrangements, and a more effective trimming of entropically unfavorable long-ranged interactions. In other words, active posttranslational modification tilts the balance in favor of local intra-TAD contacts at the expenses of inter-TAD ones. This observation is consistent with the sharp decay beyond the Mbp scale seen in Hi-C data (19, 40).
Conclusions
We have shown that active posttranslational protein modication (e.g., phosphorylation, methylation, acetylation (27), or any other nonequilibrium reaction where a protein switches between active and inactive states) has a profound and generic effect on the behavior of a chromatin-protein mixture. Our results strongly suggest that the interplay between protein bridging and protein modification is an important principle underlying nuclear organization within eukaryotes.
First, it was previously shown that nonswitching proteins able to bind nonspecifically to chromatin to form molecular bridges assemble into clusters which have a natural tendency to coarsen (20, 21). In this work, we have shown that accounting for protein switching changes the qualitative and quantitative behavior of the system; cluster growth is self-limiting (Fig. 1)—a phenomenon that can be understood via a simple mean field theory (Fig. 2). This theory also provides an example of arrested phase separation, and it can explain why nuclear bodies do not progressively grow (13, 14, 15, 16), and why neighboring clumps of heterochromatin—whether detected using classical staining and microscopy, or through inspection of Hi-C contact maps (19, 41)—rarely merge into one superdomain.
Second, nonswitching proteins bind specifically to cognates sites on the chromatin fiber, and they also cluster; however, specific binding is known to arrest the coarsening through the entropic penalty of loop formation (8, 20). But in contrast to what is seen in photobleaching experiments (37, 38), bound proteins in the ensuing clusters exchange little with the soluble pool. Moreover, the timescales seen in such bleaching experiments are too slow to be accounted for by diffusion, and too fast to be compatible with the thermodynamic unbinding of tightly bound proteins. The results reported in this work strongly suggest that protein modification provides a neat solution to this paradox: dynamic clusters naturally emerge during simulations, with constituent proteins recycling on a timescale proportional to the inverse switching rate, α−1 (Fig. 3). Importantly, when clusters in simulations are photobleached, they behave like nuclear bodies seen in vivo—they retain a memory of their shape, despite the continual exchange with the soluble pool.
Third and finally, switching affects large-scale chromatin organization. Bridging-induced clusters are associated with the formation of chromatin domains, reminiscent of the TADs observed in Hi-C data (19). Using a fiber patterned in such a way that it spontaneously folds into TADs, we find that switching has little effect on local TAD organization, but strongly suppresses inter-TAD interactions; local contacts are favored over nonlocal ones (Fig. 4). We expect that similar trends should be observed in more complex models for bridging-induced chromosome organization, such as those in Barbieri et al. (6) and Brackley et al. (8, 20).
While here we focus on a flexible chromatin fiber, we expect that similar results should be found with a semiflexible one (20, 22); then, our conclusions should also apply to bacterial DNA. Possible differences with respect to the results reported here may arise as a consequence of the first-order coil-globule phase transition displayed by stiffer chains (22). It would be interesting to study this case further in the future. Similar results to those reported here are also expected with more complex pathways between active and inactive states (e.g., modeling the cyclic flooding of proteins into nuclei, or their cyclic synthesis/degradation), and it would be of interest to investigate these scenarios. We suggest that a mechanistic test of our model may be realized by disrupting some of the biochemical pathways involved in posttranslational protein modification, as this procedure would lead to a change in the switching rate α. For example, phosphorylation pathways (42, 43) are known to mark protein degradation, hence decreasing the efficiency of phosphorylation may be expected to decrease α, thereby increasing typical cluster size and presumably affecting recovery time of FRAP experiments.
In summary, we demonstrated how nonequilibrium processes involving ephemeral protein states can provide a simple way of understanding how dynamic nuclear bodies of self-limiting size might form, and how chromosomal domains at the larger scale might be organized.
Author Contributions
C.A.B., B.L., D. Michieletto, F.M., P.R.C., and D. Marenduzzo designed the research, performed the research, analyzed the data, and wrote the article.
Acknowledgments
This work was funded by the European Research Council (ERC) (under Consolidator Grant No. 648050 THREEDCELLPHYSICS), and by a Marie Skłodowska-Curie Intra European Fellowship (under grant No. 654908).
Editor: Andrew Spakowitz.
Footnotes
Supporting Materials and Methods, five figures, and six movies are available at http://www.biophysj.org/biophysj/supplemental/S0006-3495(17)30146-7.
Supporting Material
Nonswitching proteins (α = 0). First, a snapshot of 104 simulation units after equilibration is shown: a number of small clusters have formed. Then the subsequent dynamics are shown: clusters grow and merge, and coarsening proceeds indefinitely.
Proteins switch at a rate α = 0.0001 inverse Brownian times. Switching arrests coarsening, and leads to clusters of self-limiting size in steady state.
For simplicity, chromatin beads are not shown. The movie starts with clusters that have formed during 104 simulation units after equilibration. The proteins are colored according to the cluster they belong to when the movie starts; proteins not in any clusters at that time are gray. The movie then follows the dynamics with nonswitching proteins for another 104 simulation units, where it is shown that colored clusters persist; therefore, photobleaching such a cluster would lead to little or no recovery of signal in the cluster.
Proteins are colored according to the initial clusters; by the end of the simulations all clusters have mixed colors. While proteins in clusters recycle, the cluster retains the same overall shape.
The zoom-in is to show more clearly clusters that retain a “memory” of their shape.
The first half of the simulation involves nonswitching proteins and lasts 105 simulation units; two clusters form. Proteins are black; yellow chromatin beads are binding, and blue ones are nonbinding. During the second half, proteins are able to switch (α = 0.0001 inverse Brownian times); clusters split and interdomain interactions are suppressed.
References
- 1.Calladine C.R., Drew H.R., Travers A.A. Ed. 3. Elsevier; London, UK: 2004. Understanding DNA. [Google Scholar]
- 2.Alberts B. Garland Science; New York: 2002. Molecular Biology of the Cell. [Google Scholar]
- 3.Cook P.R. Wiley-Liss; New York: 2001. Principles of Nuclear Structure and Function. [Google Scholar]
- 4.Dame R.T., Noom M.C., Wuite G.J. Bacterial chromatin organization by H-NS protein unravelled using dual DNA manipulation. Nature. 2006;444:387–390. doi: 10.1038/nature05283. [DOI] [PubMed] [Google Scholar]
- 5.Simonis M., Klous P., de Laat W. Nuclear organization of active and inactive chromatin domains uncovered by chromosome conformation capture-on-chip (4C) Nat. Genet. 2006;38:1348–1354. doi: 10.1038/ng1896. [DOI] [PubMed] [Google Scholar]
- 6.Barbieri M., Chotalia M., Nicodemi M. Complexity of chromatin folding is captured by the strings and binders switch model. Proc. Natl. Acad. Sci. USA. 2012;109:16173–16178. doi: 10.1073/pnas.1204799109. [DOI] [PMC free article] [PubMed] [Google Scholar]
- 7.Brackley C.A., Brown J.M., Marenduzzo D. Predicting the three-dimensional folding of cis-regulatory regions in mammalian genomes using bioinformatic data and polymer models. Genome Biol. 2016;17:59. doi: 10.1186/s13059-016-0909-0. [DOI] [PMC free article] [PubMed] [Google Scholar]
- 8.Brackley C.A., Johnson J., Marenduzzo D. Simulated binding of transcription factors to active and inactive regions folds human chromosomes into loops, rosettes and topological domains. Nucleic Acids Res. 2016;44:3503–3512. doi: 10.1093/nar/gkw135. [DOI] [PMC free article] [PubMed] [Google Scholar]
- 9.Kilic S., Bachmann A.L., Fierz B. Multivalency governs HP1α association dynamics with the silent chromatin state. Nat. Commun. 2015;6:7313. doi: 10.1038/ncomms8313. [DOI] [PMC free article] [PubMed] [Google Scholar]
- 10.Harshman S.W., Young N.L., Freitas M.A. H1 histones: current perspectives and challenges. Nucleic Acids Res. 2013;41:9593–9609. doi: 10.1093/nar/gkt700. [DOI] [PMC free article] [PubMed] [Google Scholar]
- 11.Wani A.H., Boettiger A.N., Francis N.J. Chromatin topology is coupled to Polycomb group protein subnuclear organization. Nat. Commun. 2016;7:10291. doi: 10.1038/ncomms10291. [DOI] [PMC free article] [PubMed] [Google Scholar]
- 12.Michieletto, D., D. Marenduzzo, and A. H. Wani. 2016. Chromosome-wide simulations uncover folding pathway and 3D organization of interphase chromosomes. arXiv:1604.03041.
- 13.Zhu L., Brangwynne C.P. Nuclear bodies: the emerging biophysics of nucleoplasmic phases. Curr. Opin. Cell Biol. 2015;34:23–30. doi: 10.1016/j.ceb.2015.04.003. [DOI] [PMC free article] [PubMed] [Google Scholar]
- 14.Sleeman J.E., Trinkle-Mulcahy L. Nuclear bodies: new insights into assembly/dynamics and disease relevance. Curr. Opin. Cell Biol. 2014;28:76–83. doi: 10.1016/j.ceb.2014.03.004. [DOI] [PubMed] [Google Scholar]
- 15.Mao Y.S., Zhang B., Spector D.L. Biogenesis and function of nuclear bodies. Trends Genet. 2011;27:295–306. doi: 10.1016/j.tig.2011.05.006. [DOI] [PMC free article] [PubMed] [Google Scholar]
- 16.Pirrotta V., Li H.B. A view of nuclear Polycomb bodies. Curr. Opin. Genet. Dev. 2012;22:101–109. doi: 10.1016/j.gde.2011.11.004. [DOI] [PMC free article] [PubMed] [Google Scholar]
- 17.Berry J., Weber S.C., Brangwynne C.P. RNA transcription modulates phase transition-driven nuclear body assembly. Proc. Natl. Acad. Sci. USA. 2015;112:E5237–E5245. doi: 10.1073/pnas.1509317112. [DOI] [PMC free article] [PubMed] [Google Scholar]
- 18.Brangwynne C.P., Tompa P., Pappu R.V. Polymer physics of intracellular phase transitions. Nat. Phys. 2015;11:899–904. [Google Scholar]
- 19.Dixon J.R., Selvaraj S., Ren B. Topological domains in mammalian genomes identified by analysis of chromatin interactions. Nature. 2012;485:376–380. doi: 10.1038/nature11082. [DOI] [PMC free article] [PubMed] [Google Scholar]
- 20.Brackley C.A., Taylor S., Marenduzzo D. Nonspecific bridging-induced attraction drives clustering of DNA-binding proteins and genome organization. Proc. Natl. Acad. Sci. USA. 2013;110:E3605–E3611. doi: 10.1073/pnas.1302950110. [DOI] [PMC free article] [PubMed] [Google Scholar]
- 21.Johnson J., Brackley C.A., Marenduzzo D. A simple model for DNA bridging proteins and bacterial or human genomes: bridging-induced attraction and genome compaction. J. Phys. Condens. Matter. 2015;27:064119. doi: 10.1088/0953-8984/27/6/064119. [DOI] [PubMed] [Google Scholar]
- 22.Le Treut G., Képès F., Orland H. Phase behavior of DNA in the presence of DNA-binding proteins. Biophys. J. 2016;110:51–62. doi: 10.1016/j.bpj.2015.10.027. [DOI] [PMC free article] [PubMed] [Google Scholar]
- 23.Marenduzzo D., Orlandini E. Topological and entropic repulsion in biopolymers. J. Stat. Mech. Theory Exp. 2009;2009:L09002. [Google Scholar]
- 24.Cates M.E., Witten T.A. Chain conformation and solubility of associating polymers. Macromolecules. 1986;19:732–739. [Google Scholar]
- 25.Orlandini E., Garel T. Collapse transitions of a periodic hydrophilic hydrophobic chain. Eur. Phys. J. B. 1998;6:101–110. [Google Scholar]
- 26.Scolari V.F., Cosentino Lagomarsino M. Combined collapse by bridging and self-adhesion in a prototypical polymer model inspired by the bacterial nucleoid. Soft Matter. 2015;11:1677–1687. doi: 10.1039/c4sm02434f. [DOI] [PubMed] [Google Scholar]
- 27.Tootle T.L., Rebay I. Post-translational modifications influence transcription factor activity: a view from the ETS superfamily. BioEssays. 2005;27:285–298. doi: 10.1002/bies.20198. [DOI] [PubMed] [Google Scholar]
- 28.Nicodemi M., Prisco A. Thermodynamic pathways to genome spatial organization in the cell nucleus. Biophys. J. 2009;96:2168–2177. doi: 10.1016/j.bpj.2008.12.3919. [DOI] [PMC free article] [PubMed] [Google Scholar]
- 29.Chaikin P.M., Lubensky T.C. Cambridge University Press; Cambridge, UK: 2000. Principles of Condensed Matter Physics. [Google Scholar]
- 30.Byrne A., Kiernan P., Dawson K.A. Kinetics of homopolymer collapse. J. Chem. Phys. 1995;1012:573–577. [Google Scholar]
- 31.Cross M.C., Hohenberg P.C. Pattern formation outside of equilibrium. Rev. Mod. Phys. 1993;65:851–1112. [Google Scholar]
- 32.Zentner G.E., Henikoff S. Regulation of nucleosome dynamics by histone modifications. Nat. Struct. Mol. Biol. 2013;20:259–266. doi: 10.1038/nsmb.2470. [DOI] [PubMed] [Google Scholar]
- 33.Sheinman M., Bénichou O., Voituriez R. Classes of fast and specific search mechanisms for proteins on DNA. Rep. Prog. Phys. 2012;75:026601. doi: 10.1088/0034-4885/75/2/026601. [DOI] [PubMed] [Google Scholar]
- 34.Mueller F., Mazza D., McNally J.G. FRAP and kinetic modeling in the analysis of nuclear protein dynamics: what do we really know? Curr. Opin. Cell Biol. 2010;22:403–411. doi: 10.1016/j.ceb.2010.03.002. [DOI] [PMC free article] [PubMed] [Google Scholar]
- 35.Papantonis A., Cook P.R. Transcription factories: genome organization and gene regulation. Chem. Rev. 2013;113:8683–8705. doi: 10.1021/cr300513p. [DOI] [PubMed] [Google Scholar]
- 36.Marenduzzo D., Micheletti C., Cook P.R. Entropy-driven genome organization. Biophys. J. 2006;90:3712–3721. doi: 10.1529/biophysj.105.077685. [DOI] [PMC free article] [PubMed] [Google Scholar]
- 37.Handwerger K.E., Murphy C., Gall J.G. Steady-state dynamics of Cajal body components in the Xenopus germinal vesicle. J. Cell Biol. 2003;160:495–504. doi: 10.1083/jcb.200212024. [DOI] [PMC free article] [PubMed] [Google Scholar]
- 38.Hernández-Muñoz I., Taghavi P., van Lohuizen M. Association of BMI1 with polycomb bodies is dynamic and requires PRC2/EZH2 and the maintenance DNA methyltransferase DNMT1. Mol. Cell. Biol. 2005;25:11047–11058. doi: 10.1128/MCB.25.24.11047-11058.2005. [DOI] [PMC free article] [PubMed] [Google Scholar]
- 39.Kimura H., Sugaya K., Cook P.R. The transcription cycle of RNA polymerase II in living cells. J. Cell Biol. 2002;159:777–782. doi: 10.1083/jcb.200206019. [DOI] [PMC free article] [PubMed] [Google Scholar]
- 40.Sanborn A.L., Rao S.S., Aiden E.L. Chromatin extrusion explains key features of loop and domain formation in wild-type and engineered genomes. Proc. Natl. Acad. Sci. USA. 2015;112:E6456–E6465. doi: 10.1073/pnas.1518552112. [DOI] [PMC free article] [PubMed] [Google Scholar]
- 41.Sexton T., Yaffe E., Cavalli G. Three-dimensional folding and functional organization principles of the Drosophila genome. Cell. 2012;148:458–472. doi: 10.1016/j.cell.2012.01.010. [DOI] [PubMed] [Google Scholar]
- 42.Qian H. Phosphorylation energy hypothesis: open chemical systems and their biological functions. Annu. Rev. Phys. Chem. 2007;58:113–142. doi: 10.1146/annurev.physchem.58.032806.104550. [DOI] [PubMed] [Google Scholar]
- 43.Trentini D.B., Suskiewicz M.J., Clausen T. Arginine phosphorylation marks proteins for degradation by a Clp protease. Nature. 2016;539:48–53. doi: 10.1038/nature20122. [DOI] [PMC free article] [PubMed] [Google Scholar]
Associated Data
This section collects any data citations, data availability statements, or supplementary materials included in this article.
Supplementary Materials
Nonswitching proteins (α = 0). First, a snapshot of 104 simulation units after equilibration is shown: a number of small clusters have formed. Then the subsequent dynamics are shown: clusters grow and merge, and coarsening proceeds indefinitely.
Proteins switch at a rate α = 0.0001 inverse Brownian times. Switching arrests coarsening, and leads to clusters of self-limiting size in steady state.
For simplicity, chromatin beads are not shown. The movie starts with clusters that have formed during 104 simulation units after equilibration. The proteins are colored according to the cluster they belong to when the movie starts; proteins not in any clusters at that time are gray. The movie then follows the dynamics with nonswitching proteins for another 104 simulation units, where it is shown that colored clusters persist; therefore, photobleaching such a cluster would lead to little or no recovery of signal in the cluster.
Proteins are colored according to the initial clusters; by the end of the simulations all clusters have mixed colors. While proteins in clusters recycle, the cluster retains the same overall shape.
The zoom-in is to show more clearly clusters that retain a “memory” of their shape.
The first half of the simulation involves nonswitching proteins and lasts 105 simulation units; two clusters form. Proteins are black; yellow chromatin beads are binding, and blue ones are nonbinding. During the second half, proteins are able to switch (α = 0.0001 inverse Brownian times); clusters split and interdomain interactions are suppressed.