Abstract
The cellular response to hypoxia is critical for cell survival and is fine-tuned to allow cells to recover from hypoxic stress and adapt to heterogeneous or fluctuating oxygen levels1,2. The hypoxic response is mediated by the α subunit of the transcription factor HIF-1 (HIF-1α)3, which interacts via its intrinsically disordered C-terminal transactivation domain with the TAZ1 (CH1) domain of the general transcriptional coactivators CBP and p300 to control transcription of critical adaptive genes4–6. One such gene is CITED2, a negative feedback regulator that attenuates HIF transcriptional activity by competing for TAZ1 binding through its own disordered transactivation domain7–9. Little is known about the molecular mechanism by which CITED2 displaces the tightly bound HIF-1α from their common cellular target. The HIF-1α and CITED2 transactivation domains bind to TAZ1 through helical motifs that flank a conserved LP(Q/E)L sequence that is essential for negative feedback regulation5,6,8,9. We show that CITED2 displaces HIF-1α by forming a transient ternary complex with TAZ1 and HIF-1α and competing for a shared binding site via its LPEL motif, thus promoting a conformational change in TAZ1 that increases the rate of HIF-1α dissociation. Through allosteric enhancement of HIF-1α release, CITED2 activates a highly responsive negative feedback circuit that rapidly and efficiently attenuates the hypoxic response, even at modest CITED2 concentrations. This hypersensitive regulatory switch is entirely dependent on the unique flexibility and binding properties of these intrinsically disordered proteins and exemplifies a likely common strategy used by the cell to respond rapidly to environmental signals.
The diverse functionality of intrinsically disordered proteins (IDPs) arises from their inherent flexibility and their ability to adopt an ensemble of conformations of similar energy, permitting rapid but specific interactions with numerous cellular partners via short peptide motifs10. Individual motifs in IDPs can function synergistically to enhance binding affinity or modulate the biological response11,12, but little is known about how these motifs compete for occupancy of common target molecules during cellular signaling.
Under normoxic conditions, the proteins that mediate the hypoxic response are tightly regulated. Accumulation of HIF-1α is suppressed by hydroxylation events that target it for degradation13 and inhibit binding to the TAZ1 domain of CBP/p30014. In hypoxia, HIF-1α is no longer hydroxylated and binds tightly to TAZ1 to promote rapid activation of adaptive genes5,6,14. The hypoxic response is remarkably efficient; HIF-1α stabilization and transcriptional activity exhibits a switch-like dependence on oxygen concentration15,16. Like HIF-1α, CITED2 is unstable in normoxia7, subject to proteasomal degradation17, and forms a high-affinity complex with TAZ18. CITED2 is stabilized in hypoxia and nearly all detectable CITED2 is found in complex with CBP/p3007, suggesting that CITED2 competes with HIF-1α in an exceptionally efficient manner.
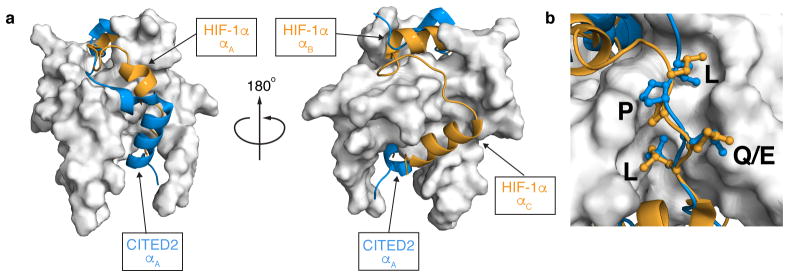
The activation domains of HIF-1α (residues 776-826) and CITED2 (residues 216-269) utilize partially overlapping binding sites to form high-affinity complexes with TAZ1 (Fig. 1)5,6,8,9. The αA helices of HIF-1α and CITED2 and their conserved LP(Q/E)L motifs bind to the same surfaces of TAZ1. The region of CITED2 C-terminal to the LPEL motif binds in an extended conformation in the same site as the αB helix of HIF-1α. Only the αC helix of HIF-1α binds to a fully non-overlapping site on TAZ1.
Figure 1. HIF-1α and CITED2 bind to a partially overlapping surface of TAZ1.
a, Superimposed structures of the TAZ1:HIF-1α (PDB ID: 1L8C) and TAZ1:CITED2 (PDB ID: 1R8U) complexes. TAZ1 is shown in the surface representation in gray; HIF-1α (orange) and CITED2 (blue) peptides are shown as ribbons. The model is rotated 180° between the left and right panels. HIF-1α and CITED2 binding motifs are labeled. b, Expanded view of the binding site for the conserved LP(Q/E)L motif. The color scheme is as described in (a).
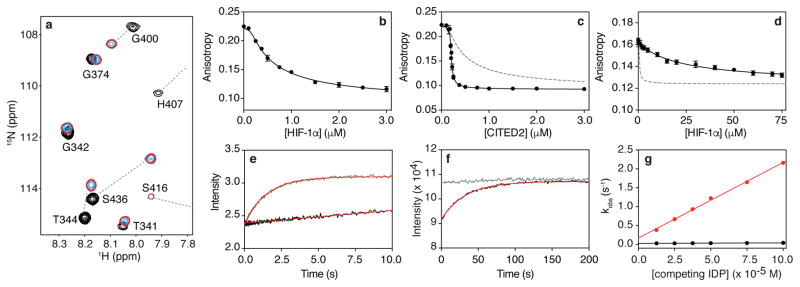
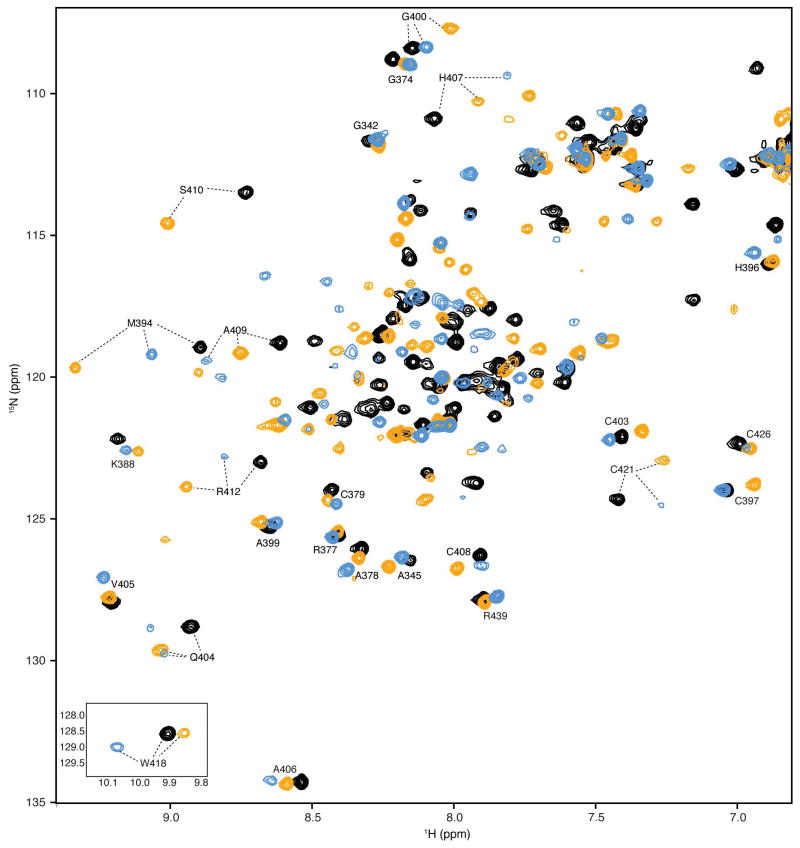
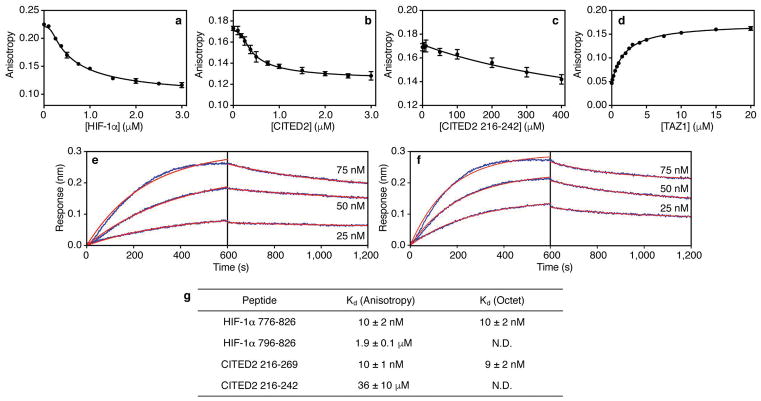
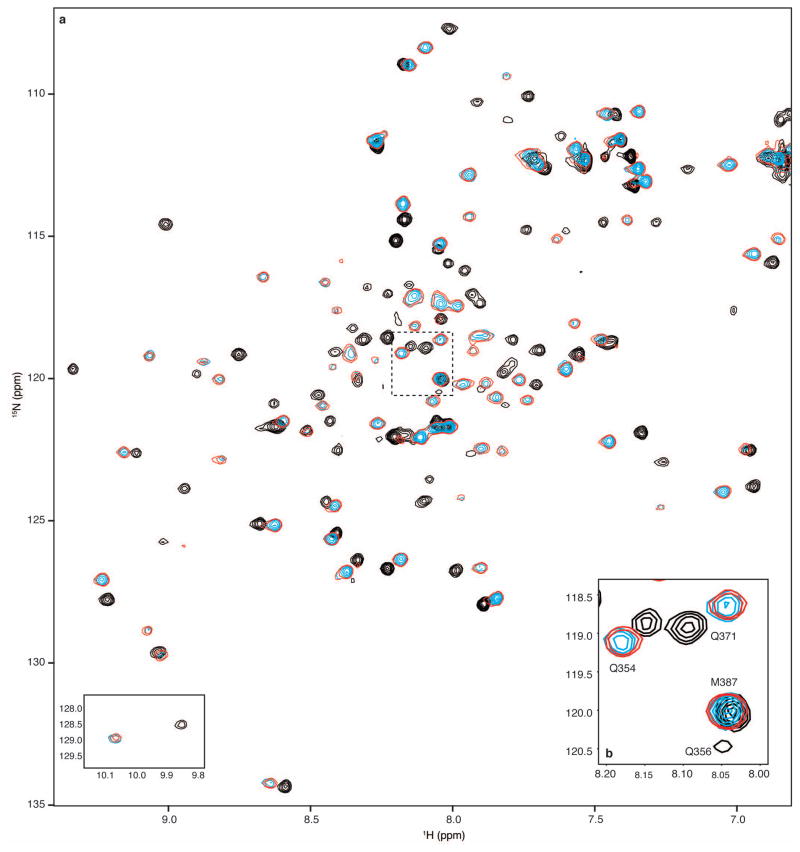
Competition between HIF-1α and CITED2 was characterized by NMR spectroscopy. The 1H-15N HSQC spectrum of 15N-labeled TAZ1 bound to HIF-1α differs from the spectrum of 15N-TAZ1 bound to CITED2 (Extended Data Fig. 1) allowing us to discriminate between HIF-1α- and CITED2-bound TAZ1 resonances and obtain site-specific information on the competition mechanism. Consistent with literature reports5,6,8,9, the HIF-1α and CITED2 transactivation domains bind TAZ1 with the same affinity under the conditions of our NMR experiments (Kd = 10 ± 2 nM, Extended Data Fig. 2). Since their binding affinities are the same, we expected that a sample of 15N-TAZ1 mixed with both the HIF-1α and CITED2 peptides in a 1:1:1 molar ratio would yield an HSQC spectrum with two sets of resonances of approximately equal intensity, corresponding to an equally populated mixture of the 15N-TAZ1:HIF-1α and 15N-TAZ1:CITED2 complexes. However, this experiment yielded a surprising result. Regardless of the order of addition, the only cross peaks observed in spectra of 15N-TAZ1 samples containing equimolar HIF-1α and CITED2 are those of the binary CITED2 complex (Fig. 2a, Extended Data Fig. 3). Observation of solely the TAZ1:CITED2 complex, despite the equal affinities of HIF-1α and CITED2 for binding to TAZ1, suggests that CITED2 binds to the TAZ1:HIF-1α complex in a strongly cooperative process to fully and efficiently displace HIF-1α at equimolar concentration.
Figure 2. CITED2 is an unexpectedly efficient competitor for TAZ1.
a, Portion of superimposed 1H-15N heteronuclear single quantum correlation (HSQC) spectra of 15N-TAZ1 (residues 340-439) in the presence of HIF-1α (black), CITED2 (cyan), and both HIF-1α and CITED2 peptides (red, with fewer contours displayed for clarity). b,c Fluorescence anisotropy data for titration of unlabeled HIF-1α (b) and CITED2 (c) peptides into a pre-formed complex of Alexa Fluor 594-labeled HIF-1α peptide and unlabeled TAZ1. The gray dashed line in (c) represents a simulated curve for KdCITED2 = 10 ± 1 nM (Extended Data Fig. 2). d, Fluorescence anisotropy data for titration of unlabeled HIF-1α peptide into a pre-formed complex of Alexa Fluor 594-labeled CITED2 and unlabeled TAZ1. The gray dashed line represents a simulated curve for KdHIF-1α = 10 ± 2 nM (Extended Data Fig. 2). In b, c, and d, solid black curves represent fits to the data (see Methods). e, Stopped-flow experiment monitoring the change in fluorescence of Alexa Fluor 488-labeled HIF-1α peptide in complex with unlabeled TAZ1 (complex concentration = 0.25 μM) upon rapid mixing with 25 μM HIF-1α (black) or 25 μM CITED2 (gray) peptide. f, Fluorescence intensity of Alexa Fluor 488-labeled HIF-1α peptide in complex with unlabeled TAZ1 (complex concentration = 0.25 μM) upon mixing with 25 μM HIF-1α (black) or 25 μM CITED2 (gray) peptide. In e and f the result of fitting to a single exponential function is shown in red. g, Concentration dependence of observed rates (kobs) from time-resolved fluorescence experiments monitoring HIF-1α (black) and CITED2 (red) peptide competition for TAZ1 binding. The data shown represent the average (circles) and standard deviation (error bars) of three independent measurements. The solid lines are the result of fitting to a linear function.
Following the surprising results from the NMR experiments, the interactions of the HIF-1α and CITED2 activation domains with TAZ1 were characterized by fluorescence anisotropy competition experiments18,19. Unlabeled HIF-1α or CITED2 peptide was titrated into a pre-formed complex of Alexa Fluor 594-labeled HIF-1α peptide bound to unlabeled TAZ1 (Fig. 2b,c). Since the HIF-1α and CITED2 peptides have equal affinities for TAZ1, the two proteins should behave similarly in displacing fluorescently-labeled HIF-1α from the TAZ1 complex. Unlabeled HIF-1α peptide displaces fluorescently-labeled HIF-1α from the TAZ1 complex with an apparent Kd that is the same as the Kd for the binary TAZ1 complex (Kd,appHIF-1α = 10 ± 1 nM versus Kd, binary = 10 ± 2 nM) (Fig. 2b). In contrast, CITED2 is a much more efficient competitor than HIF-1α (Fig. 2c), displacing fluorescently-labeled HIF-1α from its complex with TAZ1 with an apparent Kd of 0.2 ± 0.1 nM, 50-fold smaller than the Kd for the binary TAZ1:CITED2 complex (Kd, binary = 10 ± 1 nM). Thus, both the fluorescence and NMR results indicate that CITED2 is extremely effective in displacing HIF-1α from the TAZ1:HIF-1α complex. Remarkably, the reverse process is inefficient: very high concentrations of HIF-1α peptide are required to displace Alexa Fluor 594-labeled CITED2 peptide from the pre-formed TAZ1:CITED2 complex (apparent Kd = 0.9 ± 0.1 μM, almost 100-fold weaker than the Kd of the binary TAZ1:HIF-1α complex) (Fig. 2d).
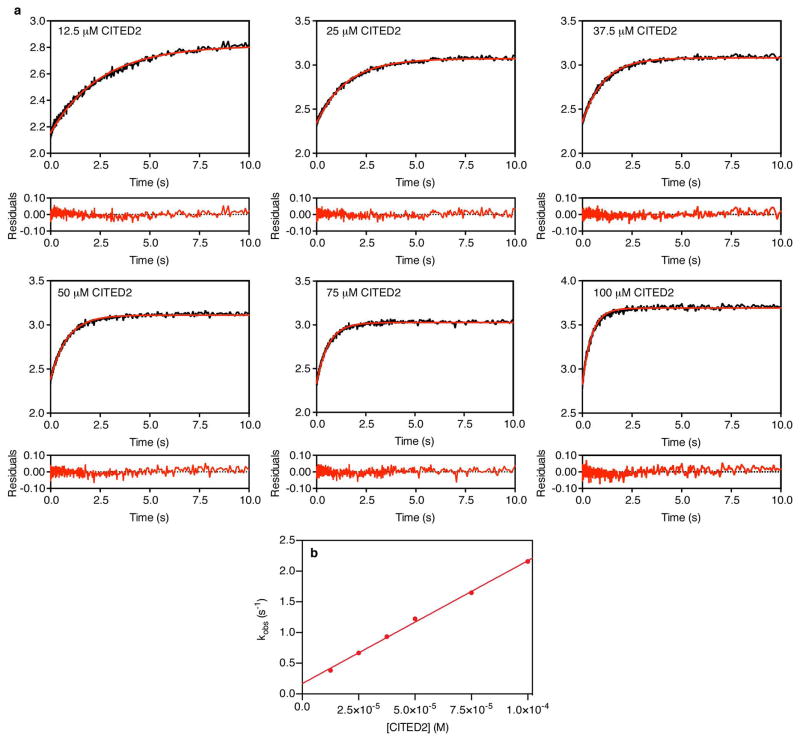
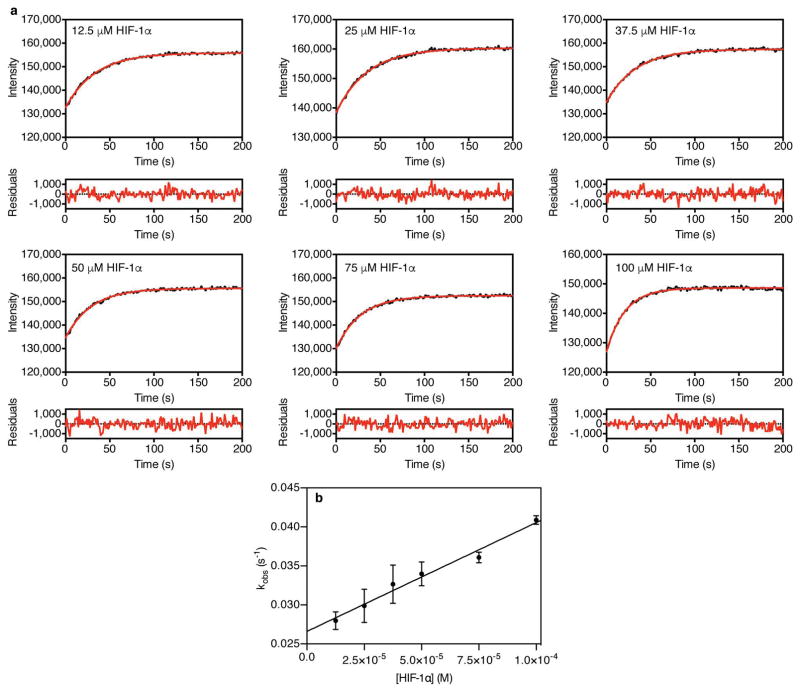
To obtain further insights into the molecular mechanism of HIF-1α displacement by CITED2, stopped flow fluorescence methods were used to measure the rates at which unlabeled HIF-1α or CITED2 peptides displace Alexa Fluor 488-labeled HIF-1α peptide from its complex with unlabeled TAZ1. The difference in the kinetics of HIF-1α and CITED2 competition is striking (Fig. 2e,f, Extended Data Fig. 4,5). CITED2 fully displaces labeled HIF-1α from TAZ1 within 10 seconds (kobs = 2.2 ± 0.02 s−1 at 100 μM competing CITED2) (Fig. 2e,g, Extended Data Fig. 4), whereas unlabeled HIF-1α peptide fails to displace the fluorescently-labeled HIF-1α in this time frame (Fig. 2e, black curve). Instead, displacement by HIF-1α is slow (kobs = 0.04 ± 0.001 s−1 at 100 μM competing HIF-1α) and must be monitored by manual mixing experiments (Fig. 2f,g, Extended Data Fig. 5). Competition by unlabeled HIF-1α peptide is only complete after 200 seconds whereas competition by CITED2 is complete within the 10 second dead time for manual mixing (Fig. 2f, gray curve). The observed rate of dissociation of the fluorescently-labeled HIF-1α peptide is directly proportional to the concentration of the competing CITED2 (Fig. 2g, Extended Data Fig. 4b), strongly suggesting that CITED2 forms a transient ternary complex with TAZ1 and HIF-1α, from which HIF-1α is displaced very rapidly. In the absence of ternary complex formation, dissociation of fluorescently-labeled HIF-1α would be absolutely required before either unlabeled HIF-1α or CITED2 could bind, resulting in identical kinetic profiles for competition by both peptides. Thus, the efficient displacement of HIF-1α from its complex with TAZ1 by CITED2 is kinetically driven and proceeds via a transient ternary intermediate.
Conformational fluctuations in the TAZ1:HIF-1α complex might play a critical role in allowing formation of a ternary complex and modulating competition between HIF-1α and CITED2. The {1H}-15N heteronuclear nuclear Overhauser effect (NOE) reports on dynamics of the protein backbone, with higher NOE values corresponding to ordered regions and lower values indicative of dynamic disorder due to fluctuations on the picosecond-nanosecond timescale. Measurements of the {1H}-15N NOE for the 15N-HIF-1α and 15N-CITED2 transactivation domains in complex with TAZ1 (Fig. 3) show major differences in flexibility. HIF-1α displays a wide range of dynamics throughout its sequence (Fig. 3a). The αB and αC helices adopt well-ordered, structured states with elevated heteronuclear NOE values, while the linker between αB and αC and residues in the N-terminal region, encompassing the αA helix and the LPQL motif, remain highly flexible. In contrast, the distribution of {1H}-15N NOE values is more uniform for residues 222-250 of the CITED2 peptide, with elevated values observed throughout the αA helix, the LPEL motif, and several neighboring residues that form stabilizing interactions in the complex with TAZ1 (Fig. 3b).
Figure 3. HIF-1α and CITED2 bind TAZ1 through both static and dynamic interactions.
{1H}-15N heteronuclear NOE values for 15N-HIF-1α (a) and 15N-CITED2 (b) peptides in complex with TAZ1. The amino acid sequences of the HIF-1α and CITED2 transactivation domains and the positions of the helical motifs formed upon TAZ1 binding are shown above the data. The conserved LP(Q/E)L motif is shown in red. In b, data points to the right of the dashed vertical line are plotted according to the right y-axis. The data shown represent the average (circles) and standard deviation (error bars) of three repeated experiments.
The observation that HIF-1α and CITED2 form both well-ordered and dynamic contacts with TAZ1 (Fig. 3) suggests a critical role for disorder in modulating competition for TAZ1 binding. The αA helices of HIF-1α and CITED2 occupy the same surface of TAZ1 (Fig. 1a), but they exhibit different dynamic characteristics, with HIF-1α retaining considerable flexibility while CITED2 adopts a stable, well-ordered helical structure (Fig. 3). Complete dissociation of HIF-1α from the surface of TAZ1 is not a prerequisite for CITED2 binding; HIF-1α could remain anchored to TAZ1 via its αB and/or αC helices while allowing CITED2 to bind to the opposite face of TAZ1 via its αA helix, displacing the dynamically disordered αA helix of HIF-1α. Simultaneous binding of HIF-1α and CITED2 to TAZ1 would facilitate competition for binding at the common LP(Q/E)L site, providing a rational mechanism for the enhanced dissociation of HIF-1α in the presence of CITED2.
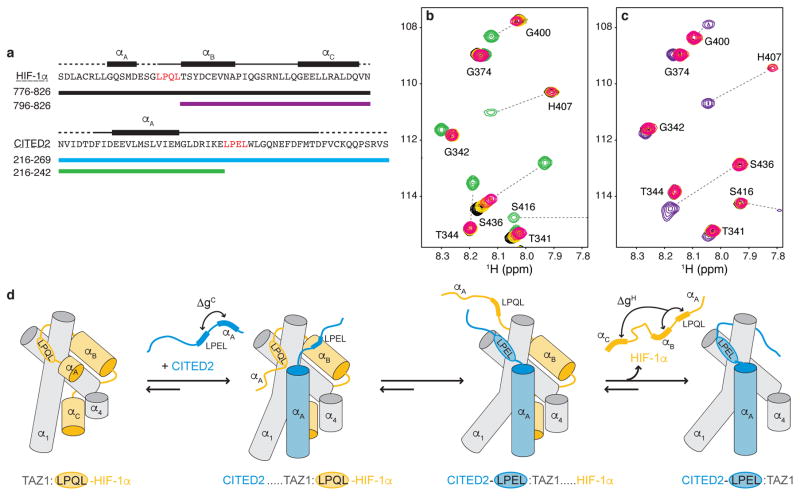
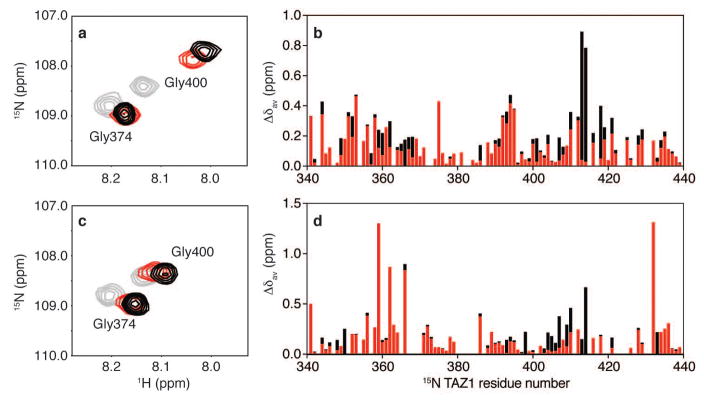
To determine the importance of the LP(Q/E)L motif in modulating competition between the HIF-1α and CITED2 transactivation domains, we designed a truncated CITED2 peptide (CITED2 216-242) encompassing the well-ordered αA helix but lacking the conserved LPEL motif (Fig. 4a). Removal of the LPEL motif and the C-terminal residues results in a drastic reduction in the TAZ1 binding affinity (Kd, binary = 36 ± 10 μM) (Extended Data Fig. 2c,g). Similarly, a truncated HIF-1α peptide (HIF-1α 796-826) lacking the αA region and LPQL motif (Fig. 4a) binds weakly to TAZ1 (Kd, binary = 1.9 ± 0.1 μM) (Extended Data Fig. 2d,g). Despite the observed decrease in TAZ1 binding affinity for these truncated peptides, NMR spectra show that CITED2 216-242 and HIF-1α 796-826 bind to 15N-TAZ1 in the same manner as the corresponding regions of the full-length CITED2 and HIF-1α peptides (Extended Data Fig. 6).
Figure 4. The conserved LP(Q/E)L motif mediates competition between HIF-1α and CITED2.
a, Amino acid sequences of HIF-1α (top) and CITED2 (bottom) transactivation domain peptides and locations of helical motifs. The LP(Q/E)L motif is shown in red. Truncated constructs are indicated by colored bars. b, Superimposed 1H-15N HSQC spectra of 100 μM 15N-TAZ1 in the presence of one molar equivalent of HIF-1α peptide (black), five molar equivalents of CITED2 216-242 (green), and one molar equivalent of HIF-1α peptide plus one (gold), three (orange), or five (magenta) molar equivalents of CITED2 216-242. c, Superimposed 1H-15N HSQC spectra of 100 μM 15N-TAZ1 in the presence of one molar equivalent of CITED2 peptide (cyan), five molar equivalents of HIF-1α 796-826 (purple), and one molar equivalent of CITED2 peptide plus one (gold), three (orange), or five (magenta) molar equivalents of HIF-1α 796-826. The cyan, gold, orange, magenta spectra cross peaks are almost exactly superimposed. d, Schematic mechanism for displacement of HIF-1α from its complex with TAZ1 by CITED2. The α1, α3, and α4 helices of TAZ1 are represented as gray cylinders, HIF-1α is shown in orange, and CITED2 in blue. ΔgC and ΔgH represent thermodynamic coupling23 between the αA and LPEL motifs of CITED2 and between the LPQL-αB and αC motifs of HIF-1α, respectively.
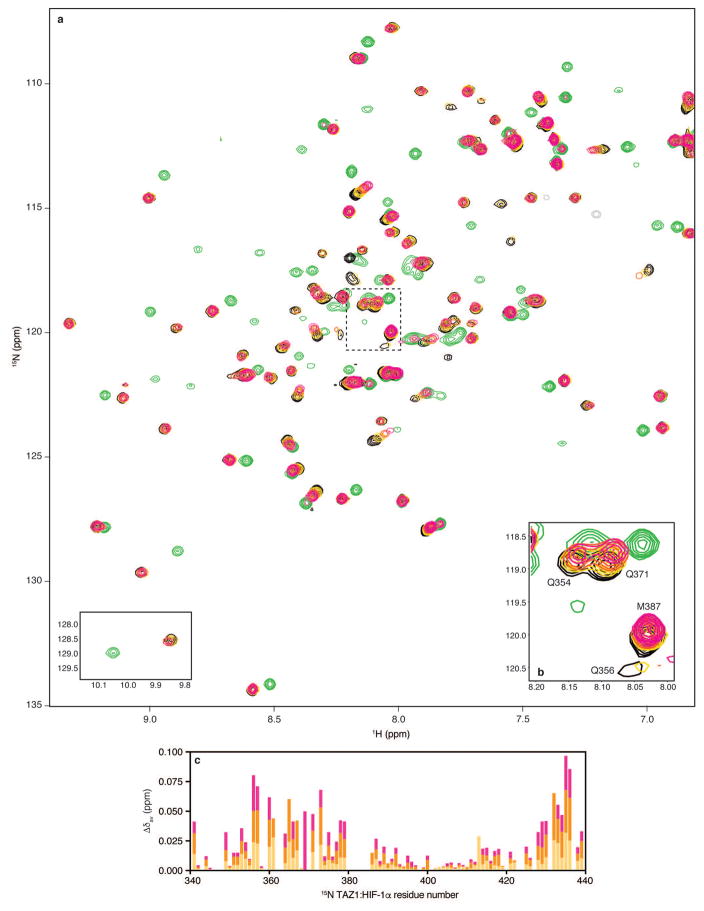
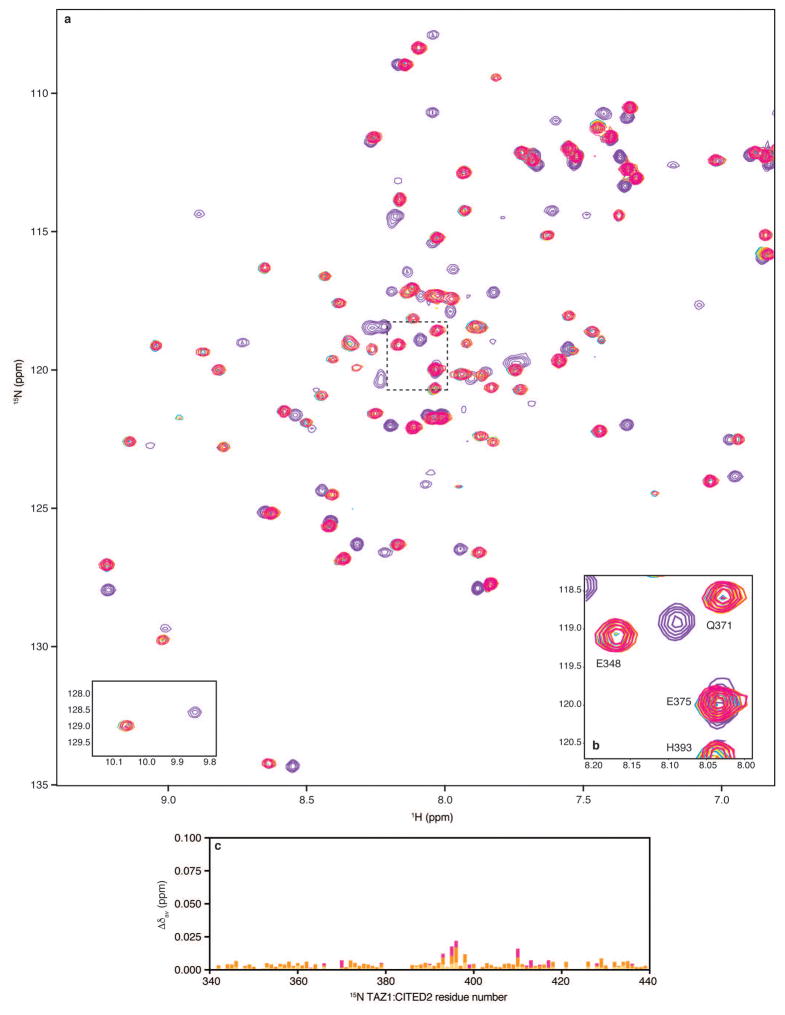
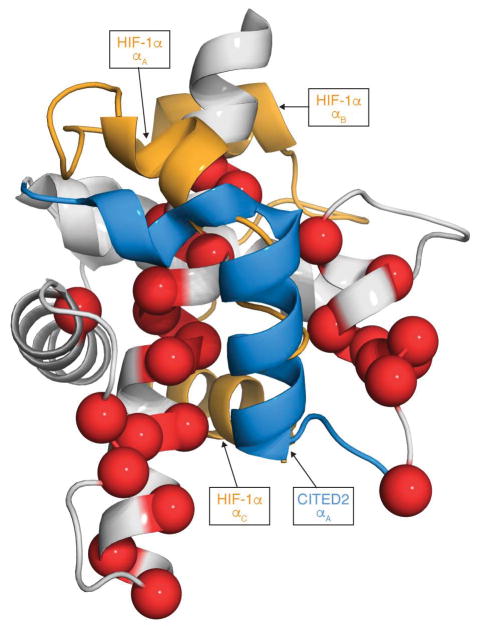
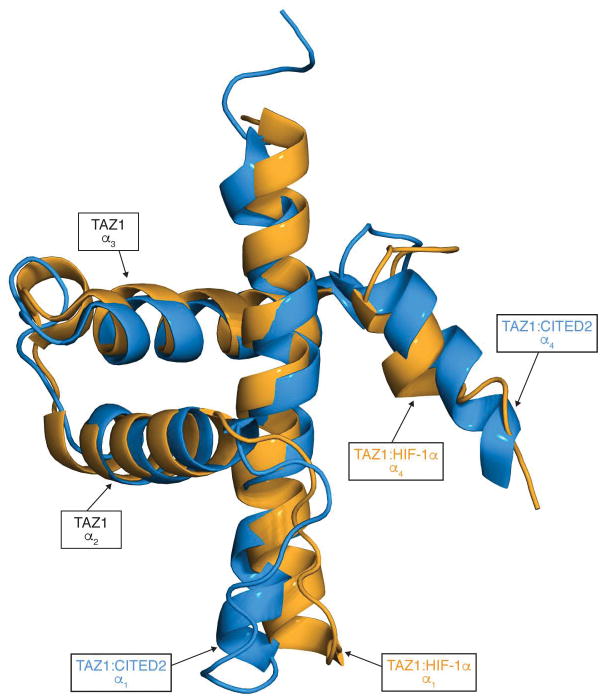
Direct evidence for ternary complex formation was obtained from NMR titrations (Fig. 4 and Extended Data Figs. 7 and 8). When unlabeled CITED2 216-242 peptide was added to a 1:1 complex of 15N-TAZ1 with the full-length HIF-1α activation domain (residues 776-826), chemical shift changes and/or broadening were observed for HSQC cross peaks of TAZ1 residues located in the binding site of the CITED2 αA helix (Fig. 4b and Extended Data Figs 7 and 9), showing clearly that in the absence of the LPEL motif, the N-terminal region of the CITED2 peptide can bind to the TAZ1:HIF-1α complex without displacing the bound HIF-1α. The cross peaks of several residues in the C-terminal region of helix α1 and in helix α4 of TAZ1 are also perturbed by binding of the CITED2 peptide, shifting towards their positions in the spectrum of the TAZ1:CITED2 binary complex as excess peptide is added. These residues correspond to regions where there are differences in structure and relative helix orientation between the HIF-1α and CITED2 complexes (Extended Data Fig. 10). Binding of the truncated CITED2 216-242 peptide to the pre-formed TAZ1:HIF-1α complex is relatively weak, since TAZ1 is in the HIF-1α-bound conformation (orange structure in Extended Data Fig. 10). Importantly, binding of a truncated HIF-1α peptide lacking the LPQL motif (HIF-1α 796-826) to the TAZ1:CITED2 complex appears to be even weaker, with negligibly small changes observed in the HSQC spectrum of the 15N-TAZ1:CITED2 complex upon addition of a five-fold excess of HIF-1α peptide (Fig. 4c and Extended Data Fig. 8), suggesting that the conformation of TAZ1 in its complex with CITED2 (blue structure in Extended Data Fig. 10) does not favor binding of HIF-1α 796-826. This contrasts significantly with binding of HIF-1α 796-826 to free TAZ1, which occurs with a Kd of 1.9 ± 0.1 μM (Extended Data Fig. 2) and leads to large chemical shift changes in the TAZ1 HSQC spectrum (Extended Data Fig. 6). Thus, when TAZ1 is in the CITED2-bound conformation, the affinity for binding the αB-αC region of HIF-1α is greatly decreased.
Our data suggest that HIF-1α and CITED2 function synergistically, forming a hypersensitive unidirectional switch that stimulates release of HIF-1α from its complex with TAZ1 in order to maintain tight control of the transcriptional response to hypoxia. In the absence of such synergy, a large excess of CITED2 would be required to fully displace HIF-1α (hatched line in Fig. 2c); however, CITED2 fully displaces HIF-1α at close to equimolar concentration, creating a highly responsive feedback circuit. These data suggest a mechanistic model, illustrated schematically in Fig. 4d, that involves elements of direct competition, allostery, and differential thermodynamic coupling between distinct binding motifs within the intrinsically disordered CITED2 and HIF-1α peptides. The apparent equilibrium constant for displacement of HIF-1α by CITED2 (Kd,app = 0.2 nM) does not represent the affinity with which CITED2 binds to the TAZ1:HIF-1α complex but is the product of the equilibrium constants for the individual steps. In this model, the CITED2 transactivation domain binds transiently to the TAZ1:HIF-1α complex through its N-terminal region, displacing the dynamic and weakly interacting αA helix of HIF-1α, then competing via an intramolecular process for binding to the LP(Q/E)L site. Plasticity in TAZ1 (denoted by changes in helix length and angle in Fig. 4d) is vital to the operation of the allosteric switch. The CITED2 αA and LPEL motifs act cooperatively to strengthen the interactions between CITED2 and the TAZ1:HIF-1α complex, displace the HIF-1α LPQL motif, and shift the TAZ1 conformational ensemble towards the structure in the CITED2-bound state (Extended Data Fig. 10), thereby weakening the interactions with the αB and αC regions of HIF-1α and promoting rapid HIF-1α dissociation.
The unidirectional nature of the switch arises from differences in the strength of thermodynamic coupling20 between distinct binding motifs in the HIF-1α and CITED2 peptides (denoted by ΔgH and ΔgC in Fig. 4d). The αA and LPEL motifs of CITED2 are strongly coupled and function cooperatively as an integrated binding unit. The intervening amino acids have limited flexibility in the complex with TAZ1 (Fig. 3b), forming a hydrophobic cluster that connects the αA and LPEL binding motifs and packs tightly against the TAZ1 surface. In contrast, the LPQL-αB and αC binding motifs of HIF-1α are separated by a highly dynamic linker in the TAZ1:HIF-1α complex (Fig. 3a), resulting in weak coupling and limited binding cooperativity. The HIF-1α αB and αC regions bind extremely weakly to the TAZ1:CITED2 complex (Fig. 4c) and, since coupling between them is weak, HIF-1α is ineffective in displacing CITED2 from the TAZ1:CITED2 complex.
Fine-tuning of transcriptional output is especially critical in the case of hypoxia since cells must respond rapidly to changes in oxygen levels and uncontrolled expression of oxygen stress genes would lead to unacceptable levels of tissue damage. Here we show that HIF-1α and CITED2 function as a fine-tuned molecular on/off switch for the hypoxic response. This function is entirely dependent on their intrinsic disorder, which allows them to undergo energetically and dynamically heterogeneous interactions with their common target, the TAZ1 domain of CBP/p300. The unique characteristics of IDPs make them well suited for allosteric regulation of cellular signaling21–23. Given the prevalence of disorder in the proteome and the pleiotropic nature of molecular hub proteins such as CBP/p30010,11, we anticipate that the mechanism described here may represent a general regulatory strategy utilized by IDPs to compete for binding of common molecular targets in response to specific stimuli throughout the cell cycle. The existence of such allosteric regulatory mechanisms has important implications for systems biology, since computational modeling of cellular networks on the basis of widely available binary dissociation constants would be invalid when allostery is involved.
Methods
Protein preparation
All HIF-1α and CITED2 constructs (HIF-1α residues 776-826; HIF-1α residues 796-826; CITED2 residues 216-269; CITED2 residues 216-242) were expressed in E. coli BL21 (DE3) [DNAY] as His6-tagged GB1 fusion proteins in a coexpression vector with TAZ1 (residues 340-439 of mouse CBP)24. Cell pellets were resuspended in 40 mL of buffer containing 25 mM Tris pH 8.0, 200 mM NaCl, 8 M urea, and 20 mM imidazole per liter of culture and lysed by sonication. The soluble fraction was isolated by centrifugation. The supernatant was purified by nickel affinity chromatography using NiNTA resin and the HIF-1α and CITED2 peptides were separated from the His6-GB1 tag by thrombin cleavage on the resin. The cleaved HIF-1α and CITED2 peptides were further purified by reversed phase HPLC, using a C4 cartridge (Waters) in standard acetonitrile/TFA mobile phase. Pure HIF-1α and CITED2 peptides were lyophilized and stored at −80 °C. Lyophilized peptides were dissolved in 50 – 100 mM Tris buffer pH 8 and dialyzed overnight against buffer containing 20 mM Tris pH 6.8, 50 mM NaCl, and 2mM DTT prior to use. TAZ1 was expressed and purified under native conditions as described previously25, with additional purity achieved by size-exclusion chromatography on a Superdex 75 column (GE Healthcare) in buffer containing 20 mM Tris pH 8.0, 200 mM NaCl, and 2 mM DTT. Uniform isotopic labeling of 15N-HIF-1α, 15N-CITED2, and 15N-TAZ1 for NMR experiments was performed by expression in minimal media containing 15N ammonium chloride (0.5 g/L) and 15N ammonium sulfate (0.5 g/L) as the sole nitrogen sources.
HIF-1α constructs for fluorescence experiments required additional mutations to allow single-site labeling. The full-length HIF-1α transactivation domain construct (residues 776-826) contains two cysteine residues at positions 780 and 800. A non-perturbing C800V point mutation26 was introduced to allow for fluorescent labeling of HIF-1α at position 780. The native sequence of the truncated HIF-1α construct (residues 796-826) does not contain any cysteine residues. The HIF-1α C-terminus was extended by three residues (Gly-Ser-Cys) to introduce an exposed cysteine residue for labeling. In this extended HIF-1α truncation construct, the C-terminal residue of HIF-1α (Asn826) was mutated to Asp to preserve the native negative charge in this region. All single-Cys HIF-1α mutants were labeled with a 3–5 fold molar excess of Alexa Fluor 488 or Alexa Fluor 594 maleimide dye (Molecular Probes) in 50 mM Tris pH 7.2, 2 mM TCEP. The labeling reaction was carried out overnight at 4 °C. Dye-labeled HIF-1α peptides were separated from free dye and unlabeled peptide on an analytical C18 reverse-phase HPLC column. Full-length CITED2 was labeled with Alexa Fluor 488 or 594 at Cys 261 in the same manner.
GST-TAZ1 for bio-layer interferometry assays was obtained by cloning the TAZ1 sequence (mouse CBP residues 340-439) into the pGEX-4T2 vector. Soluble GST-TAZ1 was purified by affinity chromatography on a glutathione sepharose 4B column followed by size-exclusion chromatography on a Superdex 75 column (GE Healthcare).
Concentration measurements
Protein concentrations were determined by absorbance at 280 nm. For CITED2 (216-242), which does not contain tyrosine or tryptophan residues, concentrations were determined by absorbance at 205 nm27. To ensure that concentrations determined from absorbance measurements at 280 nm and 205 nm are in agreement, we measured the absorbance at both wavelengths for proteins containing tryptophan and tyrosine residues. Protein concentrations determined by both methods were in excellent agreement, with less than 5% variation between concentrations determined by absorbance at 280 nm and 205 nm.
NMR spectroscopy
All NMR samples were prepared in buffer containing 20 mM Tris pH 6.8, 50 mM NaCl, 2 mM DTT, and 5% D2O. Spectra were recorded at 25 °C on Bruker 500, 600 and 900 MHz spectrometers. NMR data were processed using NMRPipe28 and analyzed using SPARKY29. Heteronuclear NOE measurements30 were carried out in triplicate in a fully-interleaved manner on a Bruker DRX 600 MHz spectrometer equipped with a cryo-probe.
Bio-layer interferometry
Bio-layer interferometry experiments were performed using an Octet RED96 instrument (ForteBio) at 25 °C in buffer containing 20 mM Tris pH 6.8, 50 mM NaCl, and 2 mM DTT. Anti-GST biosensors (ForteBio) were pre-equilibrated in buffer for 10 minutes prior to each experiment. Optimal sensor loading was achieved using 25 μg/mL GST-TAZ1 and a loading period of 2 minutes. Dissociation constants (Kd) were determined from binding data obtained with at least three concentrations of HIF-1α or CITED2 peptide. The data were analyzed using the global fitting algorithm included in the Octet Data Analysis Software 7.0 (ForteBio).
Fluorescence anisotropy
Fluorescence anisotropy binding and competition assays were carried out in buffer containing 20 mM Tris pH 6.8, 50 mM NaCl, and 2 mM DTT at 25 °C on an ISS-PC1 photon-counting steady-state fluorimeter. Dissociation constants (Kd) for HIF-1α 776-826, CITED2 216-269, and CITED2 216-242 binding to TAZ1 were determined by a competition method18,19 to enable detection of high-affinity binding and account for any effects of labeling. In this method, 20 nM labeled HIF-1α 776-826 or CITED2 216-269 was initially bound to 250 nM TAZ1. Unlabeled HIF-1α and CITED2 peptides were titrated into the pre-formed complex of labeled peptide with TAZ1 and anisotropy of the fluorescent HIF-1α or CITED2 peptide was recorded at each concentration of competing unlabeled peptide. Data were fit as previously described18,19 using Prism 7.0 (GraphPad Software, Inc.). HIF-1α 796-826 was labeled as described above and unlabeled TAZ1 was titrated directly into a cuvette containing 20 nM fluorescent-labeled HIF-1α 796-826. Anisotropy measurements were carried out after each addition of TAZ1 and the data were fit to a standard one-site binding model using Prism 7.0 (GraphPad Software, Inc.). Anisotropy measurements were carried out three times using different protein preparations. Each competition experiment was performed under carefully controlled conditions, using the same stock solutions of CITED2 and HIF-1α peptides to displace bound, fluorescently labeled CITED2 and HIF-1α peptides from TAZ1. In this way potential errors arising from slight variations in peptide concentration are eliminated. Reported anisotropy values are the average of the three independent measurements, with error bars depicting the standard deviation.
Time-resolved fluorescence measurements
Kinetic curves describing the competition of unlabeled HIF-1α and CITED2 peptides (12.5 μM – 100 μM, after mixing) with a pre-formed complex of Alexa Fluor 488-labeled HIF-1α peptide and unlabeled TAZ1 (0.25 μM after mixing) were obtained by measuring the fluorescence intensity of the labeled HIF-1α peptide as a function of time after mixing with the competing unlabeled peptide. All samples were prepared in buffer containing 20 mM Tris pH 6.8, 50 mM NaCl, and 2 mM DTT. For manual mixing fluorescence experiments, samples were mixed by hand in a quartz cuvette and kinetic traces were obtained by monitoring the fluorescence intensity at 517 nm with an excitation wavelength of 494 nm for 200 seconds on an ISS-PC1 photon-counting steady-state fluorimeter. The delay between mixing and fluorescence detection was 10 s. Observed rates (kobs) were obtained by fitting the kinetic traces to a single exponential decay function using Prism 7.0 (GraphPad Software, Inc.). Each curve was measured three times and reported rates are the average and standard deviation of the three independent measurements.
Stopped flow kinetic traces were obtained using an Applied Photophysics DX-17 stopped flow spectrophotometer operating at 25 °C. Fluorescence intensity was measured for 1–10 seconds after rapid mixing using an excitation wavelength of 488 nm and a 515 nm long-pass cutoff filter for AlexaFluor 488-labeled samples. Data collected in the first 2 ms were removed before fitting to account for the instrumental dead time. 5–10 kinetic traces were averaged and the data were fit to a single exponential decay function using Prism 7.0 (GraphPad Software, Inc.). Data at each concentration of peptide were measured three times and the reported rates are the average and standard deviation of the three independent measurements.
Data availability
All structures referred to in this work have been previously published5,8,25. Coordinates for the TAZ1:HIF-1α5 complex are available under PDB ID: 1L8C and the corresponding NMR data are available under BMRB accession number 5327. Coordinates for the TAZ1:CITED28 complex are available under PDB ID: 1R8U and the corresponding NMR data are available under BMRB accession number 5987. Resonance assignments for the isolated TAZ1 domain of CBP/p300 are available under BMRB accession number 6268 25.
Extended Data
Extended Data Figure 1. Representative 1H-15N HSQC spectra of 15N-TAZ1, 15N-TAZ1 bound to HIF-1α, and 15N-TAZ1 bound to CITED2.
Superimposed 1H-15N HSQC spectra are shown for 15N-TAZ1 in black, 15N-TAZ1 bound to HIF-1α (residues 776-826) in orange, and 15N-TAZ1 bound to CITED2 (residues 216-269) in blue. Selected cross peaks are labeled with residue assignments. The tryptophan indole resonances are shown as an inset in the lower left corner.
Extended Data Figure 2. Determination of binding affinities for HIF-1α and CITED2 peptides by fluorescence anisotropy and bio-layer interferometry (Octet).
a, Fluorescence anisotropy data for titration of unlabeled HIF-1α peptide into a pre-formed complex of Alexa Fluor 594-labeled HIF-1α peptide and unlabeled TAZ1. b, Fluorescence anisotropy data for titration of unlabeled CITED2 peptide into a pre-formed complex of Alexa Fluor 594-labeled CITED2 peptide and unlabeled TAZ1. c, Fluorescence anisotropy data for titration of unlabeled CITED2 216-242 into a pre-formed complex of Alexa Fluor 594-labeled CITED2 peptide and unlabeled TAZ1. d, Fluorescence anisotropy data for titration of unlabeled TAZ1 into Alexa Fluor 488-labeled HIF-1α 796-826. In panels a–d, the data shown represent the average (circles) and standard deviation (error bars) of three independent measurements. e, Representative bio-layer interferometry (Octet) data for HIF-1α 776-826 binding to GST-TAZ1. Data are shown in blue for three concentrations of HIF-1α as marked. The red lines are the result of fitting the data globally to obtain a shared Kd value for the three concentrations shown. f, Representative bio-layer interferometry (Octet) data for CITED2 216-269 binding to GST-TAZ1. Data are shown in blue for three concentrations of CITED2 as marked. The red lines are the result of fitting the data globally to obtain a shared Kd value for the three concentrations shown. g, Tabulated Kd values for the HIF-1α and CITED2 peptides included in this study. N.D. = not determined. The reported Kd values are the average and standard deviation of the Kd values obtained from non-linear least squares fitting of at least three independent sets of experimental data.
Extended Data Figure 3. Monitoring HIF-1α and CITED2 competition for 15N-TAZ1 binding by NMR spectroscopy.
a, Full 1H-15N HSQC spectra from NMR competition experiments with HIF-1α and CITED2 transactivation domain peptides. Superimposed spectra are shown for 15N-TAZ1 in the presence of one molar equivalent of HIF-1α (black), one molar equivalent of CITED2 (cyan), and one molar equivalent of both HIF-1α and CITED2 peptides (red, with fewer contours displayed for visibility). The tryptophan indole amide resonances are shown as an inset in the lower left corner. b, Detailed view of selected 15N-TAZ1 resonances. The spectral region highlighted in panel b is marked by the dotted lines on the full spectra in a. The spectra are displayed as described for a.
Extended Data Figure 4. Monitoring CITED2 competition for TAZ1 binding by stopped-flow fluorescence.
a. Representative time-resolved fluorescence data for rapid mixing of unlabeled CITED2 peptide with Alexa Fluor 488-labeled HIF-1α peptide in a pre-formed complex with unlabeled TAZ1 (complex concentration = 0.25 μM). The data shown are the average of 10 shots. The concentrations of CITED2 used in each experiment are indicated in the upper left corner of each graph. The red lines are fits to a single exponential function, and the residuals from fitting are shown below the graph of the data obtained at each concentration of CITED2. b. Concentration dependence of observed rates (kobs) from time-resolved fluorescence experiments monitoring CITED2 competition for TAZ1 binding, determined from stopped-flow fluorescence measurements. The data shown represent the average (circles) and standard deviation (error bars) of three independent measurements. The solid red line is the result of fitting to a linear function.
Extended Data Figure 5. Monitoring HIF-1α competition for TAZ1 binding by fluorescence.
Representative time-resolved fluorescence data for mixing of unlabeled HIF-1α peptide with Alexa Fluor 488-labeled HIF-1α peptide in a pre-formed complex with unlabeled TAZ1 (complex concentration = 0.25 μM). The data shown are the average of 3 independent measurements. The concentrations of HIF-1α peptide used in each experiment are indicated in the upper left corner of each graph. The red lines are fits to a single exponential function, and the residuals from fitting are shown below the graph of the data obtained at each concentration of HIF-1α. b. Concentration dependence of observed rates (kobs) from time-resolved fluorescence experiments monitoring HIF-1α competition for TAZ1 binding, determined by standard fluorescence intensity measurements. The data shown represent the average (circles) and standard deviation (error bars) of three independent measurements. The solid black line is the result of fitting to a linear function.
Extended Data Figure 6. Binding of full-length and truncated HIF-1α and CITED2 transactivation domain peptides to 15N-TAZ1.
a,c, Representative regions from superimposed 1H-15N HSQC spectra of 15N-TAZ1 bound to HIF-1α and CITED2 peptides. In a, free 15N-TAZ1 is shown in gray, 15N-TAZ1 bound to HIF 796-826 is shown in red, and 15N-TAZ1 bound to HIF 776-826 is shown in black. In c, 15N-TAZ1 is free (gray), bound to CITED 216-242 (red), and bound to CITED 216-269 (black). b, Weighted average 1H-15N chemical shift changes (Δδav) for each 15N-TAZ1 residue upon addition of HIF-1α 776-826 (black) and HIF-1α 796-826 (red). d, Weighted average 1H-15N chemical shift changes (Δδav) for each 15N-TAZ1 residue upon addition of CITED2 216-269 (black) and CITED2 216-242 (red). Weighted average 1H-15N chemical shift changes were calculated as Δδav = [(δH)2 + (δN/5)2]1/2.
Extended Data Figure 7. Monitoring HIF-1α and CITED2 216-242 competition for 15N-TAZ1 binding by NMR spectroscopy.
a, Full 1H-15N HSQC spectra from NMR competition experiments with HIF-1α peptide and CITED2 216-242. Superimposed spectra are shown for 15N-TAZ1 in the presence of one molar equivalent of HIF-1α peptide (black), five molar equivalents of CITED2 216-242 (green), and one molar equivalent of HIF-1α peptide plus one (gold), three (orange), and five (magenta) molar equivalents of CITED2 216-242. The tryptophan indole amide resonances are shown as an inset in the lower left corner. b, Detailed view of selected 15N-TAZ1 resonances. The spectral region highlighted in panel b is marked by the dotted lines on the full spectra in a. The spectra are displayed as described for a. c, Weighted average 1H-15N chemical shift changes (Δδav) for each 15N-TAZ1:HIF-1α residue upon addition of one (gold), three (orange), or five (magenta) molar equivalents of CITED2 216-242. Weighted average 1H-15N chemical shift changes were calculated as Δδav = [(δH)2 + (δN/5)2]1/2.
Extended Data Figure 8. Monitoring CITED2 and HIF-1α 796-826 competition for 15N-TAZ1 binding by NMR spectroscopy.
a, Full 1H-15N HSQC spectra from NMR competition experiments with CITED2 peptide and HIF-1α 796-826. Superimposed spectra are shown for 15N-TAZ1 in the presence of one molar equivalent of CITED2 peptide (cyan), five molar equivalents of HIF-1α 796-826 (purple), and one molar equivalent of CITED2 peptide plus one (gold), three (orange), and five (magenta) molar equivalents of HIF-1α 796-826. The tryptophan indole amide resonances are shown as an inset in the lower left corner. b, Detailed view of selected 15N-TAZ1 resonances. The spectral region highlighted in panel b is marked by the dotted lines on the full spectra in a. The spectra are displayed as described for a. c, Weighted average 1H-15N chemical shift changes (Δδav) for each 15N-TAZ1:CITED2 residue upon addition of one (gold), three (orange), or five (magenta) molar equivalents of HIF-1α 796-826. Weighted average 1H-15N chemical shift changes were calculated as Δδav = [(δH)2 + (δN/5)2]1/2.
Extended Data Figure 9. Location of spectral changes for 15N-TAZ1:HIF-1α upon titration with the CITED2 216-242 peptide.
15N-TAZ1:HIF-1α resonances that shift and/or broaden upon addition of an equimolar amount of CITED2 216-242 are mapped onto the structure of the TAZ1:HIF-1α complex as red spheres. TAZ1 (residues 340-439) is shown in gray and the HIF-1α transactivation domain is shown in orange (residues 776-826). The expected structure of the CITED2 216-242 peptide in complex with TAZ1 is shown in blue. Structural motifs of HIF-1α and CITED2 are labeled for reference.
Extended Data Figure 10. Structural differences in the TAZ1 domain of CBP upon binding HIF-1α and CITED2.
Superposition of the TAZ1 structures in complex with HIF-1α (orange) and CITED2 (blue). The structures of the bound HIF-1α and CITED2 peptides are omitted for clarity, and the TAZ1 helices are labeled for reference.
Acknowledgments
We thank Maria Martinez-Yamout for expert assistance with protein preparation and construct design, Gerard Kroon for NMR support, and Ashok Deniz for fluorimeter access. This work was supported by grant CA096865 from the National Institutes of Health (P.E.W.) and the Skaggs Institute for Chemical Biology. R.B.B. was supported by a postdoctoral fellowship from the American Cancer Society (125343-PF-13-202-01-DMC).
Footnotes
Author Contributions
R.B.B. performed the experiments. R.B.B., H.J.D., and P.E.W. designed experiments, analyzed data, and wrote the manuscript.
The authors declare no conflict of interest.
References
- 1.Semenza GL. Oxygen sensing, hypoxia-inducible factors, and disease pathophysiology. Annu Rev Pathol Mech Dis. 2014;9:47–71. doi: 10.1146/annurev-pathol-012513-104720. [DOI] [PubMed] [Google Scholar]
- 2.Henze AT, Acker T. Feedback regulators of hypoxia-inducible factors and their role in cancer biology. Cell Cycle. 2010;9:2821–2835. doi: 10.4161/cc.9.14.12591. [DOI] [PubMed] [Google Scholar]
- 3.Wang GL, Jiang B, Rue EA, Semenza GL. Hypoxia-inducible factor 1 is a basic-helix-loop-helix-PAS heterodimer regulated by cellular O2 tension. Proc Natl Acad Sci USA. 1995;92:5510–5514. doi: 10.1073/pnas.92.12.5510. [DOI] [PMC free article] [PubMed] [Google Scholar]
- 4.Arany Z, et al. An essential role for p300/CBP in the cellular response to hypoxia. Proc Natl Acad Sci USA. 1996;93:12969–12973. doi: 10.1073/pnas.93.23.12969. [DOI] [PMC free article] [PubMed] [Google Scholar]
- 5.Dames SA, Martinez-Yamout M, De Guzman RN, Dyson HJ, Wright PE. Structural basis for Hif-1α/CBP recognition in the cellular hypoxic response. Proc Natl Acad Sci USA. 2002;99:5271–5276. doi: 10.1073/pnas.082121399. [DOI] [PMC free article] [PubMed] [Google Scholar]
- 6.Freedman SJ, et al. Structural basis for recruitment of CBP/p300 by hypoxia-inducible factor-1α. Proc Natl Acad Sci USA. 2002;99:5367–5372. doi: 10.1073/pnas.082117899. [DOI] [PMC free article] [PubMed] [Google Scholar]
- 7.Bhattacharya S, et al. Functional role of p35srj, a novel p300/CBP binding protein, during transactivation by HIF-1. Genes Devel. 1999;13:64–75. doi: 10.1101/gad.13.1.64. [DOI] [PMC free article] [PubMed] [Google Scholar]
- 8.De Guzman RN, Martinez-Yamout M, Dyson HJ, Wright PE. Interaction of the TAZ1 domain of CREB-binding protein with the activation domain of CITED2: regulation by competition between intrinsically unstructured ligands for non-identical binding sites. J Biol Chem. 2004;279:3042–3049. doi: 10.1074/jbc.M310348200. [DOI] [PubMed] [Google Scholar]
- 9.Freedman SJ, et al. Structural basis for negative regulation of hypoxia-inducible factor-1α by CITED2. Nat Struct Biol. 2003;10:504–512. doi: 10.1038/nsb936. [DOI] [PubMed] [Google Scholar]
- 10.Wright PE, Dyson HJ. Intrinsically disordered proteins in cellular signalling and regulation. Nat Rev Mol Cell Biol. 2015;16:18–29. doi: 10.1038/nrm3920. [DOI] [PMC free article] [PubMed] [Google Scholar]
- 11.Berlow RB, Dyson HJ, Wright PE. Functional advantages of dynamic protein disorder. FEBS Lett. 2015;589:2433–2440. doi: 10.1016/j.febslet.2015.06.003. [DOI] [PMC free article] [PubMed] [Google Scholar]
- 12.Van Roey K, et al. Short linear motifs: ubiquitous and functionally diverse protein interaction modules directing cell regulation. Chem Rev. 2014;114:6733–6778. doi: 10.1021/cr400585q. [DOI] [PubMed] [Google Scholar]
- 13.Jaakkola P, et al. Targeting of HIF-α to the von Hippel-Lindau ubiquitylation complex by O2-regulated prolyl hydroxylation. Science. 2001;292:468–472. doi: 10.1126/science.1059796. [DOI] [PubMed] [Google Scholar]
- 14.Lando D, Peet DJ, Whelan DA, Gorman JJ, Whitelaw ML. Asparagine hydroxylation of the HIF transactivation domain: a hypoxic switch. Science. 2002;295:858–861. doi: 10.1126/science.1068592. [DOI] [PubMed] [Google Scholar]
- 15.Jewell UR, et al. Induction of HIF-1α in response to hypoxia is instantaneous. FASEB J. 2001;15:1312–1314. [PubMed] [Google Scholar]
- 16.Kohn KW, et al. Properties of switch-like bioregulatory networks studied by simulation of the hypoxia response control system. Mol Biol Cell. 2004;15:3042–3052. doi: 10.1091/mbc.E03-12-0897. [DOI] [PMC free article] [PubMed] [Google Scholar]
- 17.Shin DH, et al. CITED2 mediates the paradoxical responses of HIF-1[alpha] to proteasome inhibition. Oncogene. 2008;27:1939–1944. doi: 10.1038/sj.onc.1210826. [DOI] [PubMed] [Google Scholar]
- 18.Lee CW, Ferreon JC, Ferreon AC, Arai M, Wright PE. Graded enhancement of p53 binding to CREB-binding protein (CBP) by multisite phosphorylation. Proc Natl Acad Sci USA. 2010;107:19290–19295. doi: 10.1073/pnas.1013078107. [DOI] [PMC free article] [PubMed] [Google Scholar]
- 19.Roehrl MHA, Wang JY, Wagner G. A general framework for development and data analysis of competitive high-throughput screens for small-molecule inhibitors of protein–protein interactions by fluorescence polarization. Biochemistry. 2004;43:16056–16066. doi: 10.1021/bi048233g. [DOI] [PubMed] [Google Scholar]
- 20.Motlagh HN, Li J, Thompson EB, Hilser VJ. Interplay between allostery and intrinsic disorder in an ensemble. Biochem Soc Trans. 2012;40:975–980. doi: 10.1042/BST20120163. [DOI] [PMC free article] [PubMed] [Google Scholar]
- 21.Ferreon AC, Ferreon JC, Wright PE, Deniz AA. Modulation of allostery by protein intrinsic disorder. Nature. 2013;498:390–394. doi: 10.1038/nature12294. [DOI] [PMC free article] [PubMed] [Google Scholar]
- 22.Garcia-Pino A, et al. Allostery and intrinsic disorder mediate transcription regulation by conditional cooperativity. Cell. 2010;142:101–111. doi: 10.1016/j.cell.2010.05.039. [DOI] [PubMed] [Google Scholar]
- 23.Motlagh HN, Wrabl JO, Li J, Hilser VJ. The ensemble nature of allostery. Nature. 2014;508:331–339. doi: 10.1038/nature13001. [DOI] [PMC free article] [PubMed] [Google Scholar]
- 24.Sugase K, Landes MA, Wright PE, Martinez-Yamout M. Overexpression of post-translationally modified peptides in Escherichia coli by co-expression with modifying enzymes. Prot Express Purif. 2008;57:108–115. doi: 10.1016/j.pep.2007.10.018. [DOI] [PMC free article] [PubMed] [Google Scholar]
- 25.De Guzman RN, Wojciak JM, Martinez-Yamout MA, Dyson HJ, Wright PE. CBP/p300 TAZ1 domain forms a structured scaffold for ligand binding. Biochemistry. 2005;44:490–497. doi: 10.1021/bi048161t. [DOI] [PubMed] [Google Scholar]
- 26.Gu J, Milligan J, Huang LE. Molecular mechanism of hypoxia-inducible factor 1alpha -p300 interaction. A leucine-rich interface regulated by a single cysteine. J Biol Chem. 2001;276:3550–3554. doi: 10.1074/jbc.M009522200. [DOI] [PubMed] [Google Scholar]
- 27.Anthis NJ, Clore GM. Sequence-specific determination of protein and peptide concentrations by absorbance at 205 nm. Protein Sci. 2013;22:851–858. doi: 10.1002/pro.2253. [DOI] [PMC free article] [PubMed] [Google Scholar]
- 28.Delaglio F, et al. NMRPipe: a multidimensional spectral processing system based on UNIX pipes. J Biomol NMR. 1995;6:277–293. doi: 10.1007/BF00197809. [DOI] [PubMed] [Google Scholar]
- 29.Goddard TD, Kneller DG. SPARKY. 2006;3 [Google Scholar]
- 30.Ferrage F, Cowburn D, Ghose R. Accurate sampling of high-frequency motions in proteins by steady-state 15N-{1H} nuclear Overhauser effect measurements in the presence of cross-correlated relaxation. J Am Chem Soc. 2009;131:6048–6049. doi: 10.1021/ja809526q. [DOI] [PMC free article] [PubMed] [Google Scholar]
Associated Data
This section collects any data citations, data availability statements, or supplementary materials included in this article.
Data Availability Statement
All structures referred to in this work have been previously published5,8,25. Coordinates for the TAZ1:HIF-1α5 complex are available under PDB ID: 1L8C and the corresponding NMR data are available under BMRB accession number 5327. Coordinates for the TAZ1:CITED28 complex are available under PDB ID: 1R8U and the corresponding NMR data are available under BMRB accession number 5987. Resonance assignments for the isolated TAZ1 domain of CBP/p300 are available under BMRB accession number 6268 25.


