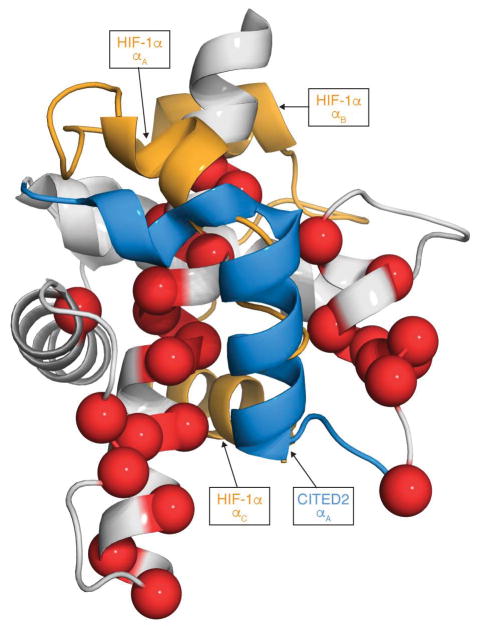
Extended Data Figure 9. Location of spectral changes for 15N-TAZ1:HIF-1α upon titration with the CITED2 216-242 peptide.
15N-TAZ1:HIF-1α resonances that shift and/or broaden upon addition of an equimolar amount of CITED2 216-242 are mapped onto the structure of the TAZ1:HIF-1α complex as red spheres. TAZ1 (residues 340-439) is shown in gray and the HIF-1α transactivation domain is shown in orange (residues 776-826). The expected structure of the CITED2 216-242 peptide in complex with TAZ1 is shown in blue. Structural motifs of HIF-1α and CITED2 are labeled for reference.

