Abstract
Background:
There is a need to assess the accuracy of continuous glucose monitoring (CGM) systems for several uses. Mean absolute relative difference (MARD) is the measure of choice for this. Unfortunately, it is frequently overlooked that MARD values computed with data acquired during clinical studies do not reflect the accuracy of the CGM system only, but are strongly influenced by the design of the study. Thus, published MARD values must be understood not as precise values but as indications with some uncertainty.
Data and Methods:
Data from a recent clinical trial, Monte Carlo simulations, and assumptions about the error distribution of the reference measurements have been used to determine the confidence region of MARD as a function of the number and the accuracy of the reference measurements.
Results:
The uncertainty of the computed MARD values can be quantified by a newly introduced MARD reliability index (MRI), which independently mirrors the reliability of the evaluation. Thus MARD conveys information on the accuracy of the CGM system, while MRI conveys information on the uncertainty of the computed MARD values.
Conclusions:
MARD values from clinical studies should not be used blindly but the reliability of the evaluation should be considered as well. Furthermore, it should not be ignored that MARD does not take into account the key feature of CGM sensors, the frequency of the measurements. Additional metrics, such as precision absolute relative difference (PARD) should be used as well to obtain a better evaluation of the CGM performance for specific uses, for example, for artificial pancreas.
Keywords: continuous glucose monitoring, diabetes therapy, quality of measurement, glucose measurement, blood glucose
New generations of continuous glucose monitoring (CGM) systems enter the market each and every year. With an increasing interest in CGM devices, assessing their performance has become also the longer the more important.1 An essential aspect of performance is accuracy, the ability of the CGM device to correctly indicate the glucose concentration it is exposed to. Accuracy is known to vary according to several factors, like the blood glucose (BG) range, but the mean absolute relative difference (MARD) has become popular for being a simple metric, a single value which in some sense summarizes the overall accuracy of the CGM. Its simplicity is also the main reason why it has been used to compare different systems and even to suggest a threshold for non adjunctive use of CGM instead of self-monitoring of blood glucose (SMBG).2
In practice, MARD is obtained using data from clinical trials. To compute its value, the real value of the BG should be known. Unfortunately, in clinical trials absolute methods for BG measurements cannot be used, and therefore other quantities are used instead, the so called reference measurements which are supposed to be quite near to the real value. Thus the MARD is computed using the difference between the CGM readings and the values measured at the same time by the reference measurement system.3-13 This was quite acceptable as long as the performance of the CGM devices was not very good but, as we shall see, it can produce a substantial error in the computation for modern devices.
It is frequently overlooked that MARD is an average value of a stochastic variable, that is, a variable whose value is subject to variations due to chance. Actually, this is true for every measurement, and the key difference between precise and less precise devices is the extent of these variations, not their absence or presence. Average values of stochastic variables tend to converge to the same value only if the measurement sets are large enough, and this is seldom the case for clinical trials.
As shown in a previous article,14 all this leads to the fact that the interpretation of MARD values is not straightforward. In particular, the MARD value computed using data from a clinical trial does not reflect the performance of a given device alone—the “true” value—but also the protocol of the clinical trial in which the data have been collected, in particular the accuracy of the reference device—which is not perfect—and the number of paired points used for the computation. This explains why different studies may provide different MARD values for the very same CGM device.
Concept
To correctly use MARD values, the study-related uncertainty should be considered. The current article suggests estimating this uncertainty on the basis of a well known concept from statistics, the confidence interval (see, eg, Sivia and Skilling15 for the mathematical background). Roughly speaking, a confidence interval indicates the range around the computed value in which the real value will lie with a given probability. For example, a 95% confidence interval means the range around the computed value in which the “true” MARD, the one that corresponds to the accuracy of the device, will lie with a probability ˠ of 95%.
The rationale of this approach can be better understood by looking at an example of a measurement profile shown in Figure 1 (from Freckmann et al5) and seeing how MARD evolves. The figure includes the readings of 1 CGM system as well as the paired reference values measured in irregular intervals. It also includes a smoothed and time shifted continuous curve computed by recalibration of the CGM output using the technique described in Del Favero et al,16 the “real” BG profile so to say. This curve cannot be computed on-line, so it is not available to the patient, but it is of help to understand the origin of the differences between a CGM profile and the BG profile.
Figure 1.
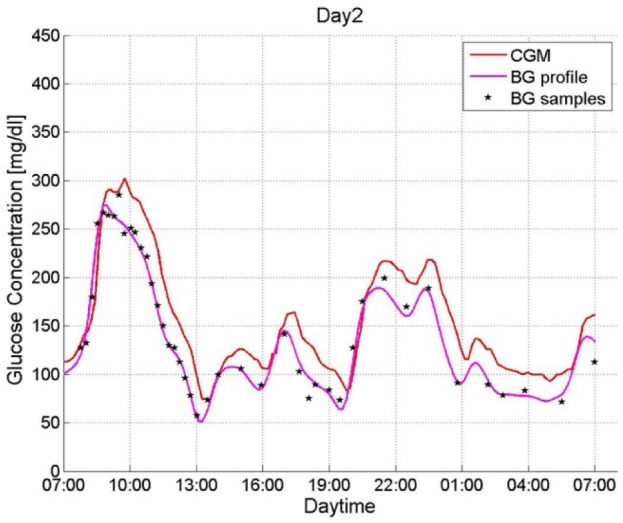
Measured CGM data, paired BG measurements, and calculated BG profiles (patient B1_01, day 2).
A MARD value can be computed as soon as the first paired measurements of CGM and reference device are available. If this is done, a result will be obtained even for very few paired points. However, one cannot feel confident that this result will be correct, and it has to be assumed that the real value will be somewhere near to the computed one, but not likely the one that was just computed. Indeed, the actual value will depend on which paired points have been used, the so called sampling effect. The well known significance level p is a metric used to determine how likely it is that this sampling effect leads to a false conclusion, for instance assuming that a given therapy has an effect when in reality it has none. The confidence interval is a related concept to obtain boundaries inside which, roughly speaking, the target quantity—in this case MARD—will lie with a given probability ˠ.
Figure 2 shows how the boundaries of uncertainty become tighter with an increasing number of paired points. With 100 points the true MARD value is expected to lie between 8.2% and 12%, after 5.000 points the confidence interval would be reduced to a range between 9.8% and 10.4%.
Figure 2.
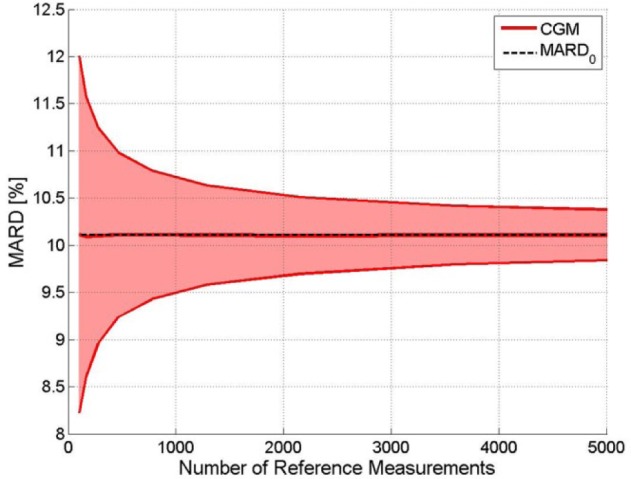
Exemplary CGM. Impact of the number of paired points on the uncertainty of MARD: upper and lower bounds of the confidence interval with probability γ = .95. The constant line represents the value to which it would converge.
While hardly anybody will be surprised by the fact that increasing the number of paired points improves the quality of the estimation, not everybody is as well aware of the extent of this effect. In particular, in practice the number of paired points will be rather small. In other words, one tends to be much nearer to the “bad end” of the plot of Figure 2.
Note also that a confidence level of 95% is common, but somewhat arbitrary. Using larger values of confidence yields similar plots, albeit with wider intervals.
While there is a wide awareness of some of the risks associated with sampling, the same is not true for the second main cause of the uncertainty, the choice of the reference system. Indeed, many different reference systems are used, from laboratory analyzers to commercial SMBG devices. All these reference systems are subject to errors. If we consider both effects, it turns out that the confidence interval is affected greatly but differently by the 2 causes. Figure 3 shows this using the same data:5 The confidence region of MARD is shown on the y-axis against the uncertainty of the reference measurement system on the x-axis and the number of paired points is indicated by the color code. The true value of MARD is indicated by a continuous black line to stress the fact that the performance of the sensor does not depend on the study design, but the value we obtain from the study does.
Figure 3.
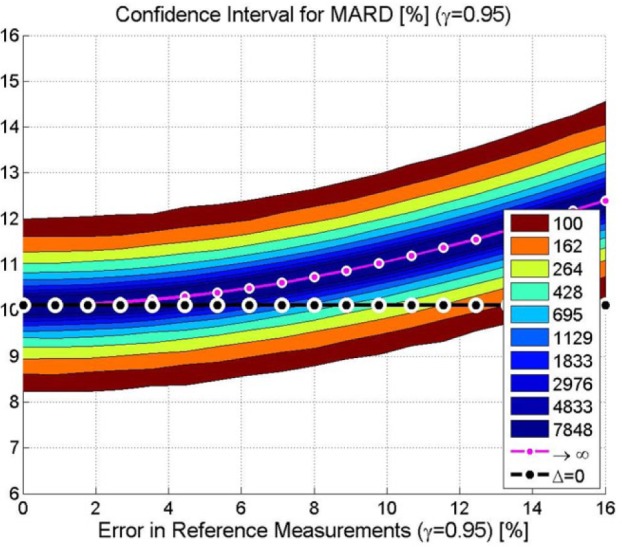
Exemplary CGM. Confidence region of the MARD on the y-axis depending on the number of paired measurement points (see color code in the insert) and accuracy of the reference measurement system on the x-axis (black line: “true” MARD, purple line: MARD for number of paired points toward infinity).
Assume now for a moment that the reference measurement is exactly equal to the BG, that is, there is no accuracy error (indicated as 0%). The graph yields for 100 paired points (the outer dark red lines) the values of 8.2% and 12% for the confidence interval, of course the same values as in the graph of Figure 2. Increasing the number of paired points leads to tighter intervals. We can estimate the value we would obtain for an infinite number of paired points—the correct one.
Take into account now the limited accuracy of the reference measurement, for example, an accuracy error of, say, 6%. The width of the confidence interval is not very different, but it is displaced, there is a positive offset. The range now goes from 8.5% to 12.4%. Even taking an infinite number of points would not remove this effect, we would land to the point on the purple line. In other words, the MARD computed from the study is increased by the errors of the reference measurements, and no increase in the number of paired points will remove it. This was not critical when the performance of CGM devices was quite poor, but with the new generations, it can lead to wrong conclusions.
There are more factors14 which can be considered, but some—like the distribution of points—can be taken care of in most cases, and others—like the time delay—should not be removed because they do not reflect the precision of the CGM but they are relevant for the patient for his/her clinical experience as long as capillary blood glucose concentration is the reference for therapy decisions.
For these reasons, in this article we focus on providing simple tools to assess this uncertainty range. To this end we also propose a MARD reliability index (MRI) which in some way summarizes the uncertainty of the study. Of course, the uncertainty can be assessed a priori in the study design phase, but this can also be done retrospectively, for instance to understand whether different results are comparable, or the differences should be understood more in terms of statistical than clinical uncertainty. Roughly speaking, it is the responsibility of the CGM manufacturer to achieve the performance of its own device, but it is the responsibility of the designer of the clinical trial to make sure that the trial reflects this performance—in our case the accuracy—with the desired level of certainty.
Methods and Results
Computation of the MARD
The MARD is based on the comparison between paired measurements of a given CGM system and a reference method. MARD is computed as mean value of the absolute relative differences (ARD) where is the value measured by the CGM device, is the value measured by the reference measurement device at where are the times when reference measurements are available.
Please notice that in this article MARD always stands for the mean absolute relative difference, and never the median absolute relative difference. The median absolute relative difference, however, is calculated in a very similar way (median of all values ARDk) and the results presented here could also be calculated for the median absolute relative difference (and look very similar).
Clinical Data
For the current work CGM recordings from a recent clinical study performed at the Institute for Diabetes Technology (IDT), Germany, have been used.5 During this study 12 subjects with type 1 diabetes mellitus (T1DM) spent 7 days at IDT wearing 6 CGMs in parallel, among them 2 FreeStyle® Navigator I (Abbott Diabetes Care, Alameda, CA). The study has been performed according to the recommendation of the CLSI guideline POCT05-A,17 including induced glucose excursions. During this study, reference measurements have been collected by means of SMBG once per hour during the day and at least once during the night using the FreeStyle Navigator’s built-in BG meter with the corresponding test stripes. The same device has been used to calibrate all CGM systems according to the manufacturer specifications. Furthermore, venous blood samples have been taken at specified times in parallel to SMBG and have been analyzed for the plasma glucose concentration by means of YSI 2300 STAT Plus (YSI, Yellow Springs, OH). Details of the study can be seen in Freckmann et al.5
In this article, for sake of simplicity only data from 1 of the FreeStyle Navigator devices alone is presented (in this article often referred to as “exemplary CGM”), but analogous results have been obtained for all sensors.
All analyses described in this document have been performed using the entire CGM recordings for each individual together with the corresponding SMBG data. The sparse YSI measurements have only been used to quantify the reliability of the SMBG system but not for the MARD computations.
Continuous BG Profiles and the Number of Paired Points
As already stated, a key factor which affects the estimation of MARD is the number of paired points used. Indeed, as MARD is computed using measured values which include stochastic components, MARD itself is also a stochastic quantity. If the stochastic components have zero mean, as they frequently are assumed to be, they will cancel each other and their effects will decrease with an increasing number of paired points, as already shown phenomenologically in Kirchsteiger et al14 by dropping some values.
That analysis can be extended for this analysis by using a retrospective interpolation of the reference measurements described in Del Favero et al.16 In this way, we can assign a reference value to each CGM measurement. If we use all these points, we obtain the best approximation of the “real” MARD in terms of number of paired points. Such MARD values (in this article referred to as MARD0 value) have been determined for all 6 CGM devices used in the trial5 (for all 12 subjects combined). These MARD0 values are lower than the MARD values stated in Freckmann et al5 due to the fact that the error in the reference measurement system has not yet been considered. For example for the FreeStyle Navigator traces used for obtaining the results presented in this article a MARD0 of 10.1 % was calculated, whereas in Freckmann et al5 a MARD of 12.1 % is stated.
The effect of using fewer paired points can be computed as in Kirchsteiger et al14 by dropping randomly some paired points. The results have already been shown in Figure 3 for aforementioned exemplary CGM device and a confidence interval ˠ = 0.95.
MARD and the Accuracy of Reference Measurements
Of course not only CGM systems have a limited accuracy, the same holds for any measurement device, including those used to provide the reference measurements, especially when BG meters (see, eg, Freckmann et al18) and not laboratory devices are used to this end (see Delatour et al19). This effect however is often ignored when computing MARD, even though it was shown in Kirchsteiger et al14 that it can be potentially enormous.
To study this effect Monte Carlo simulations of BG profiles perturbed by random noise have been performed. The error of the reference measurement device was assumed to be uncorrelated and Gaussian (mean error: 0%, accuracy error [expressed by the confidence interval, γ = .95]: errref). No bias was considered as the CGM calibration was done with the same reference device. The effect of this error on the ARD can be computed by extending the basic formula as follows:
Figure 4 shows the impact of an error in the reference measurements for the same exemplary CGM device as before. Notice that an increase of the error of the reference does increase slightly the uncertainty (seen by the thickness of the red line) but primarily increases the value of MARD. Roughly speaking: the MARD computed from a clinical study is the sum of the MARD of the device and of the MARD of the reference system. With the continuous improvement of CGM systems, a MARD value computed from data from a clinical study in which SMBG has been used as reference may turn out to be more of an evaluation of the accuracy of the SMBG rather than of the CGM.
Figure 4.
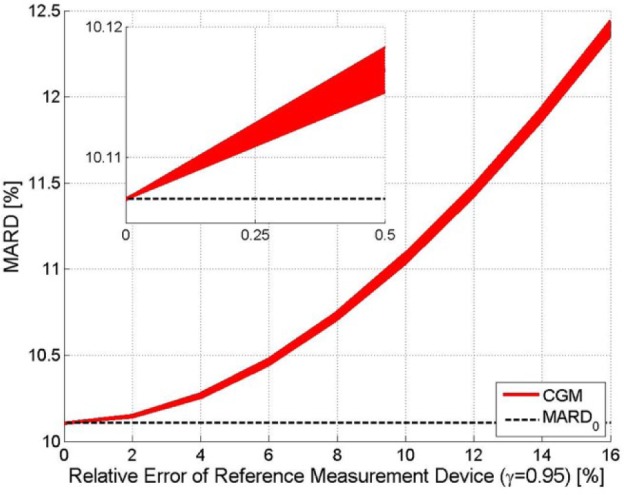
Exemplary CGM. Effect of the relative error in the reference measurements on MARD (confidence interval, γ = .95). The width of the line indicates the confidence interval, the distance to the MARD0 (black dashed line) reflects the error introduced by the error in the reference measurement.
The results shown have been obtained using the entire vector of paired points. For a lower number of reference points this width would be larger.
In practice both effects discussed so far, the limited number of paired points and the limited accuracy of the reference measurements, appear jointly. An example for the resulting distribution of MARDs as a function of both quantities has been shown in Figure 3.
Other Effects
As can be expected and has been shown in Kirchsteiger et al,14 there are more effects that influence the MARD from clinical studies, in particular:
The distribution of the paired points with respect to the BG range
The time delay between BG and the CGM values and (related thereto) the rate of change in BG
It is well known that the accuracy of CGM systems differs by BG range (see, eg, Rodbard20). In particular, it is obvious that the MARD value will reflect the accuracy only in the ranges in which a sufficient number of measurements have been collected—that was one of the reasons behind the guideline.17 Different distributions of paired points can affect the computation of MARD.14 However, it is easy to compensate this effect using a weighted form of the MARD computation which will be described elsewhere. For the current work it was assumed that the distribution of paired points as from the clinical trial5 is representative for trials conducted according to the guideline.17 Of course, a stronger standardization of the study protocols of trials designed for the performance assessment of CGM systems to obtain a better distribution should be envisioned.
CGM time delays also have of course an influence on the MARD, with higher time delays normally leading to larger differences between CGM values and paired reference measurements, which is especially true during pronounced glucose swings. Indeed, it has been shown in Pleus et al21 that CGM systems with comparable overall MARD values but different time delays differ significantly in accuracy during pronounced swing phases, also depending on the direction of change.
However, from the patient point of view, these time delays should not be removed as they influence the readings and the patient has no way to compensate them. From the point of view of study design, the number and intensity of glucose swings included in the data used for the CGM performance assessment does of course influence MARD, with a higher proportion of swings typically leading to higher MARD values. Since this effect is more difficult to quantify or to compensate, it should best be tackled by assuring that CGM systems are all assessed under similar test conditions or ideally in head-to-head trials (as, eg, in Freckmann et al5).
In the following we shall not consider these issues even though they are important.
MARD Reliability Index
The main advantage of MARD is its simplicity, so it is natural to look for a simple metric to quantify the reliability of the MARD computation. Such a reliability index MRI (MARD Reliability Index) is proposed here.
The index used in this article has been computed with the following formula:
where p(MARD) is the probability density function (PDF) of MARD (for a given number of reference measurements and a known error to the reference measurements system), whereas 0.95 is the desired level of confidence (for 95 % confidence). MRI corresponds to the size of an interval around MARD0 so that it can be said with a confidence of 95 % that the MARD from a clinical trial lies within the interval MARD0±MRI. MRI gives thus a conservative estimate for the error in MARD.
For the case of a very high accuracy of the reference measurements system the probability of obtaining a given value of MARD (the probability density function, or PDF) will be centered around MARD0—the value corresponding to a very high number of measurements. This is shown in the left (dashed curve) in Figure 5. Increasing the number of paired points will narrow the PDF. An infinite number of paired points would of course deliver exactly MARD0.
Figure 5.
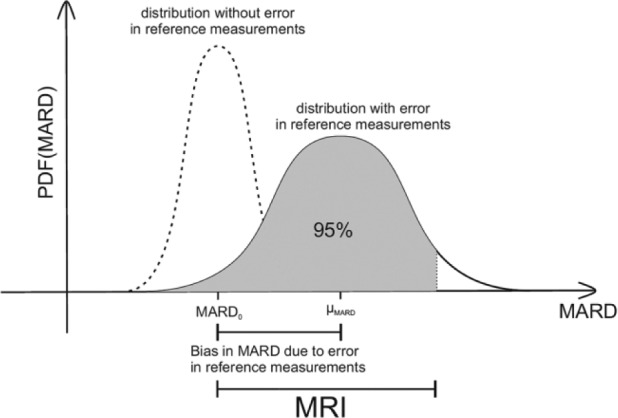
Combined effect of number of paired measurements and accuracy of the reference measurements on the uncertainty of MARD, here expressed by MRI.
Adding the effect of the error of the reference system, leads to the solid curve on the right side of Figure 5. Notice that this curve is no longer centered around MARD0 but is displaced by the average value of the error of the reference system (μMARD in Figure 5) toward higher MARD values. In other words, the errors of the CGM and the error of the reference measurement are somehow added in the computed MARD value.
In other words, MRI corresponds roughly to the width of the confidence interval of MARD with γ = .95. More precisely, MRI is the value such that the integral, that is, the area under the PDF curve, from MARD0-MRI till MARD0+MRI (ie, the gray area in Figure 5) adds up to the desired certainty, in our case .95.
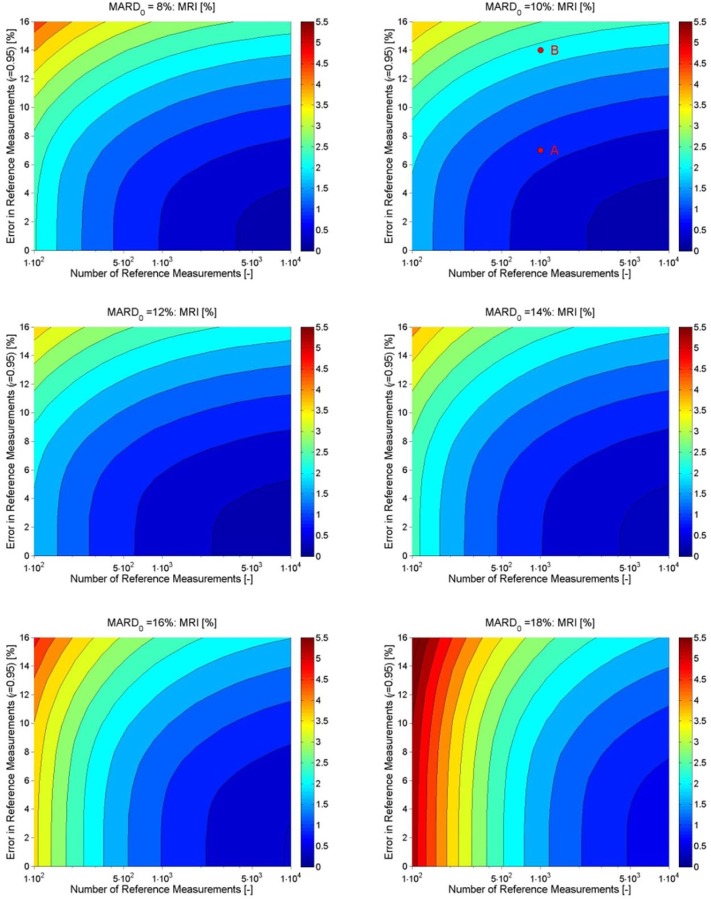
Exemplary results for MRI are shown in Figure 6. As expected, a higher accuracy of the reference measurement and a higher number of paired points corresponds to a smaller MRI, in the direction of the lower right corner.
Figure 6.
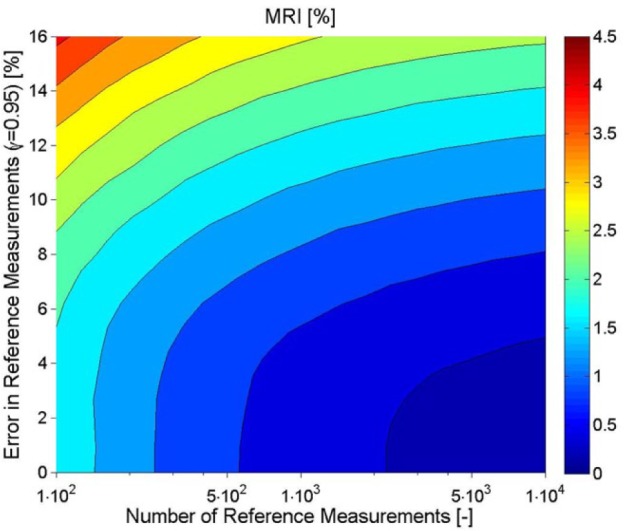
Exemplary CGM. Effect of number and accuracy error of the reference measurements on the uncertainty of MARD (expressed by MRI indicated by the color code).
However, there is another key message of this figure which might be less obvious—improving only the accuracy of the reference or increasing only the number of paired points used is not the sensible approach because it will not improve the quality of the estimation of MARD beyond a given threshold. For instance, if 250 paired points are used, reducing the error of the reference measurement below 4% will not improve the confidence. Conversely, if the accuracy is low, say 10%, using 4000 or 10 000 points will hardly make a difference. As in practice the number of available paired points will be limited, it follows that there is a threshold for the accuracy of the reference beyond which an improvement does not help. They must be improved jointly.
Notice, finally, that the plot depends to some extent on the MARD0 value of the CGM. Figure 7 shows the same plot for different MARD0 values. These have been plotted by analyzing the entire dataset of Freckmann et al5 and by quantifying the effect of the CGM MARD0 on MRI. Notice that the accuracy of the reference measurement is much more important for more precise CGM sensors, that is, the correct choice of the reference device will be the longer the more important for the new generations of devices.
Figure 7.
Effect of number and accuracy error of the reference measurements on the uncertainty of MARD (expressed by MRI), calculated for values of MARD0 between 8 % and 18 %.
These plots enable calculating MRI based on the known protocol from a clinical trial. The number of reference measurements is normally given explicitly in publications about the CGM performance (see, eg, Table 1 in Kirchsteiger et al14). It is usually also stated which reference measurement system was used. The level of accuracy of the reference measurement device can then for example be obtained from publications about the performance of different BG systems (see, eg, Freckmann et al18).
As the MARD0 is usually unknown, the nearest expected value can be used—for example, the MARD0 closest to the MARD resulting from the clinical trial.
These plots can be used also in the study design phase. Having a guess for the expected MARD value, minimum requirements for the relative error of the reference measurement system and for the number of paired points can be estimated as a function of the desired reliability—for example, the same as in a former study.
Discussion and Conclusions
The main aim of this article was to provide tools to assess the reliability of the MARD values obtained by a study. The statistics behind it may look somewhat complicated, and we have omitted most details, but the key results are rather simple.
First, we insist once more on the fact that the study design does affect our estimation of the performance of the CGM, and we are not far from the moment in which some reference devices, for example, SMBG, may have a comparable or even worse accuracy than CGM. If—or when—this becomes true, not taking these facts into account may cause the actual MARD value to assess basically the accuracy of the reference device and not of the CGM.
Second, we must be aware that a single bottle neck—number of paired points or accuracy of the reference—cannot be overcome by improving the other parameter: the study must be balanced, both parameters must be improved in a congruent way.
Third, the newly introduced MRI offers a simple graphic indication about which parameters to choose or conversely to estimate how reliable a former study was. Again, it is a single measure, like MARD, but conveys complementary information which is very important to avoid comparing apples to oranges.
Last but not least, the authors wish to underline once more that MARD does not reflect the very reason for the existence of CGM, the frequent measurements, and thus MARD needs to be complemented by other quantities like PARD22 designed for this purpose.
It would be highly desirable to have these criteria included in a future version of the guideline on clinical studies for the assessment of CGM performance and followed more frequently than the Clinical and Laboratory Standards Institute.17
Footnotes
Abbreviations: AP, artificial pancreas; BG, blood glucose; CGM, continuous glucose monitoring; MARD, mean absolute relative difference; MRI, MARD reliability index; PARD, precision absolute relative difference; PDF, probability density function; SMBG, self-monitoring of blood glucose.
Declaration of Conflicting Interests: The author(s) declared the following potential conflicts of interest with respect to the research, authorship, and/or publication of this article: MS and GS are full-time employees of Roche Diabetes Care. GF is general manager of Institut für Diabetes-Technologie Forschungs- und Entwicklungsgesellschaft mbH an der Universität Ulm, Ulm, Germany (IDT), which carries out studies evaluating BG meters and medical devices for diabetes therapy on its own initiative and on behalf of various companies. GF/IDT have received speakers’ honoraria or consulting fees from Abbott, Bayer, Berlin-Chemie, Becton-Dickinson, Dexcom, LifeScan, Menarini Diagnostics, Novo Nordisk, Roche Diabetes Care, Sanofi, and Ypsomed. LH is a consultant for a number of companies developing new diagnostic and therapeutic options for diabetes treatment and is a member of a Sanofi advisory board for biosimilar insulins. He is a partner of Profil Institute for Clinical Research, US and Profil Institut für Stoffwechselkrankheiten, Germany.
Funding: The author(s) disclosed receipt of the following financial support for the research, authorship, and/or publication of this article: Writing of the manuscript was supported by an unrestricted grant from Roche Diagnostics.
References
- 1. Breton M, Kovatchev B. Analysis, modeling, and simulation of the accuracy of continuous glucose sensors. J Diabetes Sci Technol. 2008;2(5):853-862. [DOI] [PMC free article] [PubMed] [Google Scholar]
- 2. Kovatchev B, Patek S, Ortiz E, Breton M. Assessing sensor accuracy for non-adjunct use of continuous glucose monitoring. Diabetes Technol Ther. 2015; 17:177-186. [DOI] [PMC free article] [PubMed] [Google Scholar]
- 3. Bailey TS, Ahmann A, Brazg R, et al. Accuracy and acceptability of the 6-day Enlite continuous subcutaneous glucose sensor. Diabetes Technol Ther. 2014;16:277-283. [DOI] [PubMed] [Google Scholar]
- 4. Damiano ER, El-Khatib FH, Zheng H, Nathan DM, Russell SJ. A comparative effectiveness analysis of three continuous glucose monitors. Diabetes Care. 2013;36:251-259. [DOI] [PMC free article] [PubMed] [Google Scholar]
- 5. Freckmann G, Pleus S, Link M, Zschornack E, Klötzer HM, Haug C. Performance evaluation of three continuous glucose monitoring systems: comparison of six sensors per subject in parallel. J Diabetes Sci Technol. 2013;7:842-853. [DOI] [PMC free article] [PubMed] [Google Scholar]
- 6. Garg SK, Smith J, Beatson C, Lopez-Baca B, Voelmle M, Gottlieb PA. Comparison of accuracy and safety of the SEVEN and the Navigator continuous glucose monitoring systems. Diabetes Technol Ther. 2009;11:65-72. [DOI] [PubMed] [Google Scholar]
- 7. Kovatchev B, Heinemann L, Anderson S, Clarke W. Comparison of the numerical and clinical accuracy of four continuous glucose monitors. Diabetes Care. 2008;31:1160-1164. [DOI] [PMC free article] [PubMed] [Google Scholar]
- 8. Kropff J, Bruttomesso D, Doll W, et al. Accuracy of two continuous glucose monitoring systems: a head-to-head comparison under clinical research centre and daily life conditions. Diabetes Obes Metab. 2014;17(4):343-349. [DOI] [PMC free article] [PubMed] [Google Scholar]
- 9. Leelarathna L, Nodale M, Allen JM, et al. Evaluating the accuracy and large inaccuracy of two continuous glucose monitoring systems. Diabetes Technol Ther. 2013;15:143-149. [DOI] [PMC free article] [PubMed] [Google Scholar]
- 10. Luijf YM, Avogaro A, Benesch C, et al. Continuous glucose monitoring accuracy results vary between assessment at home and assessment at the clinical research center. J Diabetes Sci Technol. 2012;6:1103-1106. [DOI] [PMC free article] [PubMed] [Google Scholar]
- 11. Luijf YM, Mader JK, Doll W, et al. Accuracy and reliability of continuous glucose monitoring systems: a head-to-head comparison. Diabetes Technol Ther. 2013;15:722-727. [DOI] [PMC free article] [PubMed] [Google Scholar]
- 12. Weinstein RL, Schwartz SL, Brazg RL, Bugler JR, Peyser TA, McGarraugh GV. Accuracy of the 5-day FreeStyle Navigator continuous glucose monitoring system: comparison with frequent laboratory reference measurements. Diabetes Care. 2007;30:1125-1130. [DOI] [PubMed] [Google Scholar]
- 13. Zschornack E, Schmid C, Pleus S, et al. Evaluation of the performance of a novel system for continuous glucose monitoring. J Diabetes Sci Technol. 2013;7:815-823. [DOI] [PMC free article] [PubMed] [Google Scholar]
- 14. Kirchsteiger H, Heinemann L, Freckmann G, et al. Performance comparison of CGM systems: MARD values are not always a reliable indicator of their accuracy. J Diabetes Sci Technol. 2015;9(5):1030-1040. [DOI] [PMC free article] [PubMed] [Google Scholar]
- 15. Sivia DS, Skilling J. Data Analysis: A Bayesian Tutorial. 2nd ed. Oxford, UK: Oxford University Press; 2006. [Google Scholar]
- 16. Del Favero S, Facchinetti A, Sparacino G, Cobelli C. Improving accuracy and precision of glucose sensor profiles: retrospective fitting by constrained deconvolution. IEEE Trans Biomed Eng. 2014;4:1044-1053. [DOI] [PubMed] [Google Scholar]
- 17. CLSI. Performance metrics for continuous interstitial glucose monitoring; approved guideline. CLSI document POCT05-A. Wayne, PA: Clinical and Laboratory Standards Institute; 2008. [Google Scholar]
- 18. Freckmann G, Schmid C, Ruhland K, Baumstark A, Haug C. System accuracy evaluation of 43 blood glucose monitoring systems for self-monitoring of blood glucose according to DIN EN ISO 15197. J Diabetes Sci Technol. 2012;6:1060-1075. [DOI] [PMC free article] [PubMed] [Google Scholar]
- 19. Delatour V, Lalere B, Saint-Albin K, et al. Continuous improvement of medical test reliability using reference methods and matrix-corrected target values in proficiency testing schemes: Application to glucose assay. Clin Chim Acta. 2012;413:1872-1878. [DOI] [PubMed] [Google Scholar]
- 20. Rodbard D. Characterizing accuracy and precision of glucose sensors and meters. J Diabetes Sci Technol. 2014;8(5):980-985. [DOI] [PMC free article] [PubMed] [Google Scholar]
- 21. Pleus S, Schoemaker M, Morgenstern K, et al. Rate-of-change dependence of the performance of two CGM systems during induced glucose swings. J Diabetes Sci Technol. 2015;9(4):801-807. [DOI] [PMC free article] [PubMed] [Google Scholar]
- 22. Obermaier K, Schmelzeisen-Redeker G, Schoemaker M, et al. Performance evaluations of continuous glucose monitoring systems: precision absolute relative deviation is part of the assessment. J Diabetes Sci Technol. 2013;7:824-832. [DOI] [PMC free article] [PubMed] [Google Scholar]


