Abstract
Mitochondrial function, a key indicator of cell health, can be assessed by monitoring changes in mitochondrial membrane potential (MMP). Cationic fluorescent dyes are commonly used tools to assess MMP. We used a water-soluble mitochondrial membrane potential indicator (m-MPI) to detect changes in MMP in HepG2 cells. A homogenous cell-based MMP assay was optimized and performed in a 1536-well plate format to screen several compound libraries for mitochondrial toxicity by evaluating the effects of chemical compounds on MMP.
Keywords: Mitochondrial membrane potential (MMP), Mitochondrial membrane potential indicator (m-MPI), Mitochondrial toxicity, 1536-well plate format, Mesoxalonitrile 4-trifluoromethoxyphenylhydrazone (FCCP)
1. Introduction
Mitochondria, commonly referred to as power houses of the cell, play a vital role in cellular physiology. The majority of the cellular energy (ATP) in eukaryotic cells is generated in the mitochondria through oxidative phosphorylation (1), during which electrons are transferred from electron donors to electron acceptors such as oxygen. The mitochondrial electron transport chain creates an electrochemical gradient through a series of redox reactions. This electrochemical gradient drives the synthesis of ATP (2) and generates the mitochondrial membrane potential (MMP), which is a key parameter for evaluating mitochondrial function (3).
Mitochondrial dysfunctions have been associated with various disorders such as cancer, cardiovascular diseases, diabetes, and neurodegenerative diseases (4). The toxicity of xenobiotic compounds can have either a direct or a secondary effect on mitochondrial function. Many of these compounds reduce MMP by perturbing a variety of macromolecules in the mitochondria, and therefore affecting different mitochondrial functions. A decrease in the MMP may also be linked to apoptosis (5). Thus these organelles are an ideal target for in vitro toxicity studies.
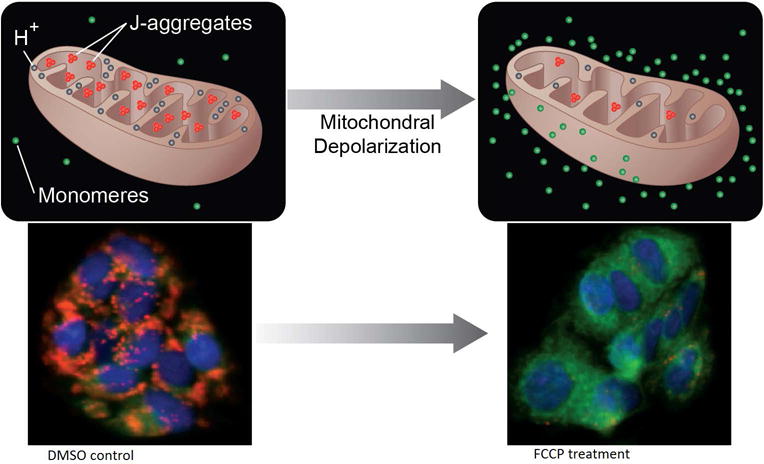
Several cell membrane permeable fluorescent dyes, such as 3, 3′-dihexyloxacarbocyanine iodide [DiOC6(3)], rhodamine-123 (Rh123), tetramethyl rhodamine methyl and ethyl esters (TMRM and TMRE), and JC-1, are currently available to measure changes in MMP. Based on the assay optimization of our previous study (6), we selected the water-soluble m-MPI indicator to determine mitochondrial toxicity by screening the compound libraries against HepG2 cells in a 1536-well plate format. In healthy cells, m-MPI accumulates in the mitochondria as red fluorescent aggregates (emission at 590 nm). When MMP depolarizes and cells become less healthy, m-MPI aggregates are converted to green fluorescent monomers (emission at 535 nm) and remain in the cytoplasm (Fig. 1). So, the red/green fluorescence ratio can be used in determining the mitochondrial function of cells.
Fig. 1.

MMP assay principle. In the healthy cells, m-MPI dye accumulates in mitochondria as aggregates showing red fluorescence. When mitochondrial potential collapses after FCCP treatment, the m-MPI dye remains in cytoplasm with green fluorescence. Figure reproduced from Ref. [6].
2. Materials
2.1 Equipment
Purifier Logic+ Class II, Type A2 Biosafety Cabinet for cell operations.
Steri-Cult CO2 Incubator for culturing cells at 37 °C under a humidified atmosphere and 5% CO2.
Multidrop™ Combi Reagent Dispenser (Thermo Scientific, Waltham, MA) for dispensing cells into 1536-well plates by using an 8-tip dispense cassette.
Pintool workstation (Wako Automation, San Diego, CA) for transferring 23 nL of compounds from a compound plate to an assay plate.
BioRAPTR Flying Reagent Dispenser™ (FRD) workstation (Beckman Coulter, Inc., Brea, CA) for dispensing reagent into a 1536-well plate.
EnVision® Multilabel Plate Reader (Perkin Elmer, Shelton, CT) for reading fluorescence intensity.
ViewLux uHTS Microplate Imager (Perkin Elmer) for reading luminescence intensity.
ImageXpress Micro Widefield High Content Screening system (Molecular Devices, Sunnyvale, CA) for imaging purposes.
2.2 Reagents/Supplies
Human HepG2 (hepatocellular carcinoma) cell line was purchased from ATCC.
Culture medium for HepG2 cells: 1000 mL of Eagle’s Minimum Essential Medium, 100 mL of fetal bovine serum, and 10 mL of 10,000 U/mL penicillin-streptomycin.
Trypsin-EDTA (0.05%).
DPBS, without calciumand magnesium.
Mitochondrial Membrane Potential Indicator (m-MPI) (Codex BioSolutions, Inc., Gaithersburg, MD).
CellTiter-Glo® Luminescent Cell Viability Assay (Promega Corporation, Madison, WI).
Hoechst 33342.
Mesoxalonitrile 4-trifluoromethoxyphenylhydrazone, FCCP, (positive control compound for the assay, CAS Registry Number, CASRN 370-86-5).
Tetraoctyl ammonium bromide (positive control for cytotoxicity assay, CASRN 14866-33-2).
1536-well black wall/ clear bottom, white wall/ solid bottom and clear polystyrene microplates for MMP assay, cytotoxicity assay and compound storage respectively.
3. Methods
3.1 Cell Culture
HepG2 cells obtained as a frozen stock, were thawed in culture medium by adding 1 mL of frozen stock to 9 mL of medium, and were centrifuged for 4min at 900 rpm.
The seeding density for thawing was 2.0 × 10⁶ cells per T-75 flask.
HepG2 cells were grown at 37 °C, 5% CO2 and 95% humidity in T225 flasks in Steri-Cult CO2 Incubator.
For the expansion, the culture medium was aspirated and the monolayer was rinsed twice with DPBS, followed by the addition of 7 mL of Trypsin-EDTA solution.
The cells were detached from the surface by incubation for 3–4 min at 37 °C with Trypsin-EDTA, and resuspended with culture medium. The cells were then centrifuged for 4 min at 900 rpm.
The seeding density for expansion of cells was 4.0 × 10⁶ cells per T225 flasks.
3.2 Quantitative High-Throughput Screening (qHTS) Protocol of MMP and Cell Viability Multiplex Assay (6, 7)
The human HepG2 cells were harvested from the 80–90 % confluent culture flasks by using Trypsin-EDTA for detachment of the cells from the culture flask. The cells were centrifuged and the resulting pellet was re-suspended with culture medium.
The cells were plated at 2000 cells/well in 5 μL of the culture medium into a 1536-well black wall/ clear bottom plate using Multidrop Combi. (see Note 1).
The assay plates were incubated overnight at 37 °C for cell adhesion.
The adhered cells were treated with 23 nL of test compounds and positive control using a Pintool. The test compounds were transferred to columns 5– 48, the positive control compound (FCCP) was transferred to columns 1– 3 (Dose titration in column 1 at a start final concentrations of 11.5 μM with 1:1.5 dilutions; Columns 2 and 3 with 6.9 and 3.5 μM FCCP, respectively), and DMSO only was transferred to column 4.
The assay plates were incubated at 37 °C for 1 h or 5 h.
After the respective incubation times, 5 μL of 2x m-MPI dye-loading solution (10 μL of m-MPI stock solution added to 5 mL of MMP assay buffer, mixed well by vortexing) was added to each well using FRD. (see Note 2)
The assay plates were incubated at 37 °C for 30 min.
Fluorescence intensity (485 nm excitation and 535 nm emission for green fluorescent monomers, 540 nm excitation and 590 nm emission for red fluorescent aggregates) was measured using an Envision plate reader.
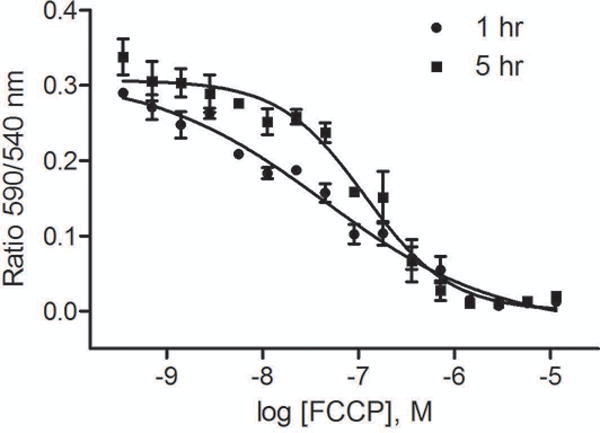
Data were expressed as the ratio of 590 nm/540 nm emissions, an indicator of MMP. The positive control, FCCP, concentration-dependently decreases MMP with IC50s of 44 and 116 nM for 1 and 5 h treatment, respectively (Fig. 2).
Right after MMP assay, 2 μL of CellTiter-Glo® reagent was added to each well using FRD.
The assay plates were incubated at room temperature for 30 min.
Luminescence intensity was measured using Viewlux plate reader.
Fig. 2.

Concentration-response curves of FCCP after 1h or 5h treatment.
3.3 Imaging Based MMP Assay (6, 8)
The human HepG2 cells were plated at 2000 cells/well in 5 μL of the culture medium into a 1536-well black wall/ clear bottom plate using Multidrop Combi.
The assay plates were incubated overnight at 37 °C for cell adhesion.
The adhered cells were treated with the test compounds and positive control (FCCP, 6.9 and 3.5 μM).
The treated plates were incubated at 37 °C for 1 or 5 h.
After the respective incubation times, 5 μL of 2x m-MPI dye-loading solution with 0.3 μg/ mL of Hoechst 33342 were added to each well using FRD.
The assay plates were incubated at 37 °C for 30 min.
The fluorescence intensities (482 nm excitation and 536 nm emission for green fluorescent monomers; 543 nm excitation and 593 nm emission for red fluorescent aggregates; 377 nm excitation and 447 nm emission for Hoechst 33342) were measured using an ImageXpress Screening System.
Imaging was processed and analyzed with the MetaXpress® and PowerCore® software using the Multi Wavelength Cell Scoring algorithm. The mean of average fluorescence intensity from each positive cell was calculated per well for both green and red fluorescent colors.
Data were expressed as ratio of 593 nm/536 nm emissions.
Footnotes
The black wall/ clear bottom assay plates should not be touched at the bottom as the fluorescence intensity is read from the bottom of the plate.
For proper mixing of the m-MPI dye with the buffer, the buffer should be taken out from 4 °C a couple of hours prior to the assay in order to reach room temperature.
References
- 1.Chance B, Williams GR. The respiratory chain and oxidative phosphorylation. Adv Enzymol Relat Subj Biochem. 1956;17:65–134. doi: 10.1002/9780470122624.ch2. [DOI] [PubMed] [Google Scholar]
- 2.Mitchell P. Coupling of phosphorylation to electron and hydrogen transfer by a chemi-osmotic type of mechanism. Nature. 1961;191:144–148. doi: 10.1038/191144a0. [DOI] [PubMed] [Google Scholar]
- 3.Chen LB. Mitochondrial membrane potential in living cells. Ann Rev Cell Biol. 1988;4:155–81. doi: 10.1146/annurev.cb.04.110188.001103. [DOI] [PubMed] [Google Scholar]
- 4.Pieczenik SR, Neustadt J. Mitochondrial dysfunction and molecular pathways of disease. Exp Mol Pathol. 2007;83(1):84–92. doi: 10.1016/j.yexmp.2006.09.008. [DOI] [PubMed] [Google Scholar]
- 5.Lemasters JJ, Qian T, He L, Kim JS, Elmore SP, Cascio WE, Brenner DA. Role of mitochondrial inner membrane permeabilization in necrotic cell death, apoptosis, and autophagy. Antioxid Redox Signal. 2002;4:769–781. doi: 10.1089/152308602760598918. [DOI] [PubMed] [Google Scholar]
- 6.Sakamuru S, Li X, Attene-Ramos MS, Huang R, LU J, Shou L, Shen M, Tice RR, Austin CP, Xia M. Application of a homogenous membrane potential assay to assess mitochondrial function. Physiol Genomics. 2012;44(9):495–503. doi: 10.1152/physiolgenomics.00161.2011. [DOI] [PMC free article] [PubMed] [Google Scholar]
- 7.Attene-Ramos MS, Huang R, Michael S, Witt KL, Richard A, Tice RR, Simeonov A, Austin CP, Xia M. Profiling of the Tox21 chemical collection for mitochondrial function to identify compounds that acutely decrease mitochondrial membrane potential. Environ Health Perspect. 2015;123(1):49–56. doi: 10.1289/ehp.1408642. [DOI] [PMC free article] [PubMed] [Google Scholar]
- 8.Attene-Ramos MS, Huang R, Sakamuru S, Witt KL, Beeson GC, Shou L, Schnellmann RG, Beeson CC, Tice RR, Austin CP, Xia M. Systematic study of mitochondrial toxicity of environmental chemicals using quantitative high throughput screening. Chem Res Toxicol. 2013;26(9):1323–32. doi: 10.1021/tx4001754. [DOI] [PMC free article] [PubMed] [Google Scholar]


