Our study supports the safety and effectiveness of 3-T in-bore MR-guided prostate biopsy; Prostate Imaging Reporting and Data System version 2 enabled risk stratification in patients with positive 3-T MR-guided prostate biopsy findings.
Abstract
Purpose
To determine the diagnostic yield of in-bore 3-T magnetic resonance (MR) imaging–guided prostate biopsy and stratify performance according to Prostate Imaging Reporting and Data System (PI-RADS) versions 1 and 2.
Materials and Methods
This study was HIPAA compliant and institution review board approved. In-bore 3-T MR-guided prostate biopsy was performed in 134 targets in 106 men who (a) had not previously undergone prostate biopsy, (b) had prior negative biopsy findings with increased prostate-specific antigen (PSA) level, or (c) had a prior history of prostate cancer with increasing PSA level. Clinical, diagnostic 3-T MR imaging was performed with in-bore guided prostate biopsy, and pathology data were collected. The diagnostic yields of MR-guided biopsy per patient and target were analyzed, and differences between biopsy targets with negative and positive findings were determined. Results of logistic regression and areas under the curve were compared between PI-RADS versions 1 and 2.
Results
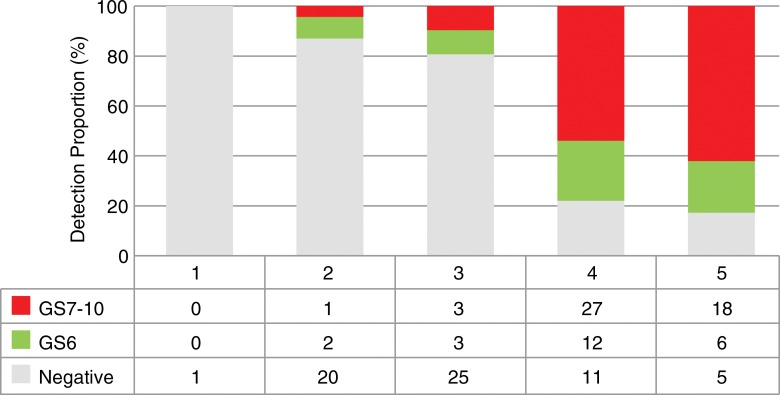
Prostate cancer was detected in 63 of 106 patients (59.4%) and in 72 of 134 targets (53.7%) with 3-T MR imaging. Forty-nine of 72 targets (68.0%) had clinically significant cancer (Gleason score ≥ 7). One complication occurred (urosepsis, 0.9%). Patients who had positive target findings had lower apparent diffusion coefficient values (875 × 10−6 mm2/sec vs 1111 × 10−6 mm2/sec, respectively; P < .01), smaller prostate volume (47.2 cm3 vs 75.4 cm3, respectively; P < .01), higher PSA density (0.16 vs 0.10, respectively; P < .01), and higher proportion of PI-RADS version 2 category 3–5 scores when compared with patients with negative target findings. MR targets with PI-RADS version 2 category 2, 3, 4, and 5 scores had a positive diagnostic yield of three of 23 (13.0%), six of 31 (19.4%), 39 of 50 (78.0%), and 24 of 29 (82.8%) targets, respectively. No differences were detected in areas under the curve for PI-RADS version 2 versus 1.
Conclusion
In-bore 3-T MR-guided biopsy is safe and effective for prostate cancer diagnosis when stratified according to PI-RADS versions 1 and 2.
©RSNA, 2016
Introduction
Prostate cancer (PCa) is the second leading cause of cancer death of men in the United States (1). For patients with high clinical suspicion for PCa (abnormal digital rectal examination findings and/or increased prostate-specific antigen [PSA] level), the standard of care for the diagnosis of PCa is systematic transrectal ultrasonography (US)–guided biopsy (2). Multiparametric prostate magnetic resonance (MR) imaging by using T2-weighted imaging, diffusion-weighted imaging (DWI), and dynamic contrast material enhancement (DCE) (3) has been shown to improve detection, localization, and staging of PCa (4,5). Over the past decade, the use of multiparametric prostate MR imaging guidance for biopsy targeting of lesions suspicious for PCa enabled significantly increased PCa detection rates when performed with a variety of methods (cognitive fusion, MR-US fusion, and direct in-bore MR-guided biopsy), compared with standard template-based transrectal US-guided biopsy (6).
Concurrent with the emergence of MR-targeted biopsy was the introduction of the Prostate Imaging Reporting and Data System (PI-RADS), an expert consensus document sponsored by the European Society of Urogenital Radiology and the American College of Radiology. PI-RADS provides a standardized lexicon for interpretation of multiparametric prostate MR images and stratifies the malignant potential of individual lesions detected on multiparametric prostate MR images. The initial version of PI-RADS (version 1) was published in 2012, and an update (version 2) was published in December 2014 (7). In the diagnostic algorithm in PI-RADS version 2, lesions on MR images are stratified into one or more of 39 segments according to location (peripheral or transition zone). With PI-RADS version 2, assessment of DCE imaging is also simplified, and the criteria for category 3 lesions are clarified. Although the value of PI-RADS version 1 for diagnostic yield in the setting of MR-guided biopsy has been reported, the diagnostic performance of PI-RADS version 2 compared with version 1 in the setting of 3-T in-bore MR-guided prostate biopsy in the United States has not been reported, to our knowledge. The objective of the study was to determine the diagnostic yield of 3-T in-bore MR-guided prostate biopsy and stratify performance according to PI-RADS versions 1 and 2.
Materials and Methods
Patient Selection
This study complied with the 1996 Health Information Portability and Accountability Act and was performed with waiver of informed consent by the institutional review board, owing to the retrospective nature. This was a retrospective study of a cohort of 119 consecutive patients who were suspected of having PCa and underwent 3-T multiparameteric MR imaging and 3-T in-bore MR-guided transrectal biopsy between May 2013 and December 2016. Men who underwent systemic transrectal US-guided biopsy concurrently with MR-guided biopsy were excluded from the study (n = 13), and the remaining 106 men were included. Indications for MR-guided biopsy included patients with increased PSA level without prior biopsy, patients with increased PSA level with prior transrectal US-guided biopsy, and patients with a prior diagnosis of PCa at transrectal US-guided biopsy. The sample size was determined by the number of procedures referred to the Cross Sectional Interventional Radiology service at the University of California, Los Angeles, during this period.
Diagnostic MR Imaging
All men in this cohort underwent preoperative 3-T multiparametric MR imaging with a 3-T system (Magnetom Trio, Skyra, or Verio system; Siemens Medical Systems, Malvern, Pa) by using similar protocols (Table 1) with pelvic external phased-array coils. The antiperistaltic agent glucagon (1 mg; Lilly, Indianapolis, Ind) was given intramuscularly to reduce bowel peristalsis. The DCE protocol involved injection of 0.1 mg of gadopentetate dimeglumine (Magnevist; Bayer, Wayne, NJ) per kilogram of body weight administered at 2 mL/sec at the second acquisition for baseline calculation. The data were then transferred to a separate workstation (DynaCAD; InVivo, Gainesville, Fla) for processing of the DWI and DCE images for image interpretation.
Table 1.
MR Imaging Protocol

MR Image Interpretation of Regions of Interest
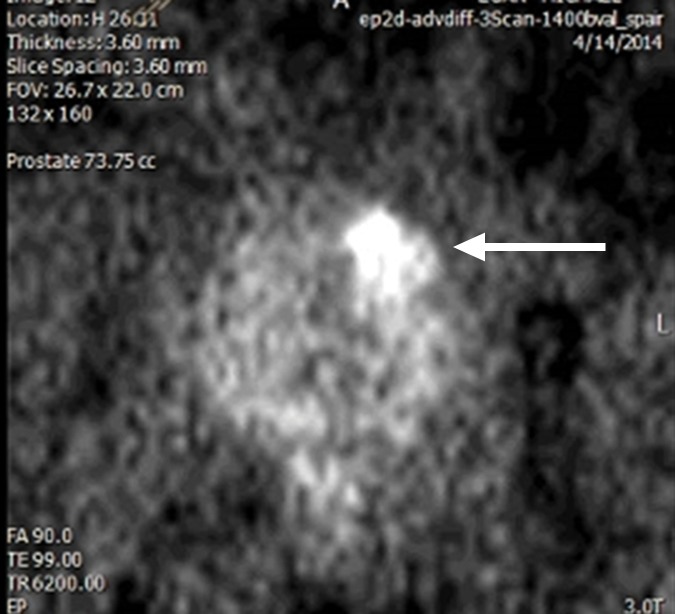
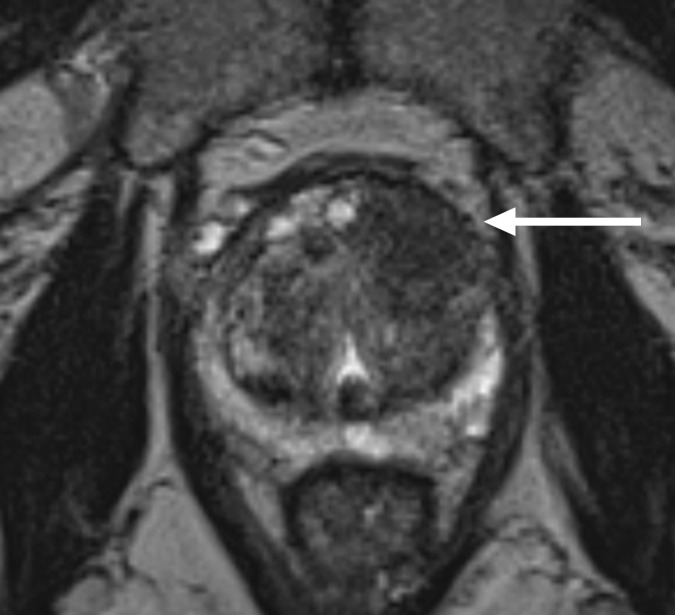
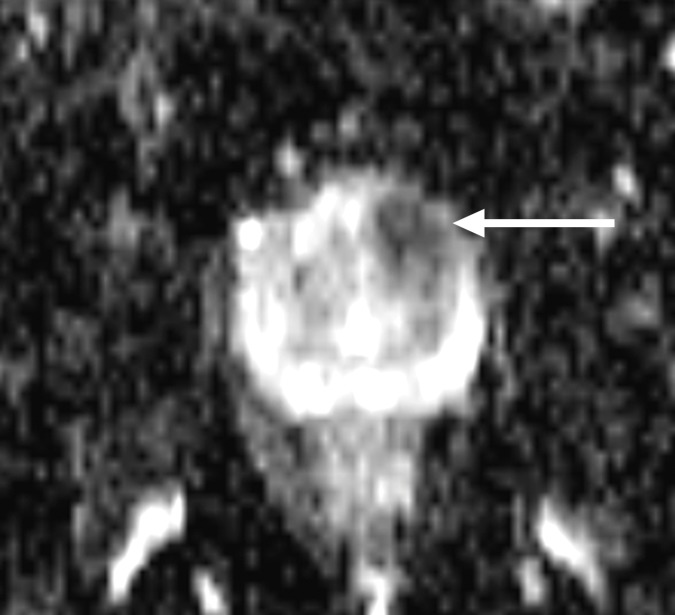
Each 3-T MR study was interpreted by an abdominal imaging fellow and one of two board-certified abdominal imaging subspecialized radiologists (D.J.A.M. and S.S.R., with 10 and 16 years of experience in prostate MR imaging, respectively). Each abdominal imaging expert interpreted the study by reviewing T2-weighted images, T1-weighted images, DWI images obtained with high b values (b = 1400 sec/mm2) (Fig 1b ), ADC maps, and DCE images. Individual lesions were identified and localized within the prostate and scored from 1 to 5 according to PI-RADS category (8). By definition, a category 1 lesion is normal, whereas a category 5 lesion is highly suspicious for PCa. The individual and overall PI-RADS categories were determined by the appearance on DWI images, T2-weighted images, and DCE images according to PI-RADS versions 1 (9) and 2 (8). See Figure 1 for a representative transition zone and Figure 2 for pre–MR-guided biopsy planning.
Figure 1b:
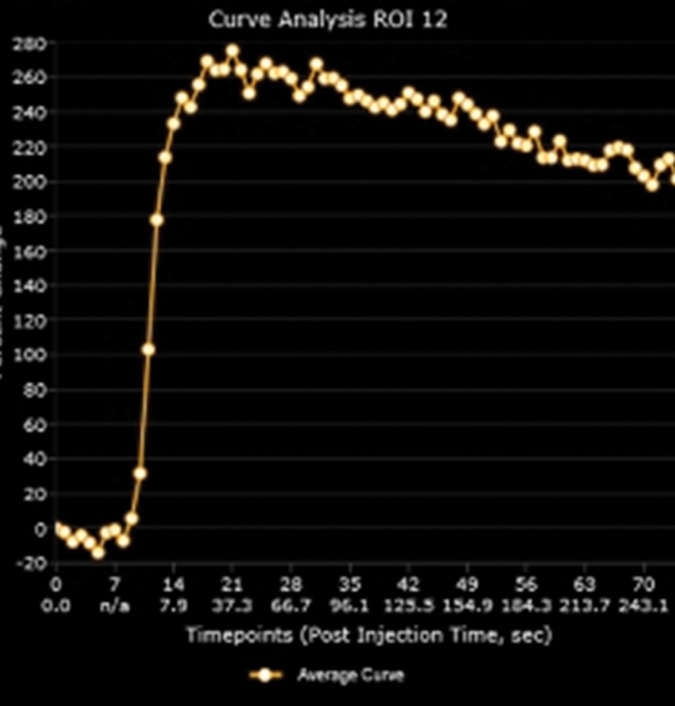
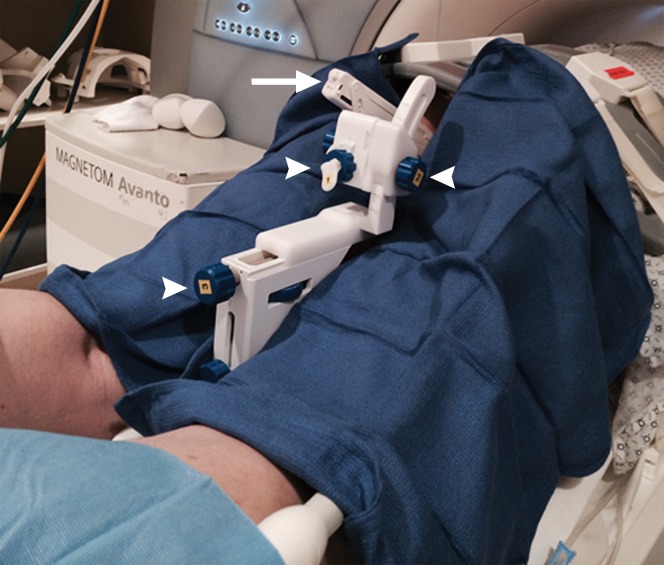
Multiparametric 3-T MR imaging was performed in a 73-year-old man with a history of prior biopsy-proven PCa. (a) Axial T2-weighted MR image and (c) apparent diffusion coefficient (ADC) map show a lesion (arrow) in the anterior transition zone with a longest diameter of about 1.7 cm, which is irregular, and uniform hypointensity on the T2-weighted image (a). (b) DWI image and ADC map (c) show focal high and low signal intensity, respectively, at 700 × 10−6 mm2/sec. (d) Enhancement curve shows early and intense enhancement with immediate washout. PI-RADS assessment category is 5. (e) Photograph illustrates that for in-bore biopsy, the patient was placed in the prone position. The DynaTRIM system (InVivo) includes the foam base pad, the clamp stand, and the three adjustable blue screws (arrowheads) for biopsy needle positioning during biopsy planning. The biopsy gun was inserted (arrow).
Figure 1a:
Multiparametric 3-T MR imaging was performed in a 73-year-old man with a history of prior biopsy-proven PCa. (a) Axial T2-weighted MR image and (c) apparent diffusion coefficient (ADC) map show a lesion (arrow) in the anterior transition zone with a longest diameter of about 1.7 cm, which is irregular, and uniform hypointensity on the T2-weighted image (a). (b) DWI image and ADC map (c) show focal high and low signal intensity, respectively, at 700 × 10−6 mm2/sec. (d) Enhancement curve shows early and intense enhancement with immediate washout. PI-RADS assessment category is 5. (e) Photograph illustrates that for in-bore biopsy, the patient was placed in the prone position. The DynaTRIM system (InVivo) includes the foam base pad, the clamp stand, and the three adjustable blue screws (arrowheads) for biopsy needle positioning during biopsy planning. The biopsy gun was inserted (arrow).
Figure 2a:
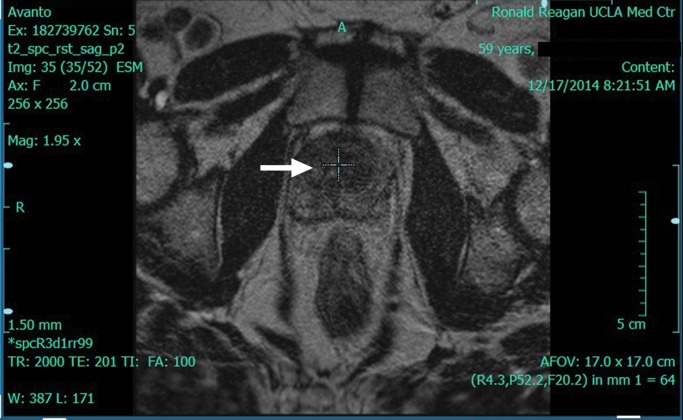
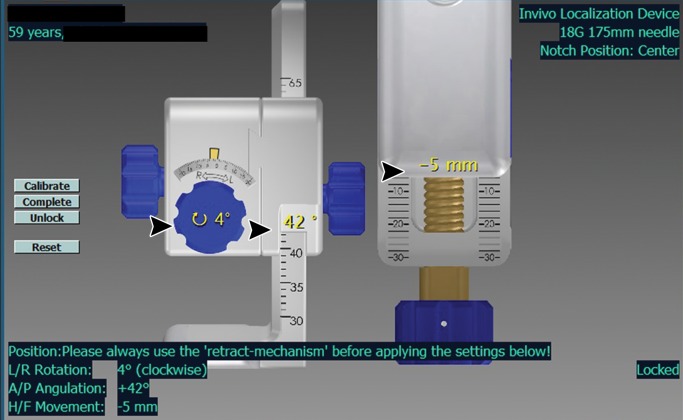
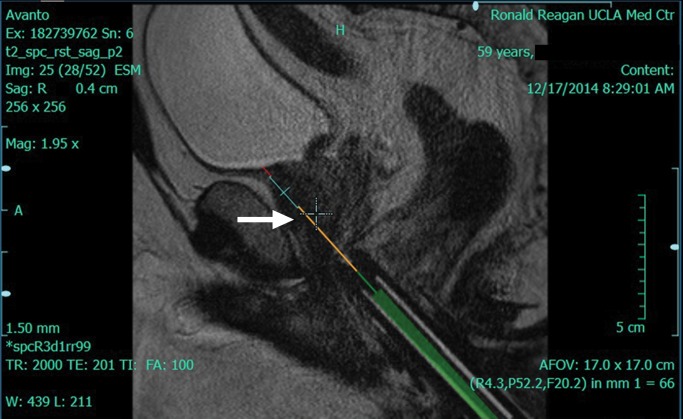
DynaCAD workstation (InVivo) images show that the workstation is capable of offering visualization of the tumor during biopsy planning. (a) The lesion is localized (arrow) on an axial T2-weighted image. (b) The software provides target coordinates, which are adjusted on the dial (arrowheads). (c) Target confirmation (arrow) is shown.
Figure 1c:
Multiparametric 3-T MR imaging was performed in a 73-year-old man with a history of prior biopsy-proven PCa. (a) Axial T2-weighted MR image and (c) apparent diffusion coefficient (ADC) map show a lesion (arrow) in the anterior transition zone with a longest diameter of about 1.7 cm, which is irregular, and uniform hypointensity on the T2-weighted image (a). (b) DWI image and ADC map (c) show focal high and low signal intensity, respectively, at 700 × 10−6 mm2/sec. (d) Enhancement curve shows early and intense enhancement with immediate washout. PI-RADS assessment category is 5. (e) Photograph illustrates that for in-bore biopsy, the patient was placed in the prone position. The DynaTRIM system (InVivo) includes the foam base pad, the clamp stand, and the three adjustable blue screws (arrowheads) for biopsy needle positioning during biopsy planning. The biopsy gun was inserted (arrow).
Figure 1d:
Multiparametric 3-T MR imaging was performed in a 73-year-old man with a history of prior biopsy-proven PCa. (a) Axial T2-weighted MR image and (c) apparent diffusion coefficient (ADC) map show a lesion (arrow) in the anterior transition zone with a longest diameter of about 1.7 cm, which is irregular, and uniform hypointensity on the T2-weighted image (a). (b) DWI image and ADC map (c) show focal high and low signal intensity, respectively, at 700 × 10−6 mm2/sec. (d) Enhancement curve shows early and intense enhancement with immediate washout. PI-RADS assessment category is 5. (e) Photograph illustrates that for in-bore biopsy, the patient was placed in the prone position. The DynaTRIM system (InVivo) includes the foam base pad, the clamp stand, and the three adjustable blue screws (arrowheads) for biopsy needle positioning during biopsy planning. The biopsy gun was inserted (arrow).
Figure 2b:
DynaCAD workstation (InVivo) images show that the workstation is capable of offering visualization of the tumor during biopsy planning. (a) The lesion is localized (arrow) on an axial T2-weighted image. (b) The software provides target coordinates, which are adjusted on the dial (arrowheads). (c) Target confirmation (arrow) is shown.
Figure 2c:
DynaCAD workstation (InVivo) images show that the workstation is capable of offering visualization of the tumor during biopsy planning. (a) The lesion is localized (arrow) on an axial T2-weighted image. (b) The software provides target coordinates, which are adjusted on the dial (arrowheads). (c) Target confirmation (arrow) is shown.
MR-guided In-Bore Targeted Biopsy
MR-guided biopsy was performed with 3.0-T MR imaging systems (Magnetom Trio; Siemens Medical Systems). Men were given oral ciprofloxacin (500 mg twice daily) for 3 days prior to biopsy. They were instructed to ingest a clear liquid diet on the day prior to biopsy and underwent an enema (Fleet Laboratory, Lynchburg, Va) on the morning of biopsy to empty the rectum. The biopsies were performed by one of two interventionalists (S.S.R., D.S.K.L.) who had 15 and 20 years of experience, respectively, with image-guided procedures. The biopsy targets were based on targets identified on preprocedural diagnostic MR images and corresponding clinical reports. The interventionalists reviewed prior MR images and confirmed the target(s) on the intraprocedural MR images. The interventionalists were not blinded to prior transrectal US-guided biopsy results because the biopsies were performed as part of a clinical procedure. After providing informed consent, each patient was placed in the prone position, and the plastic needle guide was inserted into the rectum and attached to the DynaTRIM needle guide (InVivo) by an interventionalist (Fig 1e). Each patient received intravenous antibiotics during the procedure (metronidazole, 500 mg, Aventis Pharma, Bridgewater, NJ; ceftriaxone, 1000 mg, Roche Laboratories, Indianapolis, Ind), along with conscious sedation (midazolam, 1–2 mg, Roche Laboratories; and fentanyl, 50–100 μg, Hospira, Lake Forest, Ill) at the time of the procedure.
Figure 1e:
Multiparametric 3-T MR imaging was performed in a 73-year-old man with a history of prior biopsy-proven PCa. (a) Axial T2-weighted MR image and (c) apparent diffusion coefficient (ADC) map show a lesion (arrow) in the anterior transition zone with a longest diameter of about 1.7 cm, which is irregular, and uniform hypointensity on the T2-weighted image (a). (b) DWI image and ADC map (c) show focal high and low signal intensity, respectively, at 700 × 10−6 mm2/sec. (d) Enhancement curve shows early and intense enhancement with immediate washout. PI-RADS assessment category is 5. (e) Photograph illustrates that for in-bore biopsy, the patient was placed in the prone position. The DynaTRIM system (InVivo) includes the foam base pad, the clamp stand, and the three adjustable blue screws (arrowheads) for biopsy needle positioning during biopsy planning. The biopsy gun was inserted (arrow).
Each patient underwent a localizing MR acquisition with a phased-array coil, consisting of axial and coronal turbo spin-echo T2-weighted imaging and echo-planar DWI (Table 1). The T2-weighted and DWI data were sent electronically to the DynaCAD (InVivo) workstation for biopsy planning on the DynaTRIM system (InVivo). The DynaCAD software (InVivo) calculated coordinates of the region of interest identified on T2-weighted images by the interventionalist. The prior multiparametric MR images were available on our picture archiving and communication system (Centricity; GE Medical Systems, Milwaukee, Wis) for comparison with onsite MR images during the biopsy. After obtaining the coordinates for each target, the DynaTRIM device (InVivo) with needle guide was adjusted accordingly with manual adjustment when necessary, and confirmatory oblique axial and coronal T2-weighted turbo spin-echo images were obtained (Fig 1e). An MR-compatible 18-gauge spring-loaded core biopsy device with a 2-cm throw (TSK Laboratory, Tochigi-Ken, Japan; or InVivo, Schwerin, Germany) of either 15- or 17-cm length was used to obtain each individual core biopsy sample. An oblique axial, coronal, and sagittal turbo spin-echo T2-weighted MR image was obtained to confirm needle position. The number of biopsy passes was determined by the interventionalist. Typically, three to four passes were conducted per target to ensure the accuracy of the specimen.
Patient Data
Clinical information (indication for biopsy, prior transrectal US-guided biopsy Gleason score [GS], age, PSA level, preprocedural diagnostic MR imaging information [lesion diameter on MR images, ADC, prostate volume, prostate zone, PI-RADS category, radiologist]), in-bore MR-guided biopsy information (zone, number of cores obtained, complications), and pathology reference standard data (number of cores with positive findings, percentage of cores with positive findings, GS) were collected from the electronic medical records. The pathologist did have access to clinical information (PSA level, prior biopsy results, etc) at the time of pathology review as part of clinical standard practice. The lesions were categorized by zone: peripheral or transition zone. PSA density was defined as PSA level divided by prostate volume on MR images. Clinically significant PCa was defined as GS of at least 7 (≥3+4). In patients with prior biopsy, GS change was compared from transrectal US-guided biopsy to subsequent MR-guided biopsy. GS downgrading was defined as a decrease in GS; upgrading was defined as an increase in GS; no change in GS from transrectal US-guided biopsy compared with MR-guided biopsy was considered concordant. Two radiologists (D.J.A.M., S.S.R.) with 10 and 16 years of experience in reviewing prostate MR images, respectively, reviewed the preprocedural diagnostic MR images and provided PI-RADS version 2 category.
Statistical Analysis
For continuous variables, we reported the median and interquartile range (IQR). Differences in clinical parameters (PSA level, PSA density) and MR imaging parameters (prostate volume, ADC, zone, PI-RADS version 2 category) between positive and negative MR-guided biopsy findings were determined. Differences in categorical variables were evaluated by using Fisher and χ2 tests, and medians of continuous variables were calculated by using a nonparametric Mann-Whitney U test. Linear logistic regression and subsequent area under the curve (AUC) were calculated for PI-RADS version 1 and 2 and individual readers by using positive MR-guided biopsy results as the outcome variable. The sensitivity, specificity, positive predictive value, negative predictive value, and accuracy for PCa at MR-guided biopsy by using PI-RADS version 2 categories 3–5 as a cutoff threshold were calculated. Categories 3–5 were used as the cutoff threshold on the basis of exploratory results that demonstrated a high rate of positive biopsy findings. The per-patient PCa diagnostic yield stratified according to clinical indication was determined, along with per-target detection of PCa stratified according to PI-RADS version 2 category. We did not have indeterminate pathology results. We had no missing information for the data presented in this study. All statistical analyses were performed by using Stata version 12.1 software (StataCorp, College Station, Tex). A P value less than .05 was considered to indicate a significant difference. We did not correct for multitesting because planned comparisons were used.
Results
Patient Population
One hundred six patients included in the study cohort underwent 134 in-bore 3-T MR-targeted biopsies. The median patient age and PSA level were 66.5 years (range, 43–79 years) and 7.9 ng/mL (7.9 μg/L) (IQR, 5.6–10.6), respectively. The median MR target diameter was 1.3 cm (IQR, 0.9–1.7 cm). Overall, 3-T MR-guided biopsy enabled a PCa diagnosis in 63 of 106 patients (59.4%) and 72 of 134 (53.7%) 3-T MR-derived targets biopsied. Clinically significant PCa (GS ≥ 7) was present in 49 of 72 (68.0%) targets with positive findings. The median number of 18-gauge biopsy cores obtained was five (IQR, 5–7), and the median percentage of cores with positive findings was 80.0% (IQR, 52.7%–100%). Most 3-T multiparametric prostate MR imaging targets (79 of 134 [59.0%]) were in the transition zone.
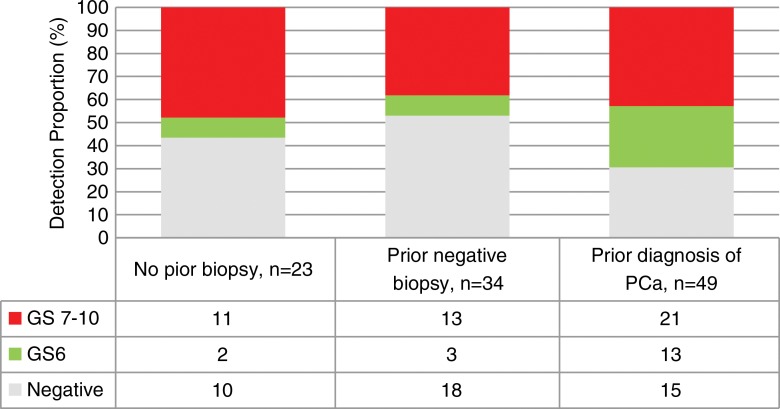
MR-guided biopsy was used to detect clinically significant PCa in 47.8% (11 of 23) of patients with no prior transrectal US-guided biopsy, 38.2% (13 of 34) of patients with prior negative biopsy findings, and 42.8% (21 of 49) of patients with prior diagnosis of PCa (Fig 3). In the 49 patients with prior diagnosis of PCa, GS was upgraded in 18 of 49 patients (36.7%), downgraded in one of 49 patients (2.0%), and unchanged in 16 of 49 patients (32.6%) (Table 2). One (0.9%) procedure-associated complication (urosepsis) occurred, which resolved uneventfully after administration of intravenous antibiotics.
Figure 3:
Graph shows the diagnostic yield stratified according to clinical indication and proportion of overall PCa and clinically significant PCa (GS ≥ 7).
Table 2.
Patient Demographics and Biopsy Results
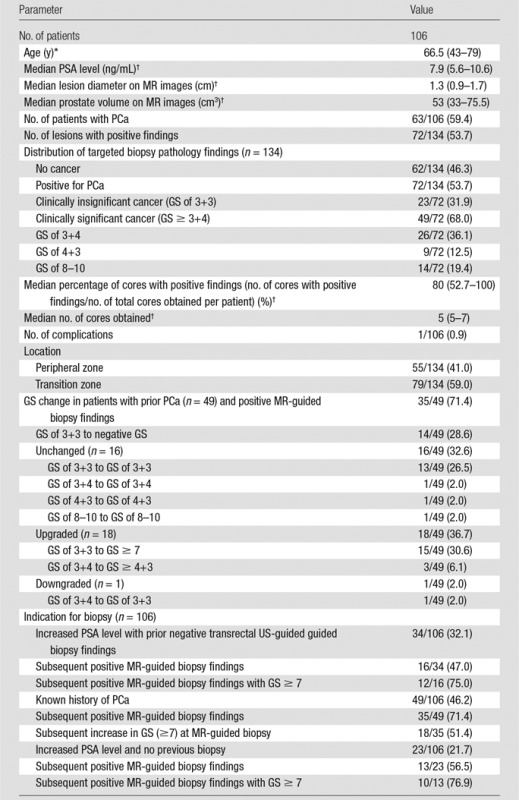
Note.—Unless indicated otherwise, numbers in parentheses are percentages. To convert nanograms per milliliter to micrograms per liter, multiply by 1.0.
*Numbers in parentheses are the range.
† Numbers in parentheses are IQRs.
Differences between Negative and Positive MR-guided Biopsy Findings
At 3-T multiparametric prostate MR imaging per-target analysis, targets with positive PCa findings (Table 3) had significantly lower ADC values (875 × 10−6 mm2/sec vs 1111 × 10−6 mm2/sec, respectively; P < .01), smaller prostate volume (47.2 cm3 vs 75.4 cm3, respectively; P < .01), higher PSA density (0.16 vs 0.10, respectively; P < .01), and higher proportion of PI-RADS version 2 category 3–5 findings when compared with targets without PCa findings. The targets with PI-RADS version 2 category 2, 3, 4, and 5 findings had positive diagnostic yields of three of 23 (13.0%), six of 31 (19.4%), 39 of 50 (78.0%), and 24 of 29 (82.8%) targets, respectively. The proportion of clinically significant PCa increased incrementally with increase in PI-RADS version 2 category (Fig 4). No differences were detected when stratified according to MR target lesion diameter (P = .06) or zone (P = .22).
Table 3.
Predictors for Positive Biopsy Results
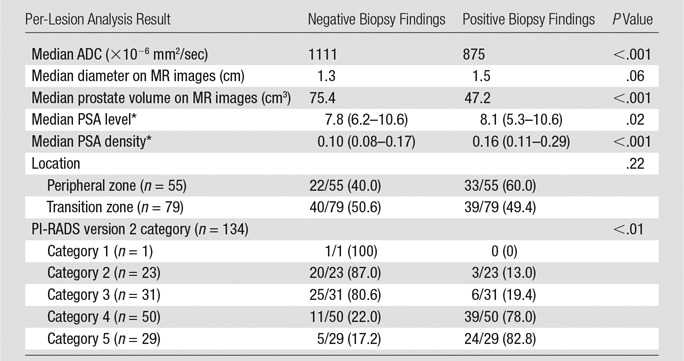
Note.—Unless indicated otherwise, numbers in parentheses are percentages.
*Numbers in parentheses are IQRs.
Figure 4:
Graph shows PCa detection stratified according to PI-RADS version 2 category and proportion of overall and clinically significant PCa.
Diagnostic Performance
By using 3-T multiparametric prostate MR imaging targets with PI-RADS version 2 categories 3–5 as a cutoff threshold, the respective sensitivity, specificity, positive predictive value, negative predictive value, and accuracy for PCa were 59 of 72 targets (81.9%), 21 of 62 targets (33.9%), 69 of 110 targets (62.7%), 21 of 24 targets (87.5%), and 90 of 134 targets (67.2%) for PI-RADS version 2 and 71 of 72 targets (98.6%), four of 62 targets (6.5%), 71 of 129 targets (55.0%), four of six targets (80.0%), and 75 of 134 targets (56.0%) for PI-RADS version 1. The AUC for PI-RADS version 2 was 0.82, compared with 0.81 for PI-RADS version 1 (P = .87). There were no significant differences in AUC between PI-RADS version 2 and version 1 in either the peripheral zone (0.76 vs 0.80, P = .43) or the transition zone (0.86 vs 0.83, P = .41) (Table 4). The AUC for clinically significant PCa was 0.78 for reader 1 and 0.77 for reader 2. When the distribution of GS was stratified according to PI-RADS version 2 category, all targets with GS of at least 7 at final pathology assessment had PI-RADS version 2 category of at least 4 (Table 5).
Table 4.
Per-Lesion Diagnostic Performance between PI-RADS Versions 1 and 2
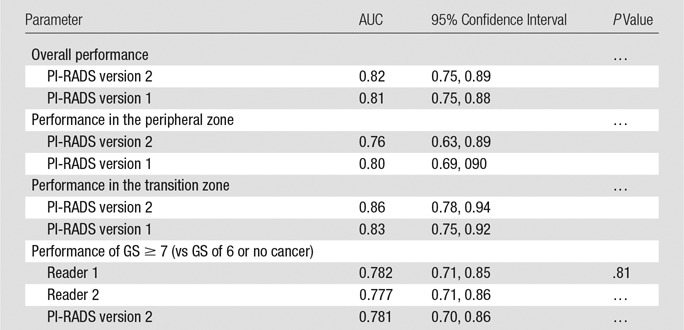
Table 5.
Distribution of PI-RADS Category and Target Pathology Results

Note.—Data are numbers of targets.
Discussion
In this study, the diagnostic yields of 3-T MR-guided biopsy for PCa were 59.4% per patient (63 of 106 patients) and 53.7% per target (72 of 134 targets). Clinically significant PCa was detected in 68.0% of 3-T MR-guided biopsy targets with positive findings (49 of 72 targets). Patients with positive 3-T MR-guided biopsy findings were significantly more likely to have smaller prostate volumes, higher PSA density, and higher PI-RADS version 2 MR target category when compared with those with negative MR-guided biopsy findings. The diagnostic performance of PI-RADS version 2 was higher in the transition zone than in the peripheral zone. A complication rate of 0.9% was observed. Overall, our study supports the safety and effectiveness of 3-T in-bore MR-guided prostate biopsy; PI-RADS version 2 enabled risk stratification in patients with positive findings.
The use of in-bore 3-T MR-guided biopsy yielded a high PCa diagnostic rate overall (59.4%) and for clinically significant PCa (68.0%), which is similar to the rates of 53.1% and 85.3%, respectively, reported previously in a smaller cohort by Quentin et al (10). When template transrectal US-guided biopsy was added to 3-T in-bore MR-guided biopsy, Quentin et al reported an absolute 7% increase in detection rate of 60.9% for PCa and a slight decrease to 82.1% for clinically significant PCa. The combined 3-T MR-guided biopsy with transrectal US-guided biopsy reported by Quentin et al is similar to our study with in-bore MR-guided biopsy alone. The higher overall detection rate in our study compared with prior studies conducted in an in-bore cohort alone may be due to the differences in patient population. Quentin et al evaluated patients who had not previously undergone biopsy with PSA levels higher than 4.0 ng/mL (4.0 μg/L). In contrast, our patients included those with prior diagnosis of PCa, in addition to patients who had not previously undergone biopsy and those with prior negative transrectal US-guided biopsy findings. The 3-T MR-guided biopsy detection rates in both our study and the study of Quentin et al are much higher than previously reported rates of 37%–39% (11–13), likely because of patient selection and preprocedural risk stratification according to PI-RADS versions 2 and 1, respectively. It may also result from the better MR equipment and technique used with the 3-T magnets instead of the 1.5-T magnets in prior reported studies, but this requires further study. Although comparable rates of PCa detection have been reported between the best MR-US fusion–guided biopsy series and 3-T MR-guided biopsy for overall and clinically significant PCa detection, 3-T MR-guided prostate biopsy series have yielded a higher percentage of cores with positive findings (35%–56% vs 14%–29%, respectively) and a fewer number of cores obtained (5.3–5.6 vs 12–17, respectively) when compared with studies on MR-US fusion (10,14,15). In our series, the median percentage of cores with positive findings per patient was higher at 80% (IQR, 52.7%–100%), and the median number of cores obtained was similar at five (IQR, 5–12), which suggests that 3-T MR-guided biopsy has the potential to be a more efficient targeting tool than US-MR fusion, although this would also require a randomized controlled trial for validation.
In our study, we demonstrated that MR-guided biopsy yield is dependent on patient population, as patients with prior diagnosis of PCa had the highest overall yield (34 of 49 patients [69.4%]) when compared with patients who had not undergone biopsy before (13 of 23 patients [56.5%]). Despite this, the rate of clinically significant cancers detected with 3-T MR-guided biopsy in patients with prior negative transrectal US-guided biopsy findings remains high. Others have reported that the combination of random transrectal US-guided biopsy and MR-targeted (in-bore or MR-US) biopsy has a higher diagnostic yield for clinically significant cancers than transrectal US-guided biopsy alone (10,14). Quentin et al showed a 9.4% increase in clinically significant cancer from transrectal US-guided biopsy to combined transrectal US-guided and in-bore MR-guided biopsy. In our population, 18 of 49 patients (36.7%) with prior GS of 6 (3+3) or 7 (3+4) at transrectal US-guided biopsy had GS upgraded after MR-guided biopsy. This difference in GS upgrading is higher in our study, likely due to the design of the study; Quentin et al performed a serial in-bore procedure, followed by transrectal US-guided biopsy, in the same group of patients; thus, there may be procedural bias because of postbiopsy hemorrhage present from the in-bore procedure at the time of transrectal US-guided biopsy. In contrast, we performed MR-guided biopsy in patients who underwent prior transrectal US-guided biopsies with increasing clinical suspicion for cancer. Thus, our patients may be at a higher risk for GS upgrading. In addition, at the time of MR-guided biopsy, our biopsies were not confounded by postbiopsy artifacts. When stratifying results according to tumor location, 7.8% of clinically significant cancers missed with transrectal US-guided biopsy and detected with in-bore MR-guided biopsy were in the transition zone (10). In our study, there were no significant differences in the detection of PCa, irrespective of location (34 of 63 targets [54.0%] in the transition zone vs 29 of 43 targets [67.4%] in the peripheral zone, P = .16). These findings suggest that in-bore MR-guided biopsy may be favored over transrectal US-guided biopsy in patients with transition zone tumors.
When stratifying results according to location of targets, we and others who report on MR-guided targeted biopsy report a higher percentage of targets in the transition zone than in the peripheral zone (16). Of the published studies on MR-guided targeted biopsy, 44% of MR-US fusion procedures (17) and 47% of in-bore biopsies of the lesions were in the peripheral zone (10). Reported rates are consistent with our rate of 41.1% of the target lesions in the peripheral zone. This is in contrast to more than 70% targets with positive findings in the peripheral zone in standard transrectal US-guided biopsy (18). With the use of MR guidance, the proportion of targets in the peripheral zone to those in the transition zone has reversed when compared with traditional transrectal US-guided biopsy. This is likely explained by the referred population; many patients referred for MR-guided biopsy underwent failed transrectal US-guided biopsy procedures.
Finally, our study demonstrates that PI-RADS versions 1 and 2 for 3-T multiparametric prostate MR imaging were comparable for grading potential MR targets for subsequent 3-T MR-guided biopsy. Our AUC of 0.81 for PI-RADS version 2 is similar to the AUC of 0.83 published by Kasel-Siebert et al (13). Unlike Kasel-Siebert et al, who showed a significant improvement in diagnostic performance of PI-RADS version 2 compared with version 1, our performance for both was generally comparable. In addition, we report a higher specificity of 33.8% for PI-RADS version 2 compared with 6.5% for PI-RADS version 1. In PI-RADS version 1, the proportion of category 3 made up 47% of the cases. In contrast, the proportion of category 3 made up 23% of the cases, and the remainder was downgraded to category 2. Our results suggest that PI-RADS version 2 may lead to better risk stratification of category 3 targets on the basis of version 1 in our population. A similar improvement in specificity with PI-RADS version 2 was observed with both experienced readers (PI-RADS version 1, 0.53; PI-RADS version 2, 0.74) and unexperienced readers (PI-RADS version 1, 0.53; PI-RADS version 2, 0.71) when using a threshold of categories 4–5 (compared with categories 1–4) (13). The reported higher AUC for lesions in the transition zone compared with peripheral zone lesions in both PI-RADS versions 1 and 2 is consistent across studies (13,19). The lower performance in the peripheral zone (vs the transition zone) may be due to change in algorithm, which sets a size threshold of at least 1.5 cm for both T2-weighted imaging and DWI for a target to considered category 5. It is reported that MR imaging leads to underestimation of tumor volume and diameter at final pathology assessment (20,21). Thus, setting a lower size threshold and reconsidering T2-weighted imaging for the peripheral zone may improve overall performance for the next edition of PI-RADS.
Overall, PI-RADS version 2 categories were used to effectively risk-stratify patients who underwent 3-T MR-guided biopsy. The diagnostic yield for overall and clinically significant PCa at 3-T MR-guided biopsy increased with increasing PI-RADS version 2 category, ranging from 19.3% for category 3 to 78.0% for category 4 and 82.8% for category 5. This is similar to published studies on MR-US fusion biopsy (16%–26% for category 3, 30%–62% for category 4, and 78%–89% for category 5) (22,23). A diagnostic yield of 16%–26% for category 3 underscores the need consider category 3 and higher as the threshold for proceeding to biopsy, rather than using category 4 as the threshold.
There were limitations to this study. First, the study was retrospective and was thus subject to biases. Second, our patients were referred from urologists; thus, patients presented with various levels of clinical suspicion for PCa and were therefore subject to intrinsic referral bias. Third, this was a single-institution experience at a tertiary academic center with extensive prostate MR imaging and pathology expertise; thus, our performance may not be generalizable to all populations. Fourth, we did not have a control arm (ie, transrectal US-guided imaging); thus, our conclusions are based on historical reports. Fifth, we had no surgical standard of reference. Sixth, we did not correct for multiple comparisons. Despite these limitations, this is among the larger cohorts studied in MR-guided prostate biopsy. In addition, there was consistency in the biopsy technique. Also, all biopsies were performed with state-of-the-art high-Tesla magnets.
In conclusion, we demonstrated that 3-T MR-guided prostate biopsy is a robust method for diagnosing PCa when potential targets are detected on 3-T multiparametric prostate MR images and stratified according to PI-RADS version 1 or 2, with a progressive increase in PCa detection with higher PI-RADS score. MR-guided biopsy had the highest diagnostic yield in patients with prior diagnosis of PCa with GS of 6, and most of these patients were upgraded to higher GS and clinically significant PCa. Clinically significant PCa was also detected in a large percentage of patients with increased PSA level, prior negative biopsy findings, and no previous biopsy. PI-RADS version 2 performance is improved over version 1. However, the results of this study show that the diagnostic yield in the peripheral zone should be re-evaluated for further improvement. In general, higher PI-RADS version 2 category yielded higher proportion of clinically significant disease; however, specificity remains low. PI-RADS version 2 provides a more granular improvement over version 1, and we look forward to its continued evolution.
Advances in Knowledge
■ With 3-T in-bore MR-guided biopsy, prostate cancer (PCa) was diagnosed in 59.4% (63 of 106) of all patients and 53.7% (72 of 134) of targets biopsied, 68.0% (49 of 72 targets) of which were clinically significant PCa (Gleason score ≥ 7).
■ MR-guided biopsy was used to detect clinically significant PCa in 47.8% of patients (11 of 23) with no prior transrectal US-guided biopsy, 38.2% of patients (13 of 34) with prior negative biopsy findings, and 42.8% of patients (21 of 49) with prior PCa diagnosis.
■ The areas under the curve for positive MR-guided biopsy targets for Prostate Imaging Reporting and Data System (PI-RADS) versions 2 and 1 were 0.82 and 0.81 (P = .87), respectively.
■ By using PI-RADS version 2 categories 3–5 as a cutoff threshold, the sensitivity, specificity, positive predictive value, negative predictive value, and accuracy for diagnosis of PCa in all patients with MR-guided biopsy targets were 95.8%, 33.8%, 62.7%, 87.5%, and 67.2%, respectively.
Implication for Patient Care
■ PI-RADS version 2 categories can be used effectively to risk-stratify men who would benefit from MR-guided biopsy.
Acknowledgments
Acknowledgment
We are grateful to Grace Kim, PhD, for her review of statistics.
Received January 12, 2016; revision requested March 8; revision received July 12; accepted August 4; final version accepted September 7.
N.T. and W.C.L. contributed equally to this work.
Supported by the Department of Radiology and Pathology Integrated Diagnostics Program and the National Cancer Institute (P50CA092131).
Disclosures of Conflicts of Interest: N.T. disclosed no relevant relationships. W.C.L. disclosed no relevant relationships. P.K. disclosed no relevant relationships. N.H.A. disclosed no relevant relationships. J.Y. disclosed no relevant relationships. D.J.A.M. Activities related to the present article: disclosed no relevant relationships. Activities not related to the present article: author received “other” from Blue Earth Diagnostics for serving on a consulting panel; author received “other” from MedQIA for serving as a clinical trials reader. Other relationships: disclosed no relevant relationships. D.S.K.L. disclosed no relevant relationships. H.W. Activities related to the present article: disclosed no relevant relationships. Activities not related to the present article: institution received grants from Siemens Medical Solutions. Other relationships: disclosed no relevant relationships. K.H.S. disclosed no relevant relationships. D.Y.L. disclosed no relevant relationships. J.H. disclosed no relevant relationships. S.S.R. disclosed no relevant relationships.
Abbreviations:
- ADC
- apparent diffusion coefficient
- AUC
- area under the curve
- DCE
- dynamic contrast material enhancement
- DWI
- diffusion-weighted imaging
- GS
- Gleason score
- IQR
- interquartile range
- PCa
- prostate cancer
- PI-RADS
- Prostate Imaging Reporting and Data System
- PSA
- prostate-specific antigen
References
- 1.American Cancer Society . Key statistics for prostate cancer. http://www.cancer.org/cancer/prostatecancer/detailedguide/prostate-cancer-key-statistics. Published 2015. Accessed April 29, 2016.
- 2.American Urological Association . Early Detection of Prostate Cancer. AUA Guidelines. https://www.auanet.org/education/guidelines/prostate-cancer-detection.cfm. Published DATE. Accessed April 28, 2016.
- 3.Barentsz JO. A global standard for prostate MRI reporting [abstr]. In: Radiological Society of North America Scientific Assembly and Annual Meeting Program. Oak Brook, Ill: Radiological Society of North America, 2013; 73. [Google Scholar]
- 4.McClure TD, Margolis DJ, Reiter RE, et al. Use of MR imaging to determine preservation of the neurovascular bundles at robotic-assisted laparoscopic prostatectomy. Radiology 2012;262(3):874–883. [DOI] [PubMed] [Google Scholar]
- 5.Tan N, Margolis DJ, McClure TD, et al. Radical prostatectomy: value of prostate MRI in surgical planning. Abdom Imaging 2012;37(4):664–674. [DOI] [PubMed] [Google Scholar]
- 6.Moore CM, Robertson NL, Arsanious N, et al. Image-guided prostate biopsy using magnetic resonance imaging-derived targets: a systematic review. Eur Urol 2013;63(1):125–140. [DOI] [PubMed] [Google Scholar]
- 7.Rosenkrantz AB, Oto A, Turkbey B, Westphalen AC.Prostate Imaging Reporting and Data System (PI-RADS), version 2: a critical look. AJR Am J Roentgenol 2016;206(6):1179–1183. [DOI] [PubMed] [Google Scholar]
- 8.American College of Radiology . Prostate Imaging Reporting and Data System version 2.0. American College of Radiology website. http://www.acr.org/∼/media/ACR/Documents/PDF/QualitySafety/Resources/PIRADS/PIRADS%20V2.pdf. Published December 2015. Accessed April 24, 2016.
- 9.Barentsz JO, Richenberg J, Clements R, et al. ESUR prostate MR guidelines 2012. Eur Radiol 2012;22(4):746–757. [DOI] [PMC free article] [PubMed] [Google Scholar]
- 10.Quentin M, Blondin D, Arsov C, et al. Prospective evaluation of magnetic resonance imaging guided in-bore prostate biopsy versus systematic transrectal ultrasound guided prostate biopsy in biopsy naïve men with elevated prostate specific antigen. J Urol 2014;192(5):1374–1379. [DOI] [PubMed] [Google Scholar]
- 11.Franiel T, Stephan C, Erbersdobler A, et al. Areas suspicious for prostate cancer: MR-guided biopsy in patients with at least one transrectal US-guided biopsy with a negative finding—multiparametric MR imaging for detection and biopsy planning. Radiology 2011;259(1):162–172. [DOI] [PubMed] [Google Scholar]
- 12.Engelhard K, Hollenbach HP, Kiefer B, Winkel A, Goeb K, Engehausen D. Prostate biopsy in the supine position in a standard 1.5-T scanner under real time MR-imaging control using a MR-compatible endorectal biopsy device. Eur Radiol 2006;16(6):1237–1243. [DOI] [PubMed] [Google Scholar]
- 13.Kasel-Seibert M, Lehmann T, Aschenbach R, et al. Assessment of PI-RADS v2 for the Detection of Prostate Cancer. Eur J Radiol 2016;85(4):726–731. [DOI] [PubMed] [Google Scholar]
- 14.Arsov C, Rabenalt R, Blondin D, et al. Prospective randomized trial comparing magnetic resonance imaging (MRI)-guided in-bore biopsy to MRI-ultrasound fusion and transrectal ultrasound-guided prostate biopsy in patients with prior negative biopsies. Eur Urol 2015;68(4):713–720. [DOI] [PubMed] [Google Scholar]
- 15.Da Rosa MR, Milot L, Sugar L, et al. A prospective comparison of MRI-US fused targeted biopsy versus systematic ultrasound-guided biopsy for detecting clinically significant prostate cancer in patients on active surveillance. J Magn Reson Imaging 2015;41(1):220–225. [DOI] [PubMed] [Google Scholar]
- 16.Hamoen EH, de Rooij M, Witjes JA, Barentsz JO, Rovers MM. Use of the Prostate Imaging Reporting and Data System (PI-RADS) for prostate cancer detection with multiparametric magnetic resonance imaging: a diagnostic meta-analysis. Eur Urol 2015;67(6):1112–1121. [DOI] [PubMed] [Google Scholar]
- 17.Junker D, Schäfer G, Edlinger M, et al. Evaluation of the PI-RADS scoring system for classifying mpMRI findings in men with suspicion of prostate cancer. BioMed Res Int 2013;2013:252939 . [DOI] [PMC free article] [PubMed] [Google Scholar]
- 18.Shariat SF, Roehrborn CG. Using biopsy to detect prostate cancer. Rev Urol 2008;10(4):262–280. [PMC free article] [PubMed] [Google Scholar]
- 19.Vargas HA, Hötker AM, Goldman DA, et al. Updated prostate imaging reporting and data system (PIRADS v2) recommendations for the detection of clinically significant prostate cancer using multiparametric MRI: critical evaluation using whole-mount pathology as standard of reference. Eur Radiol 2016;26(6):1606–1612. [DOI] [PMC free article] [PubMed] [Google Scholar]
- 20.Turkbey B, Mani H, Aras O, et al. Correlation of magnetic resonance imaging tumor volume with histopathology. J Urol 2012;188(4):1157–1163. [DOI] [PMC free article] [PubMed] [Google Scholar]
- 21.Khoshnoodi P, Tan N, Margolis DJ, et al. Correlation between diameter of prostate cancer foci on multiparametric prostate MRI and whole mount histopathology: stratified by PI-RADS and Gleason score [abstr]. J Urol 2015;193(4 Suppl):e900–e901. [Google Scholar]
- 22.Cash H, Maxeiner A, Stephan C, et al. The detection of significant prostate cancer is correlated with the Prostate Imaging Reporting and Data System (PI-RADS) in MRI/transrectal ultrasound fusion biopsy. World J Urol 2016;34(4):525–532. [DOI] [PubMed] [Google Scholar]
- 23.Mertan FV, Greer MD, Shih JH, et al. Prospective evaluation of the Prostate Imaging Reporting and Data System version 2 for prostate cancer detection. J Urol 2016;196(3):690–696. [DOI] [PubMed] [Google Scholar]


