

Data from a large, diverse set of breast imaging facilities in the Breast Cancer Surveillance Consortium, linked to state cancer registries, provide performance benchmarks for diagnostic mammography in the era of digital mammography.
Abstract
Purpose
To establish contemporary performance benchmarks for diagnostic digital mammography with use of recent data from the Breast Cancer Surveillance Consortium (BCSC).
Materials and Methods
Institutional review board approval was obtained for active or passive consenting processes or to obtain a waiver of consent to enroll participants, link data, and perform analyses. Data were obtained from six BCSC registries (418 radiologists, 92 radiology facilities). Mammogram indication and assessments were prospectively collected for women undergoing diagnostic digital mammography and linked with cancer diagnoses from state cancer registries. The study included 401 548 examinations conducted from 2007 to 2013 in 265 360 women.
Results
Overall diagnostic performance measures were as follows: cancer detection rate, 34.7 per 1000 (95% confidence interval [CI]: 34.1, 35.2); abnormal interpretation rate, 12.6% (95% CI: 12.5%, 12.7%); positive predictive value (PPV) of a biopsy recommendation (PPV2), 27.5% (95% CI: 27.1%, 27.9%); PPV of biopsies performed (PPV3), 30.4% (95% CI: 29.9%, 30.9%); false-negative rate, 4.8 per 1000 (95% CI: 4.6, 5.0); sensitivity, 87.8% (95% CI: 87.3%, 88.4%); and specificity, 90.5% (95% CI: 90.4%, 90.6%). Among cancers detected, 63.4% were stage 0 or 1 cancers, 45.6% were minimal cancers, the mean size of invasive cancers was 21.2 mm, and 69.6% of invasive cancers were node negative. Performance metrics varied widely across diagnostic indications, with cancer detection rate (64.5 per 1000) and abnormal interpretation rate (18.7%) highest for diagnostic mammograms obtained to evaluate a breast problem with a lump. Compared with performance during the screen-film mammography era, diagnostic digital performance showed increased abnormal interpretation and cancer detection rates and decreasing PPVs, with less than 70% of radiologists within acceptable ranges for PPV2 and PPV3.
Conclusion
These performance measures can serve as national benchmarks that may help transform the marked variation in radiologists’ diagnostic performance into targeted quality improvement efforts.
© RSNA, 2017
Introduction
Diagnostic mammography is used for women who present with clinical signs and symptoms, those with a recent abnormal screening mammogram, or those undergoing short-interval follow-up for a finding previously assessed as probably benign (1). The Mammography Quality Standards Act requires that mammography facilities establish a system for regular auditing of medical outcomes associated with mammograms assessed as suspicious for malignancy or highly suggestive of malignancy (2). The American College of Radiology recommends more comprehensive auditing of outcomes associated with all mammograms, with statistics prepared separately for screening and diagnostic mammography (1). To facilitate evaluation of facility and individual radiologist performance for diagnostic mammography, the 5th edition of the American College of Radiology’s Breast Imaging Reporting and Data System (BI-RADS) (1) includes two sets of comparator statistics: national diagnostic mammography benchmark statistics from the Breast Cancer Surveillance Consortium (BCSC) from 1996 to 2005 (3,4) and acceptable ranges of performance recommended by a panel of breast imaging experts (5).
During the past 10 years, substantial changes have occurred in the clinical practice of mammography in the United States–most notably the transition from screen-film to digital mammography. Updated national statistics are needed to evaluate the current performance of diagnostic digital mammography and to provide contemporary benchmarks for facility auditing. The purpose of this study was to establish contemporary performance benchmarks for diagnostic digital mammography with use of recent data from the BCSC.
Materials and Methods
Data Sources
The BCSC is a collaborative network of mammography registries with links to cancer registries and pathology databases (6). Data for this study were provided by the following BCSC mammography registries (http://www.BCSC-research.org/): Carolina Mammography Registry, Group Health Cooperative in western Washington State, Metropolitan Chicago Breast Cancer Registry, New Hampshire Mammography Network, San Francisco Mammography Registry, and the Vermont Breast Cancer Surveillance System. Each registry prospectively collects patient characteristics, radiology information, and cancer diagnoses for women undergoing breast imaging at participating radiology facilities. The catchment population of the participating BCSC facilities is comparable to that of the United States in terms of race and/or ethnicity, education, economic status, and rural-urban mix (3). A total of 92 mammography facilities contributed data to this study, including data from 418 individual radiologists. Institutional review board approval was obtained for active or passive consenting processes or a waiver of consent to enroll participants, link data, and perform analyses. All procedures were compliant with the Health Insurance Portability and Accountability Act, and a federal Certificate of Confidentiality was obtained to protect the identities of women, physicians, and facilities. Previous reports of BCSC registries and the Statistical Coordinating Center are available at http://www.bcsc-research.org/publications/index.html.
Participants
The study population included women aged 18 years and older who underwent diagnostic digital mammography in 2007–2013. All examinations had at least 1 year of complete cancer registry follow-up data available. Examinations were excluded if the BI-RADS assessment was missing (n = 1238), if the final BI-RADS assessment was category 0 (incomplete, needs additional imaging; n = 2183), or if the woman reported a history of breast augmentation or mastectomy (n = 7363). Notably, diagnostic examinations with an initial category 0 assessment but a nonzero final assessment were included (n = 7322; see below for further details).
Data Collection
Women provided demographic and breast health history information on a self-administered questionnaire completed at each mammography examination. This included age, race and/or ethnicity, first-degree family history of breast cancer, history of breast cancer, time since last mammogram, history of breast biopsies, and presence of symptoms (lump, nipple discharge, breast pain, and other). Complete risk factor data were missing for some women owing to nonresponse.
Indications for mammography were recorded prospectively by the interpreting radiologist along with the BI-RADS assessment category and breast density categorization (1,7). Diagnostic mammograms were further subclassified (except from the one registry at which subclassification was not available) by the radiologist as being obtained for additional evaluation of a recent mammographic finding, short-interval follow-up, or evaluation of a breast problem (symptomatic; with or without palpable lump reported).
In clinical practice, multiple diagnostic mammograms are sometimes needed to arrive at a final assessment. We followed a similar approach to that of Sickles et al (3) for selecting and characterizing diagnostic mammograms. When at least one diagnostic mammogram followed an initial diagnostic mammogram assessed as category 0, all mammograms up to and including the first mammogram with a nonzero assessment (within 180 days) were treated as a single observation. The date of and indication for mammography were taken from the initial mammogram (the first one with a category 0 assessment). Assessment and management recommendations were taken from the first mammogram with a nonzero assessment, and the observed clinical outcome was attributed to the radiologist who made that first nonzero assessment.
Breast cancer diagnoses and tumor characteristics were obtained by linkage to pathology databases, regional Surveillance, Epidemiology, and End Results programs, and state cancer registries.
Measures and Definitions
Each woman’s 5-year risk for invasive cancer was calculated on the basis of age, race and/or ethnicity, first degree family history of breast cancer, history of breast biopsy, benign breast disease type, and breast density by using the BCSC risk calculator, version 2 (https://tools.bcsc-scc.org/BC5yearRisk/calculator.htm) (8).
Positive diagnostic mammograms were defined as those with a final assessment category of 4 (suspicious for malignancy) or 5 (highly suggestive of malignancy). Negative diagnostic mammograms were those with a final assessment category of 1 (negative), 2 (benign finding), or 3 (probably benign). In cases where separate assessments were provided for each breast, an overall assessment was assigned on the basis of the more abnormal assessment according to the following hierarchy of categories: 5, 4, 3, 2, and 1. Cancer was defined as a diagnosis of invasive breast cancer or ductal carcinoma in situ during the 1 year after the diagnostic mammogram.
We followed the BI-RADS manual (5th edition) for defining all performance metrics, including the cancer detection rate, abnormal interpretation rate, positive predictive value (PPV) of a biopsy recommendation (PPV2), PPV of biopsies performed (PPV3), false-negative rate, sensitivity, and specificity (1). Cancer characteristics, which were also defined according the BI-RADS 5th edition manual (1), included the percentage of true-positive invasive cancers that were node negative, percentage of true-positive cancers that were “minimal” (node-negative invasive cancers ≤1 cm or ductal carcinoma in situ of any size), and percentage of true-positive cancers that were stage 0 or stage 1. In addition, we computed the mean size of true-positive invasive cancers.
Statistical Analysis
Descriptive statistics for all performance metrics and cancer characteristics were generated for the entire sample of diagnostic mammograms and according to subclassification of diagnostic indication. The 95% confidence intervals were calculated by using Wald confidence limits for binomial proportions. We conducted sensitivity analyses to examine the robustness of these statistics in relation to the exclusion of the 2183 examinations with no nonzero assessments within 180 days. We recalculated the descriptive statistics under two alternative conditions where the unresolved category 0 examinations were included as either positive or negative examinations.
To characterize the degree of variability across radiologists, we computed the 10th, 25th, 50th, 75th, and 90th percentile values for each measure. To avoid the inclusion of radiologists with zero observed events for each outcome of interest owing to extremely low volume, we restricted the analyses of radiologist variability to radiologists meeting a subjectively determined minimum number of examinations or cancers for each measure on the basis of previous publications (3,5). These limits were as follows: cancer detection rate, abnormal interpretation rate, and false-negative rate, 100 examinations (168 radiologists and 4517 examinations excluded); PPV2, 10 positive examinations (97 radiologists and 343 examinations excluded); PPV3, 10 biopsies performed (84 radiologists and 284 examinations excluded); sensitivity, 10 cancers (205 radiologists and 11 170 examinations excluded); specificity, 100 noncancers (170 radiologists and 4827 examinations excluded); mean invasive cancer size and percentage node negative, 10 true-positive invasive cancers (130 radiologists and 461 examinations excluded); percentage minimal cancers and percentage stage 0 or 1 cancers, 10 true-positive cancers (122 radiologists and 436 examinations excluded).
We also computed the percentage of radiologists meeting acceptable ranges of diagnostic mammography performance established by breast imaging experts, as available for examinations conducted for additional evaluation of abnormal screening and for examinations conducted for the evaluation of a palpable lump (1,5). Histograms were constructed to illustrate the distribution of performance metrics across radiologists. A smoothed curve was fit to each histogram by using kernel density estimation (9), a nonparametric estimate that provides an alternative visualization of the distribution of radiologists that is independent of the number of bins used in creating the histogram. Finally, overall descriptive statistics for performance metrics and cancer characteristics were summarized in tabular form and contrasted with previously published BCSC data from the screen-film mammography era (3), with χ2 testing used to determine statistical significance of differences. Two-sided P < .05 was considered indicative of a statistically significant difference. All statistical analyses were performed by using software (SAS, version 9.3; SAS Institute, Cary, NC).
Results
The final sample size was 401 548 diagnostic digital mammography examinations obtained in 265 360 women (Table 1). More than 30% of the study population reported a race other than non-Hispanic white. Compared with the entire sample of women who underwent diagnostic mammography, women who underwent diagnostic mammography for additional evaluation after a recent mammogram were less likely to have a personal history of breast cancer at the time of mammography. Women who underwent short-interval follow-up examinations were more likely to have a history of breast biopsy. Women who underwent evaluation of a breast problem tended to be younger and were less likely to have previously undergone mammography.
Table 1.
Clinical Characteristics for 401 548 Diagnostic Digital Mammography Examinations among 265 360 Women according to Indication for Mammography
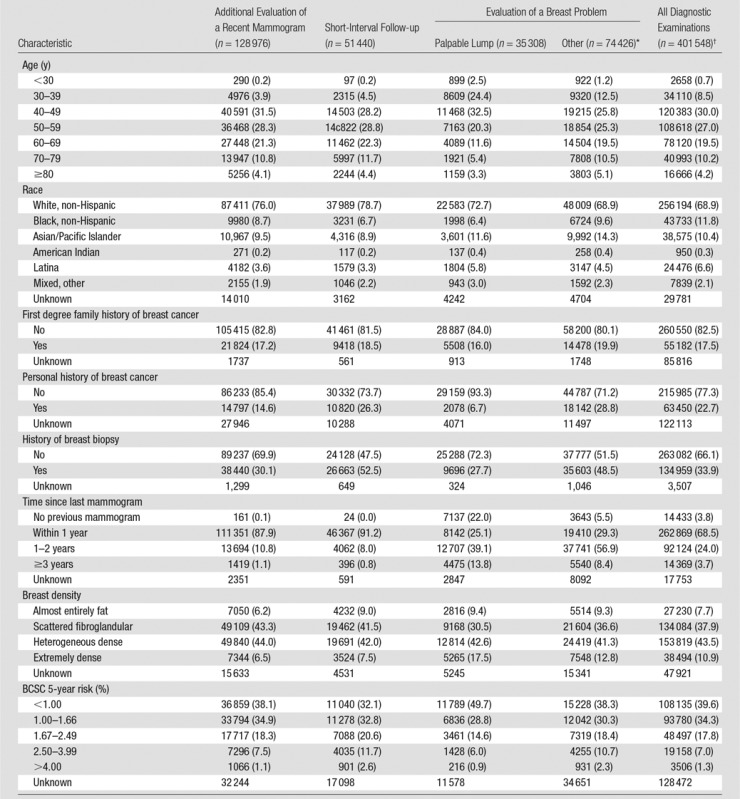
Note.—Numbers in parentheses are percentages. Percentages are based on the total number of examinations that do not have an unknown value for that variable.
*“Other” includes evaluation of a breast problem with no lump (n = 67 761) or evaluation of a breast problem with unknown lump status (n = 6665).
†Includes 94 228 examinations from one registry for which subclassification of diagnostic indication (eg, additional evaluation, short-interval follow-up) was not available.
The overall abnormal interpretation rate was 12.6% and the cancer detection rate was 34.7 per 1000, with a PPV2 of 27.5% (Table 2). The abnormal interpretation rate ranged from 5.2% for short-interval follow-up examinations to 18.7% for the evaluation of a breast problem with a lump reported. The cancer detection rate ranged from 10.2 per 1000 for short-interval follow-up examinations to 64.5 per 1000 for the evaluation of a breast problem with a lump reported. The PPV2 was lowest for short-interval follow-up and highest for the evaluation of a breast problem with a lump reported.
Table 2.
Performance Measures for 401 548 Diagnostic Digital Mammography Examinations among 265 360 Women according to Indication for Mammography
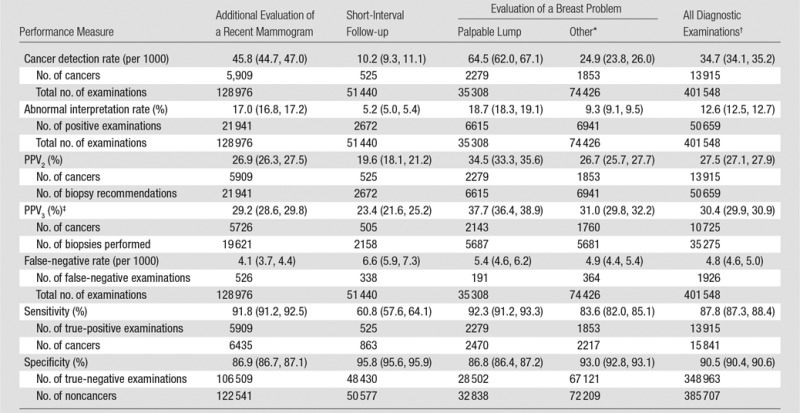
Note—Numbers in parentheses are 95% confidence intervals.
* “Other” includes evaluation of a breast problem with no lump (n = 67 761) or evaluation of a breast problem with unknown lump status (n = 6665).
†Includes 94 228 examinations from one registry for which subclassification of diagnostic indication (eg, additional evaluation, short-interval follow-up) was not available.
‡Does not include data from one registry, for which the denominator of biopsies performed was unavailable.
A total of 1926 false-negative examinations were recorded, for an overall false-negative rate of 4.8 per 1000 and a sensitivity of 87.8%. Sensitivity was lowest (60.8%) among short-interval follow-up examinations. Overall specificity was 90.5% and was highest among short-interval follow-up examinations (95.8%).
Sensitivity analyses demonstrated that all of the above results were minimally affected (<5% relative change in each measure) if unresolved category 0 examinations were included and alternatively treated either as positive examinations or negative examinations.
Among the 13915 cancers detected with diagnostic mammography, 3329 (23.9%) were ductal carcinoma in situ and 10 586 (76.1%) were invasive.Mean invasive cancer tumor size was 21.2 mm; 69.6% of cancers had a negative lymph node status (Table 3). Across specific diagnostic indications, cancers detected with diagnostic mammography performed to evaluate a breast problem with a lump reported tended to have poorer prognostic characteristics, including a greater percentage of invasive cancers (93.4%), lower percentage of minimal cancers (16.7%), larger mean tumor size (28.6 mm), and higher percentage of node-positive disease (41.4%).
Table 3.
Characteristics of Cancers Detected with 401 548 Diagnostic Digital Mammography Examinations in 265 360 Women according to Indication for Mammography
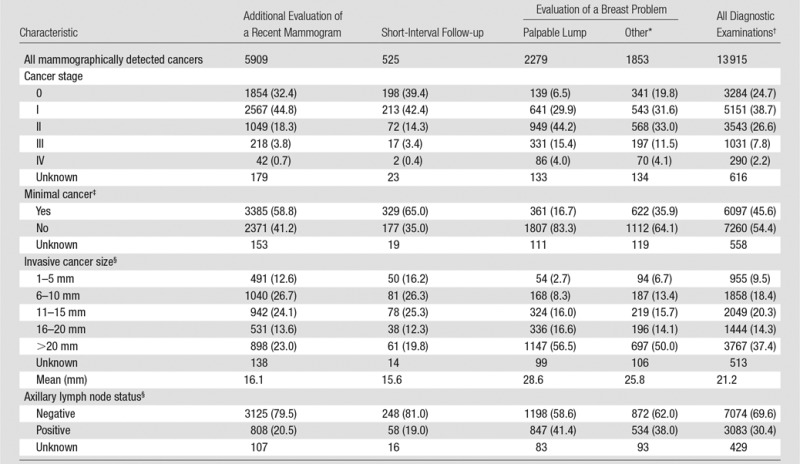
Note.—Except where indicated, data are numbers of patients, with percentages in parentheses. Percentages are based on the total number of examinations that do not have an unknown value for that variable.
*“Other” includes evaluation of a breast problem with no lump (n = 67 761) or evaluation of a breast problem with unknown lump status (6665).
† Includes 94 228 examinations from one registry for which subclassification of diagnostic indication (eg, additional evaluation, short interval follow-up) was not available.
‡Ductal carcinoma in situ or invasive cancer measuring 10 mm or less.
§Among invasive cancers only.
Performance metrics varied widely across radiologists for all diagnostic mammography indications combined (Table 4, Figure). For example, 25% of radiologists had a cancer detection rate of less than 26.2 per 1000, whereas the upper 25% of radiologists had a cancer detection rate exceeding 44.7 per 1000. The abnormal interpretation rate varied from less than 5.9% for the lowest 10% of radiologists to greater than 18.2% for the highest 10% of radiologists, with the middle 50% having an abnormal interpretation rate between 8.2% and 14.8%.
Table 4.
Performance Benchmarks on the Basis of 401 548 Diagnostic Digital Mammography Examinations
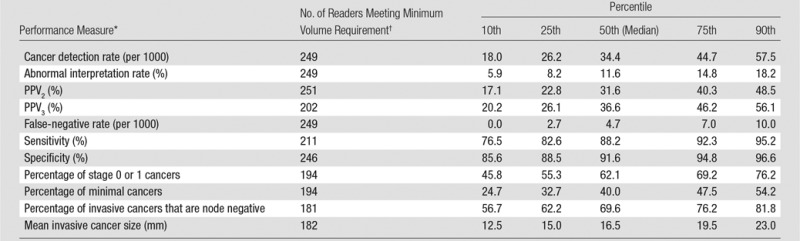
Figure a:

Distribution of diagnostic mammography imaging performance metrics by radiologist (a) cancer detection rate, (b) abnormal interpretation rate, (c) PPV2, (d) PPV3, (e) sensitivity, and (f) specificity. Dashed lines indicate location of 10th, 25th, 50th, 75th, and 90th percentiles. Solid line represents smoothed curve fit to each histogram with kernel density estimation.
Figure b:

Distribution of diagnostic mammography imaging performance metrics by radiologist (a) cancer detection rate, (b) abnormal interpretation rate, (c) PPV2, (d) PPV3, (e) sensitivity, and (f) specificity. Dashed lines indicate location of 10th, 25th, 50th, 75th, and 90th percentiles. Solid line represents smoothed curve fit to each histogram with kernel density estimation.
Figure c:

Distribution of diagnostic mammography imaging performance metrics by radiologist (a) cancer detection rate, (b) abnormal interpretation rate, (c) PPV2, (d) PPV3, (e) sensitivity, and (f) specificity. Dashed lines indicate location of 10th, 25th, 50th, 75th, and 90th percentiles. Solid line represents smoothed curve fit to each histogram with kernel density estimation.
Figure d:

Distribution of diagnostic mammography imaging performance metrics by radiologist (a) cancer detection rate, (b) abnormal interpretation rate, (c) PPV2, (d) PPV3, (e) sensitivity, and (f) specificity. Dashed lines indicate location of 10th, 25th, 50th, 75th, and 90th percentiles. Solid line represents smoothed curve fit to each histogram with kernel density estimation.
Figure e:

Distribution of diagnostic mammography imaging performance metrics by radiologist (a) cancer detection rate, (b) abnormal interpretation rate, (c) PPV2, (d) PPV3, (e) sensitivity, and (f) specificity. Dashed lines indicate location of 10th, 25th, 50th, 75th, and 90th percentiles. Solid line represents smoothed curve fit to each histogram with kernel density estimation.
Figure f:

Distribution of diagnostic mammography imaging performance metrics by radiologist (a) cancer detection rate, (b) abnormal interpretation rate, (c) PPV2, (d) PPV3, (e) sensitivity, and (f) specificity. Dashed lines indicate location of 10th, 25th, 50th, 75th, and 90th percentiles. Solid line represents smoothed curve fit to each histogram with kernel density estimation.
Performance metrics within specific subclassifications of diagnostic mammography indications are included in Tables E1–E4 (online). For examinations conducted for the additional evaluation of a recent mammographic finding, more than 75% of radiologists were within the acceptable range of performance recommended by breast imaging experts (5) for cancer detection rate, abnormal interpretation rate, sensitivity, and specificity (Table E1 [online]). Less than 70% of radiologists were within the acceptable range for PPV2 (69.2%) and PPV3 (66.7%). For examinations conducted to evaluate a breast problem with a lump reported, more than 75% of radiologists were within acceptable ranges for cancer detection rate, abnormal interpretation rate, and sensitivity (Table E3 [online]). Less than 70% of radiologists were within the acceptable range for PPV2 (62.5%), PPV3 (53.1%), and specificity (69.9%).
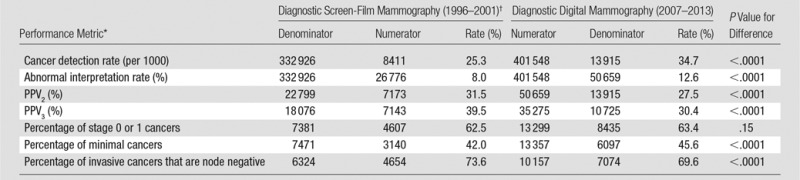
Comparison of our current results to the 2005 BCSC benchmarks publication (3) reveals clinically meaningful changes in diagnostic mammography performance metrics during the past 10 years (Table 5). For all diagnostic indications combined, the abnormal interpretation rate increased from 8.0% to 12.6%, the cancer detection rate increased from 25.3 to 34.7 per 1000, and the PPV2 decreased from 31.5% to 27.5%. These patterns were generally consistent within each subclassification of diagnostic indication.
Table 5.
Comparison of Diagnostic Mammography Performance in the BCSC during the Contemporary Digital Mammography Era (2007–2013) to Previous Benchmarks for Screen-Film Diagnostic Mammography Performance (1996–2001)
Discussion
Our results provide an assessment of the performance of diagnostic digital mammography in the United States, including overall statistics as well as variation across radiologists. These data can be used to evaluate the contemporary quality of diagnostic digital mammography compared with historical statistics and performance targets set by professional societies. Individual radiologists and breast imaging clinics can use our results to determine how their performance compares to that of a national sample of radiologists.
We restricted our study to digital mammography to provide performance measures that are relevant for current clinical practice; 98% of mammography examinations performed since 2012 in the BCSC are digital and, according to the U.S. Food and Drug Administration, 98% of currently certified mammography facilities (as of October 2016) in the United States use digital mammography (10). National performance benchmarks for diagnostic mammography were previously published by the BCSC in 2005, based on examinations conducted between 1996 and 2001 (3). During that period, more than 99% of diagnostic mammograms in the BCSC were screen-film mammograms. Examinations in the current study were performed from 2007 to 2013, a time in which 84% of all diagnostic mammography examinations in the BCSC were digital. Although most facilities in the study performed digital mammography exclusively during the study period, some facilities offered both screen-film and digital mammography concurrently for at least some period of time. We have previously shown that during the transition from screen-film to digital mammography in BCSC facilities, women undergoing screen-film mammography were similar to those undergoing digital mammography in terms of age, race and/or ethnicity, family history of breast cancer, and breast density (11). Thus, the low utilization of screen-film mammography during the study period and the lack of evidence for triaging women to one modality over another indicate that selection bias is very unlikely to have a substantial influence on our results.
As in previous studies (3,12,13), we observed that performance measures for diagnostic mammography vary substantially according to the subclassification of diagnostic indication. Facilities and radiologists conducting diagnostic outcomes auditing should be cognizant of these differences when evaluating their performance metrics if combining all diagnostic indications. Most notable are the differences in abnormal interpretation, cancer detection, PPV, and cancer characteristic statistics for short-interval follow-up examinations compared with examinations conducted for the evaluation of a breast problem in which a lump is reported. Women undergoing mammography for diagnostic work-up of a palpable lump are much more likely to have a positive examination, a cancer diagnosis, and adverse cancer characteristics. Examinations performed for short-interval follow-up had a much lower cancer detection rate and PPV compared with those performed for the other diagnostic indications, consistent with the intended use of the BI-RADS category 3 assessment and short-interval follow-up for cases with less than 2% chance of malignancy.
The high false-negative rate and low sensitivity of short-interval follow-up examinations is striking; however, they must be interpreted with caution. Women with negative findings at short-interval follow-up examination typically undergo their next breast imaging examination in 6 months, rather than the 12-month interval more typical of women undergoing diagnostic mammography for other indications (eg, women with a negative diagnostic examination conducted for additional evaluation after a screening examination). This more frequent mammographic examination provides additional opportunity for the diagnosis of cancers that would be counted as false-negative findings for the index short-interval follow-up examination. A previous BCSC study (13) demonstrated a similar sensitivity (60.5%) for short-interval follow-up examinations conducted during 1994–2004. The sensitivity improved to 83.3% when the definition of sensitivity was modified to include only cancers diagnosed within 6 months.
In comparison to the 2005 BCSC diagnostic mammography benchmarks (3), we observed an increase in the abnormal interpretation rate and cancer detection rate and a decrease in PPV2. Reasons for these changes are likely to be multifactorial but likely reflect improvements in mammography imaging technology, which permit the visualization of smaller lesions and greater detection of calcifications and result in increased cancer detection and abnormal interpretation rates. On balance, these changes unfortunately have resulted in lower PPV2, which suggests that the improvements in imaging may do more to permit the visualization of additional findings than to help differentiate benign from malignant findings.
There have been only small changes over time in the characteristics of cancers diagnosed with diagnostic digital mammography compared with screen-film mammography, with slight increases in the percentage of stage 0 or 1 cancers (63.4% vs 62.5%, respectively) and minimal cancers (45.6% vs 42.0%) and a slight decrease in the percentage of node-negative invasive cancers (69.6% vs 73.6%).
In our study, we used the outcome definitions provided in BI-RADS (1); thus, our results can serve as national benchmarks to be used by breast imaging radiologists and facilities when assessing their own statistics. Our results do not represent desirable goals or target levels of performance; rather, they describe the range of performance in clinical practice among a very large sample of providers in the United States. Thus, these data can be used by radiologists and facilities to put their performance statistics into context during the process of continuing quality improvement. These data can be used to complement the performance targets provided by experts as indicators of acceptable performance (5). Breast imaging facilities and radiologists should carefully consider the influence of their imaging population’s age and indication for examination on performance measures, as well as the uncertainty in estimates of performance statistics that rely on small sample sizes.
The BI-RADS manual includes recently published acceptable ranges of diagnostic mammography performance statistics established by breast imaging experts for examinations conducted for additional evaluation of abnormal screening findings and for examinations conducted for evaluation of a palpable lump (1,5). We observed that for both of these diagnostic indications, more than 75% of radiologists met acceptable ranges with regard to the cancer detection rate, abnormal interpretation rate, and sensitivity. Fewer radiologists met the acceptable ranges for PPV2 and PPV3, with only 53.1% of radiologists operating within the acceptable range for PPV3 at evaluation of a palpable lump. In addition, less than 70% of radiologists had acceptable specificity for the evaluation of a palpable lump. Overall, our results suggest that radiologists in the United States excel at detecting cancers but are often not meeting expert-based goals for reducing false-positive biopsy recommendations. Notably, European countries have achieved higher specificity in diagnostic and screening mammography in comparison to the United States, often with little trade-off in relation to sensitivity (ie, no difference or improved overall accuracy in Europe) (14–17). Thus, strategies to improve specificity in the United States should be considered if the performance targets are to be more widely met, including enhanced training opportunities and/or changes to thresholds for performing biopsy of lesions that are likely benign.
Data from a large, diverse set of breast imaging facilities in the BCSC, linked to state cancer registries, provide performance benchmarks for diagnostic mammography in the era of digital mammography. A major strength of this study is the large, geographically diverse sample of participating facilities and radiologists. More than 90% of BCSC data are collected in nonacademic community-based imaging facilities, reflecting real-world radiology practice. BCSC breast imaging registries ensure comprehensive capture of cancer outcomes through linkages with statewide cancer registries or regional Surveillance, Epidemiology, and End Results programs, enabling accurate assessment of false-negative rates, sensitivity, and specificity. Imaging facilities conducting audits without linking to regional tumor registries should consider the potential for underestimating their false-negative cancer rates and subsequently overestimating their sensitivity.
Our study had limitations. Despite the large sample population, we were unable to compute percentiles for the distribution of cancer characteristics diagnosed by means of short-interval follow-up examinations across radiologists. This largely reflects the low rate of cancer detection at short-interval follow-up. The number of examinations with missing data was small; however, diagnostic examinations at one BCSC registry could not be subclassified into specific diagnostic indication categories and thus could only be included in statistics for all diagnostic indications combined. Patient risk factor data were missing for a small percentage of patients but exceeded 20% for certain factors, including family history and personal history of breast cancer and BCSC 5-year risk.
Our results provide updated performance benchmarks for diagnostic mammography in the United States during the contemporary era of digital mammography. There have been changes in diagnostic mammography performance during the past 10 years, including increasing abnormal interpretation and cancer detection rates and decreasing PPV. Comparison to expert recommendations for acceptable performance suggests that future efforts to improve the quality of diagnostic performance should focus on reducing false-positive biopsy recommendations. Finally, as digital breast tomosynthesis diffuses into clinical practice for both breast cancer screening and diagnosis (18), future studies are needed to assess the impact on diagnostic mammography performance.
Advances in Knowledge
■ In a study of 401 548 examinations conducted during 2007–2013 in 265 360 women, the mean performance measures for all diagnostic mammograms combined were as follows: cancer detection rate, 34.7 per 1000; abnormal interpretation rate, 12.6%; positive predictive value (PPV) of a biopsy recommendation (PPV2), 27.5%; PPV of biopsies performed (PPV3), 30.4%; false-negative rate, 4.8 per 1000; sensitivity, 87.8%; specificity, 90.5%; percentage of cancers stage 0 or 1, 63.4%; percentage of minimal cancers, 45.6%; mean size of invasive cancers, 21.2 mm; and percentage of node-negative invasive cancers, 69.6%.
■ There are substantial differences in performance measures across specific indications for diagnostic mammography, with the cancer detection rate (64.5 per 1000) and abnormal interpretation rate (18.7%) highest for diagnostic mammograms obtained to evaluate a breast problem involving a lump.
■ Comparison to previous studies reveals that there have been substantial changes in the performance of diagnostic mammography during the past 10 years, including an increase in abnormal interpretations and cancer detection rates and decreasing PPV.
Implications for Patient Care
■ Individual radiologists and breast imaging facilities can use these results as benchmarks to assess how their diagnostic digital mammography performance compares to that from a national sample of women and radiologists.
■ The substantial degree of variation in performance metrics across radiologists suggests that ongoing quality improvement efforts are needed in diagnostic mammography.
SUPPLEMENTAL TABLES
Acknowledgments
Acknowledgments
We thank the BCSC investigators, participating women, mammography facilities, and radiologists for the data they have provided for this study. The collection of BCSC cancer and vital status data used in this study was supported in part by several state public health departments and cancer registries throughout the United States. For a full description of these sources, please see http://www.bcsc-research.org/work/acknowledgement.html. A list of the BCSC investigators and procedures for requesting BCSC data for research purposes are provided at http://breastscreening.cancer.gov/.
Received June 30, 2016; revision requested August 29; revision received October 19; accepted November 21; final version accepted December 8.
Supported by the National Cancer Institute (HHSN261201100031C, P01 CA154292, U54 CA163303).
See also the article by Lehman et al and the editorial by D’Orsi and Sickles in this issue.
Disclosures of Conflicts of Interest: B.L.S. disclosed no relevant relationships. R.A. disclosed no relevant relationships. D.L.M. disclosed no relevant relationships. L.M.H. disclosed no relevant relationships. D.S.M.B. disclosed no relevant relationships. T.O. disclosed no relevant relationships. G.H.R. disclosed no relevant relationships. J.M.L. Activities related to the present article: disclosed no relevant relationships. Activities not related to the present article: institution has a grant/grant pending from G.E. Healthcare. Other relationships: disclosed no relevant relationships. A.N.A.T. disclosed no relevant relationships. K.K. disclosed no relevant relationships. C.D.L. Activities related to the present article: disclosed no relevant relationships. Activities not related to the present article: has a grant from GE. Other relationships: disclosed no relevant relationships.
Abbreviations:
- BCSC
- Breast Cancer Surveillance Consortium
- BI-RADS
- Breast Imaging Reporting and Data System
- PPV
- positive predictive value
- PPV2
- PPV of a biopsy recommendation
- PPV3
- PPV of biopsies performed
References
- 1.American College of Radiology . ACR BI-RADS—mammography. In: ACR BI-RADS atlas: breast imaging reporting and data system. 5th ed. Reston, Va: American College of Radiology, 2013. [Google Scholar]
- 2.Monsees BS. The Mammography Quality Standards Act: an overview of the regulations and guidance. Radiol Clin North Am 2000;38(4):759–772. [DOI] [PubMed] [Google Scholar]
- 3.Sickles EA, Miglioretti DL, Ballard-Barbash R, et al. Performance benchmarks for diagnostic mammography. Radiology 2005;235(3):775–790. [DOI] [PubMed] [Google Scholar]
- 4.The Breast Cancer Surveillance Consortium . Performance benchmarks for diagnostic mammography. http://breastscreening.cancer.gov/statistics/benchmarks/diagnostic/. Updated 2007. Accessed September 8, 2016.
- 5.Carney PA, Parikh J, Sickles EA, et al. Diagnostic mammography: identifying minimally acceptable interpretive performance criteria. Radiology 2013;267(2):359–367. [DOI] [PMC free article] [PubMed] [Google Scholar]
- 6.Ballard-Barbash R, Taplin SH, Yankaskas BC, et al. Breast Cancer Surveillance Consortium: a national mammography screening and outcomes database. AJR Am J Roentgenol 1997;169(4):1001–1008. [DOI] [PubMed] [Google Scholar]
- 7.American College of Radiology . ACR BI-RADS—mammography. In: ACR breast imaging reporting and data system, breast imaging atlas. 4th ed. Reston, Va: American College of Radiology, 2003. [Google Scholar]
- 8.Tice JA, Miglioretti DL, Li CS, Vachon CM, Gard CC, Kerlikowske K. Breast density and benign breast disease: risk assessment to identify women at high risk of breast cancer. J Clin Oncol 2015;33(28):3137–3143. [DOI] [PMC free article] [PubMed] [Google Scholar]
- 9.Cox NJ. Speaking Stata: density probability plots. Stata J 2005;5(2):259–273. [Google Scholar]
- 10.U.S. Food and Drug Administration . MQSA national statistics. http://www.fda.gov/Radiation-EmittingProducts/MammographyQualityStandardsActandProgram/FacilityScorecard/ucm113858.htm. Accessed October 4, 2016.
- 11.Kerlikowske K, Hubbard RA, Miglioretti DL, et al. Comparative effectiveness of digital versus film-screen mammography in community practice in the United States: a cohort study. Ann Intern Med 2011;155(8):493–502. [DOI] [PMC free article] [PubMed] [Google Scholar]
- 12.Dee KE, Sickles EA. Medical audit of diagnostic mammography examinations: comparison with screening outcomes obtained concurrently. AJR Am J Roentgenol 2001;176(3):729–733. [DOI] [PubMed] [Google Scholar]
- 13.Aiello Bowles EJ, Miglioretti DL, Sickles EA, et al. Accuracy of short-interval follow-up mammograms by patient and radiologist characteristics. AJR Am J Roentgenol 2008;190(5):1200–1208. [DOI] [PMC free article] [PubMed] [Google Scholar]
- 14.Jensen A, Geller BM, Gard CC, et al. Performance of diagnostic mammography differs in the United States and Denmark. Int J Cancer 2010;127(8):1905–1912. [DOI] [PMC free article] [PubMed] [Google Scholar]
- 15.Hofvind S, Geller BM, Skelly J, Vacek PM. Sensitivity and specificity of mammographic screening as practised in Vermont and Norway. Br J Radiol 2012;85(1020):e1226–e1232. [DOI] [PMC free article] [PubMed] [Google Scholar]
- 16.Kemp Jacobsen K, O’Meara ES, Key D, et al. Comparing sensitivity and specificity of screening mammography in the United States and Denmark. Int J Cancer 2015;137(9):2198–2207. [DOI] [PMC free article] [PubMed] [Google Scholar]
- 17.Smith-Bindman R, Ballard-Barbash R, Miglioretti DL, Patnick J, Kerlikowske K. Comparing the performance of mammography screening in the USA and the UK. J Med Screen 2005;12(1):50–54. [DOI] [PubMed] [Google Scholar]
- 18.Lee CI, Lehman CD. Digital breast tomosynthesis and the challenges of implementing an emerging breast cancer screening technology into clinical practice. J Am Coll Radiol 2013;10(12):913–917. [DOI] [PubMed] [Google Scholar]
Associated Data
This section collects any data citations, data availability statements, or supplementary materials included in this article.