The majority of radiologists in U.S. community practice surpass most performance recommendations of the American College of Radiology; however, abnormal interpretation rates continue to be higher than the recommended rate for almost half of radiologists interpreting screening mammograms.
Abstract
Purpose
To establish performance benchmarks for modern screening digital mammography and assess performance trends over time in U.S. community practice.
Materials and Methods
This HIPAA-compliant, institutional review board–approved study measured the performance of digital screening mammography interpreted by 359 radiologists across 95 facilities in six Breast Cancer Surveillance Consortium (BCSC) registries. The study included 1 682 504 digital screening mammograms performed between 2007 and 2013 in 792 808 women. Performance measures were calculated according to the American College of Radiology Breast Imaging Reporting and Data System, 5th edition, and were compared with published benchmarks by the BCSC, the National Mammography Database, and performance recommendations by expert opinion. Benchmarks were derived from the distribution of performance metrics across radiologists and were presented as 50th (median), 10th, 25th, 75th, and 90th percentiles, with graphic presentations using smoothed curves.
Results
Mean screening performance measures were as follows: abnormal interpretation rate (AIR), 11.6 (95% confidence interval [CI]: 11.5, 11.6); cancers detected per 1000 screens, or cancer detection rate (CDR), 5.1 (95% CI: 5.0, 5.2); sensitivity, 86.9% (95% CI: 86.3%, 87.6%); specificity, 88.9% (95% CI: 88.8%, 88.9%); false-negative rate per 1000 screens, 0.8 (95% CI: 0.7, 0.8); positive predictive value (PPV) 1, 4.4% (95% CI: 4.3%, 4.5%); PPV2, 25.6% (95% CI: 25.1%, 26.1%); PPV3, 28.6% (95% CI: 28.0%, 29.3%); cancers stage 0 or 1, 76.9%; minimal cancers, 57.7%; and node-negative invasive cancers, 79.4%. Recommended CDRs were achieved by 92.1% of radiologists in community practice, and 97.1% achieved recommended ranges for sensitivity. Only 59.0% of radiologists achieved recommended AIRs, and only 63.0% achieved recommended levels of specificity.
Conclusion
The majority of radiologists in the BCSC surpass cancer detection recommendations for screening mammography; however, AIRs continue to be higher than the recommended rate for almost half of radiologists interpreting screening mammograms.
© RSNA, 2016
Introduction
More than 50 years ago, Wolfe (1) reported results in 3891 women undergoing screening mammography and emphasized the importance of identifying small, clinically occult, node-negative breast cancers to afford women both the best options for treatment and the best chance for cure. Subsequent randomized clinical trials confirmed that screening mammography significantly reduces breast cancer mortality (2–9).
Despite its limitations, mammography continues to be the single most effective screening test to reduce breast cancer mortality and the only screening test for breast cancer supported by the United States Preventive Services Task Force and the American Cancer Society (10,11). To improve the quality of mammography, in the 1980s, the American College of Radiology (ACR) developed the Breast Imaging Reporting and Data System (BI-RADS) (12) and established a voluntary accreditation program that supported passage of the Mammography Quality Standards Act by Congress in 1992.
Although randomized trials performed in the 1960s and 1970s with now-outdated mammography technology have confirmed that mammographic screening reduces breast cancer mortality, randomized trials with mortality as an end point are not feasible to continue to assess either the effectiveness of new technology or factors associated with improved interpretive skills of radiologists reading screening mammograms. The Breast Cancer Surveillance Consortium (BCSC) is uniquely positioned to assess trends over the past 2 decades in screening mammography performance in U.S. community practice. A decade ago, the BCSC published performance benchmarks for screening mammography in U.S. community practice (13). These metrics informed the ACR BI-RADS to establish performance benchmarks for U.S. practice and also identified opportunities for improvements in future practice.
Two key changes have occurred to improve screening mammography performance in community practice. The first is transition from screen-film mammography to full-field digital mammography, and the second is expansion of training programs to enhance the interpretive skills of radiologists engaged in screening mammography programs. The purpose of our study was to establish performance benchmarks for modern screening digital mammography and to assess performance trends over time in U.S. community practice.
Materials and Methods
Data Source
This study included six BCSC mammography registries (Carolina Mammography Registry, Group Health Cooperative, New Hampshire Mammography Network, Vermont Breast Cancer Surveillance System, San Francisco Mammography Registry, and Metropolitan Chicago Breast Cancer Registry) that have previously been described in detail (14,15). In brief, each registry links its mammography data to a state tumor or Surveillance, Epidemiology, and End Results (SEER) registry, and data are pooled at a central Statistical Coordinating Center. Prior reports of BCSC registries and the Statistical Coordinating Center are available at http://www.bcsc-research.org/publications/index.html.
Study Population
Our study included women 18 years of age or older who underwent at least one digital screening mammography examination (hereafter called “mammogram”) between 2007 and 2013. To measure performance trends over time, we also included previously reported data from the BCSC between the years 1996 and 2008 (16). Examinations occurring within 9 months of a prior mammogram or breast ultrasonographic (US) examination were excluded to remove potential diagnostic mammograms. We also excluded women with breast augmentation, because we were unable to distinguish implant displacement views from diagnostic views obtained the same day.
Mammographic Data Collection Procedures and Definitions
Across all BCSC registries, women complete a questionnaire at each visit that includes questions about their personal history of breast cancer, family history of breast cancer, date of last mammogram, menopausal status, and self-reported symptoms. We calculated the BCSC version 1 5-year risk score, which estimates the probability of invasive breast cancer within the next 5 years on the basis of age, race, ethnicity, family history, history of breast biopsy, and breast density (17).
All BCSC registries capture BI-RADS assessment and recommendation categories assigned by the interpreting radiologist for each mammogram. For the purposes of this study, we created an initial overall assessment for the screening examination, using the most serious BI-RADS assessment according to the following hierarchy: negative, 1; benign, 2; probably benign, 3; needs additional evaluation, 0; suspicious, 4; and highly suggestive of malignancy, 5. We followed ACR BI-RADS 5th edition definitions for all metrics (12). For all measures except positive predictive value (PPV) 2 and PPV3, a positive mammogram was defined as one with initial assessment categories 0, 3, 4, or 5. For PPV2 and PPV3, a positive mammogram was defined as one with final assessment categories 4 or 5. As per BI-RADS audit rules, any mammogram with a BI-RADS 6 assessment (known breast cancer) was excluded from analyses.
Women were considered to have breast cancer if a state tumor or SEER registry or pathology database indicated the diagnosis of invasive breast carcinoma or ductal carcinoma in situ (DCIS) within 12 months after a screening mammogram and before the next screening mammogram.
Outcome Measurements and Statistical Analysis
Following ACR BI-RADS 5th edition definitions, a true-positive (TP) mammogram was a positive mammogram followed by the diagnosis of breast cancer within 12 months. A true-negative (TN) mammogram was a negative mammogram followed by no diagnosis of breast cancer within 12 months. A false-positive (FP) mammogram was a mammogram interpreted as positive with no breast cancer diagnosed within 12 months. A false-negative (FN) mammogram was a negative mammogram followed by a diagnosis of breast cancer within 12 months. Cancer detection rate (CDR) was defined as the number of TP examinations divided by the total number of screening mammograms. FN rate (FNR) was defined as the number of FN examinations divided by the total number of screening mammograms. Sensitivity was calculated by dividing the number of TP examinations by the total number of examinations associated with cancer (TP + FN), and specificity was calculated by dividing the number of TN examinations by the total number of examinations without cancer (TN + FP).
The following three PPV calculations were made by using BI-RADS methodology: PPV1 (probability of cancer following initial assessment of 0, 3, 4, or 5), PPV2 (probability of cancer following a final assessment of 4 or 5), and PPV3 (probability of cancer among patients with biopsy performed after final assessment of 4 or 5). For screens with an initial BI-RADS assessment of 0, the final assessment was determined from additional imaging records up to 180 days after the screening examination.
Statistical Analysis
Descriptive statistics (frequencies, percentiles, means, and medians) were chosen to provide clinically relevant screening performance benchmarks. We illustrate the variability across radiologists using percentile values to indicate ranges that describe the middle 50% and 80%. For example, the spectrum from 25th to 75th percentile values defines the range within which the middle 50% of performance was found, and the spectrum from 10th to 90th percentile values defines the range within which the middle 80% of performance was found.
To reduce the amount of random statistical variation in these data, we reported outcomes from radiologists who contributed a minimum number of events for each outcome, as follows: 1000 examinations for abnormal interpretation (recall) rate and CDR, 3000 examinations for FNR, 100 abnormal interpretations for PPV1, 30 biopsies recommended for PPV2, 30 biopsies performed for PPV3, 30 cancer cases for sensitivity, 1000 noncancers for specificity, and 15 cancers with complete information on the outcome criteria for cancer measurements. We used graphic presentations (frequency distributions overlaid with percentile values) to display these data in an easily understandable format. All analyses were performed by using SAS software, version 9.3 (SAS Institute, Chicago, Ill), and all figures were produced by using STATA, version 12.1 (Stata, College Station, Tex).
Results
From 2007 to 2013, 359 radiologists from 95 facilities across six registries contributed 1 682 504 digital screening mammograms in 792 808 women. The demographics of the study population are comparable to those of the U.S. population (Table E1 [online]), although the study population includes slightly more rural and more educated women, more Asian women, and fewer Latina women. There were no important differences in African American representation or in economic status.
The mean age of women undergoing screening mammography was 56.5 years. The majority (80.4%) of screening mammograms were performed in women aged 40–69 years; 29.3% of all screening mammograms were performed in women younger than 50 years of age, and 60.9% were performed in women aged 50–74 years. In women given a diagnosis of breast cancer, the majority (76.0%) had no family history of breast cancer, 85.0% had no personal history of breast cancer, and 84.9% had a BCSC 5-year risk of less than 2.5%. Breast density distributions did not differ in women with a breast cancer diagnosis versus in women without a breast cancer diagnosis (Table 1).
Table 1.
Clinical Demographics for 1 682 504 Screening Mammographic Examinations
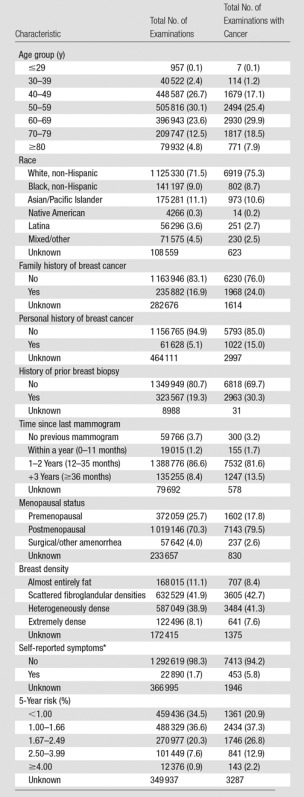
Note.—Data in parentheses are percentages.
*Symptoms include nipple discharge, lump, not otherwise specified, and other (not including pain).
Mammographic Performance Measures
The mean abnormal interpretation rate (AIR) was 11.6% (95% confidence interval [CI]: 11.5, 11.6). Of 1 682 504 examinations, 8529 breast cancers were diagnosed after a positive mammogram, for a total CDR of 5.1 (95% CI: 5.0, 5.2) per 1000 screening examinations. The invasive CDR was 3.5 cancers per 1000 examinations, and the DCIS detection rate was 1.6 cancers per 1000 examinations. The sensitivity of screening mammography was 86.9% (95% CI: 86.3%, 87.6%), and the specificity was 88.9% (95% CI: 88.8%, 88.9%). There were 1283 FN examinations out of 1 682 504 examinations, for an FNR of 0.8 examinations per 1000 (95% CI: 0.7, 0.8). Out of 194 668 examinations with an initial BI-RADS category of 0, 3, 4, or 5, 8529 cancers were diagnosed, for a PPV1 of 4.4 (95% CI: 4.3, 4.5). Out of 28 785 examinations with a final BI-RADS category of 4 or 5, 7376 cancers were diagnosed, for a PPV2 of 25.6 (95% CI: 25.1, 26.1). The PPV3 calculated (5945 cancers out of 20 763 examinations with final BI-RADS category 4 or 5 with biopsy) was 28.6 (95% CI: 28.0, 29.3) (Tables 2, 3).
Table 2.
Performance Measures for 1 682 504 Screening Digital Mammography Examinations
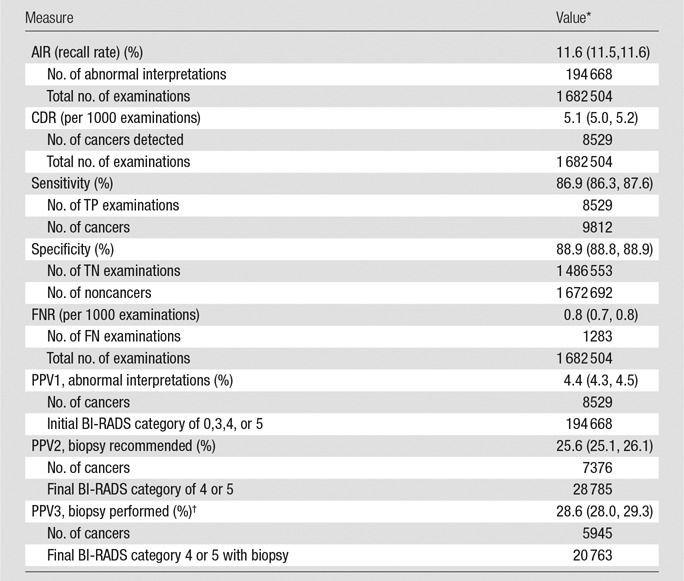
*Data in parentheses are 95% CIs, which were based on Wald asymptotic confidence limits.
†Excludes Chicago.
Table 3.
Performance Measures for 1 682 504 Screening Digital Mammography Examinations from 2007 to 2013
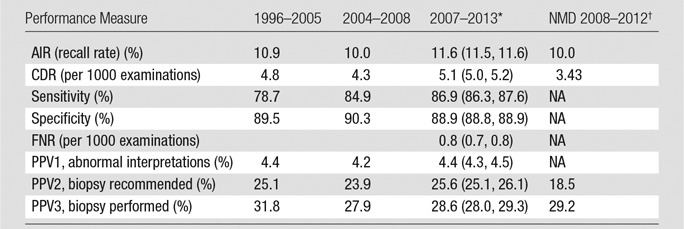
*Data in parentheses are 95% CIs, which were based on Wald asymptotic confidence limits.
†NMD = National Mammography Database, NA = not applicable.
Cancers Detected with Digital Screening Mammography
Of the 8529 cancers detected with mammography, 2644 (31%) were DCIS and 5885 (69%) were invasive. Of the invasive cancers, 38.3% were 10 mm or smaller, 40.2% were between 11 and 20 mm, and 21.5% were larger than 20 mm at time of diagnosis. The majority (76.9%) of all cancers were diagnosed at stage 0 or 1, and 4816 (57.7%) were minimal cancers (defined as DCIS or invasive cancers ≤ 10 mm). Of 5789 cancers with known nodal status, 4599 (79.4%) were node negative. Fifty-two (0.6%) of 8354 cancers were metastatic at the time of diagnosis (Tables 3, 4).
Table 4.
Characteristics of Cancers Detected with Digital Screening Mammographic Examinations
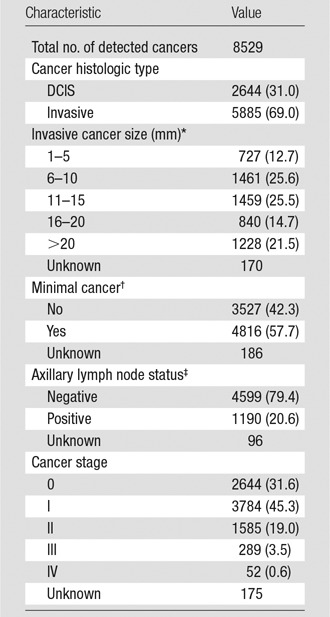
Note.—Data in parentheses are percentages.
*Mean = 15.9 mm and median = 13.0 mm among known invasive cancer sizes.
†Defined as DCIS or invasive cancers ≤ 10 mm.
‡Refers to invasive cancers only.
Radiologists Performing within Acceptable Ranges
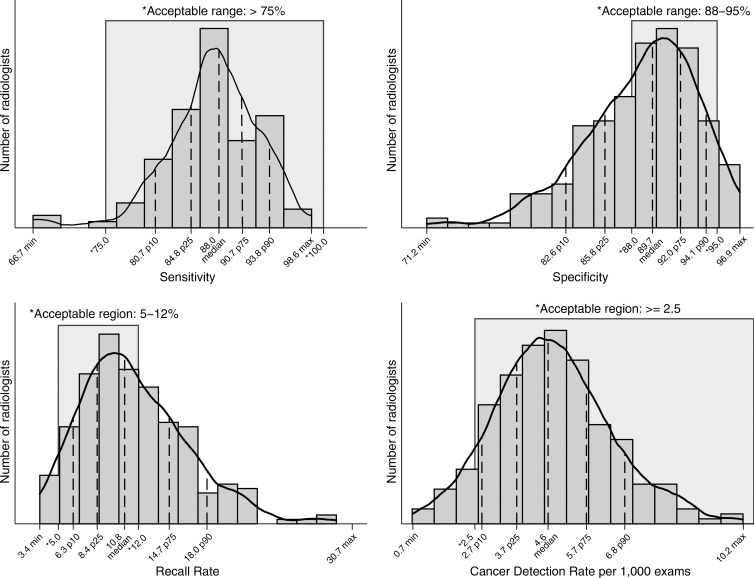
Overall, radiologists performed better for measures of cancer detection and sensitivity and worse for measures of recall rates and specificity (Fig 1). The range of sensitivities of the middle 50% of all radiologists was 84.8%–90.7%, with 97.1% of radiologists performing in the acceptable range of greater than 75% sensitivity. More than 92% of radiologists achieved the recommended acceptable range of greater than 2.5 cancers detected per 1000 examinations, with 50% of radiologists performing within the range of 3.7–5.7 cancers detected per 1000 examinations. The range of recall, or abnormal interpretation, rates of the middle 50% of all radiologists was 8.4–14.7, with only 59.0% of radiologists performing within the recommended acceptable range of 5%–12%. For specificity, 50% of radiologists performed within the range of 85.8%–92.0% and only 63.0% met the acceptable range of 88%–95% specificity.
Figure 1:
Graphs show common performance measures. Sensitivity was restricted to final readers with 30 or more cancers (n = 104). Specificity was restricted to final readers with 1000 or more noncancers (n = 249). CDR was restricted to final readers with 1000 or more examinations (n = 242). Recall rate was restricted to final readers with 1000 or more examinations (n = 242). Max = maximum, min = minimum, p10 = 10th percentile, p25 = 25th percentile, p75 = 75th percentile, p90 = 90th percentile.
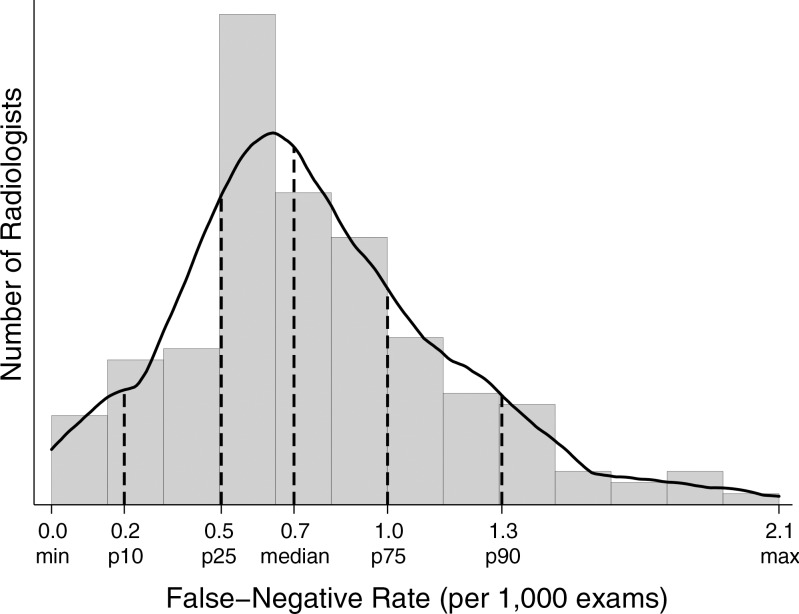
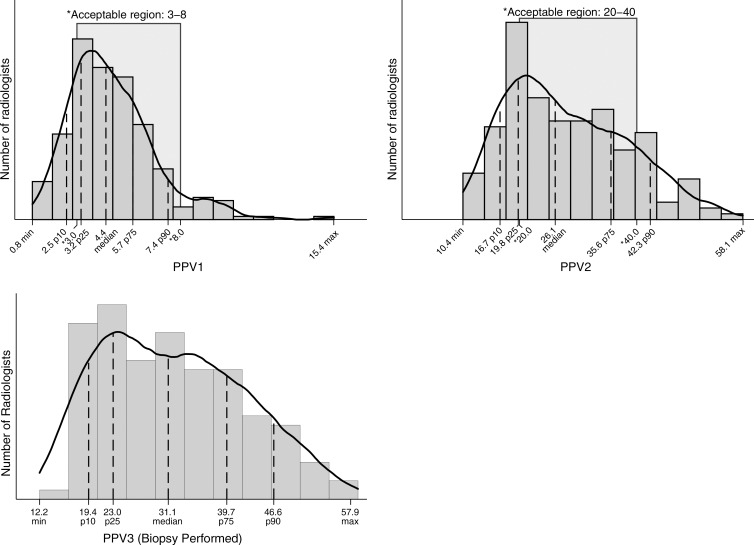
For 194 radiologists contributing 3000 or more examinations, 50% had FNRs between 0.5 and 1.0 per 1000 examinations (Fig 2). A large percentage (62%) of radiologists did not meet the recommended range of 20%–40% PPV2 (cancers diagnosed in all examinations assessed as BI-RADS category 4 or 5). Roughly one in four radiologists had a PPV2 of less than 20% (Fig 3). The range of PPV3 values for half of all radiologists was 23.0–39.0. Twenty-five percent of radiologists performed below this range and 25% performed higher than this range.
Figure 2:
Graph shows FNR, which was restricted to final readers with 3000 or more examinations (n = 194). Max = maximum, min = minimum, p10 = 10th percentile, p25 = 25th percentile, p75 = 75th percentile, p90 = 90th percentile.
Figure 3:
Graph shows PPVs. PPV1 was restricted to final readers with 100 or more abnormal examinations (n = 255). PPV2 was restricted to final readers with 30 or more recommended biopsies (n = 172). PPV3 was restricted to final readers with 30 or more biopsies performed (n = 125). Max = maximum, min = minimum, p10 = 10th percentile, p25 = 25th percentile, p75 = 75th percentile, p90 = 90th percentile.
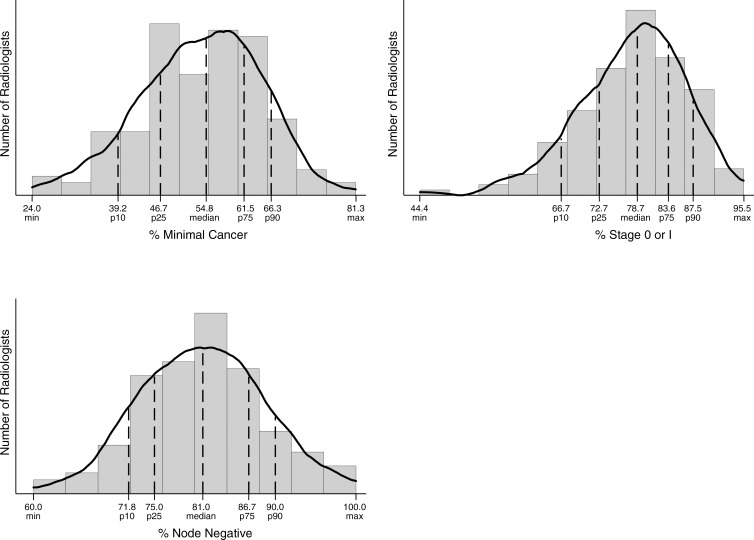
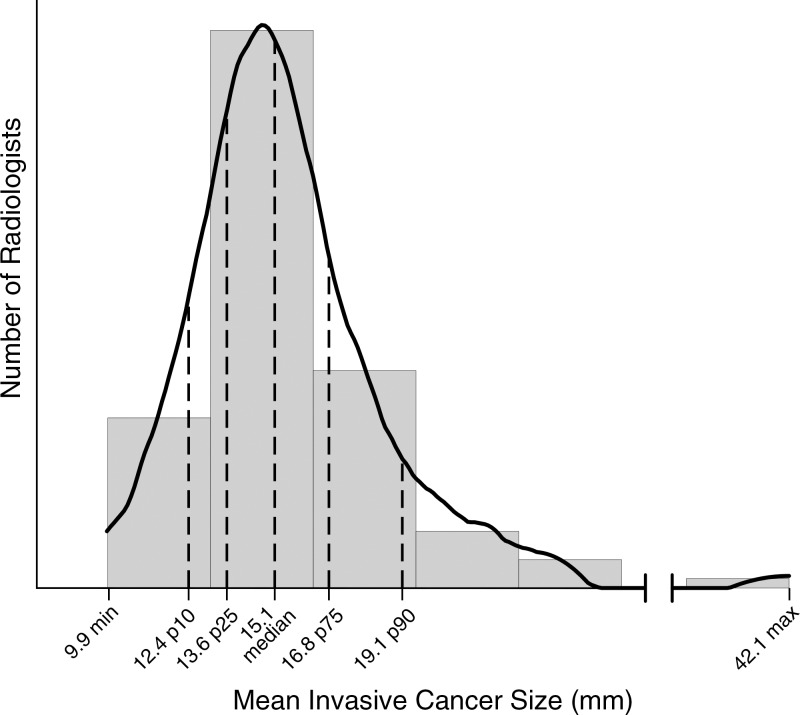
For radiologists who detected 15 or more cancers, 50% identified between 73% and 84% of cancers at stage 0 or 1. In addition, 50% of radiologists diagnosed between 75% and 87% of cancers while they were node negative (Fig 4). For the 111 radiologists who diagnosed at least 15 invasive cancers in the study period, 50% identified invasive cancers in the range of 13.6–16.8 mm (Fig 5).
Figure 4:
Graphs show cancer characteristics. Percentage minimal cancer was restricted to final readers with 15 or more detected cancers (n = 140) of known size. Percentage of cancers that were node negative was restricted to final readers with 15 or more detected invasive cancers (n = 111) of known size. Percentage of cancers that were stage 0 or 1 was restricted to final readers with 15 or more detected cancers (n = 143) of known stage. Max = maximum, min = minimum, p10 = 10th percentile, p25 = 25th percentile, p75 = 75th percentile, p90 = 90th percentile.
Figure 5:
Graph shows results for mean invasive cancer size. Mean size was restricted to final readers with 15 or more detected invasive cancers (n = 111) of known size. Max = maximum, min = minimum, p10 = 10th percentile, p25 = 25th percentile, p75 = 75th percentile, p90 = 90th percentile.
Discussion
National performance benchmarks for screening mammography were published previously by the BCSC in 2006 and were subsequently updated in 2008, on the basis of examinations performed from 1996 to 2005 and from 2004 to 2008, respectively (17). Our study provides more recent estimates of modern digital screening mammography performance in the United States on the basis of examinations performed from 2007 to 2013. We restricted our study to digital mammography to provide performance measures most relevant for current clinical practice. Among the overall statistics and variation across radiologists provided in our study, a few key findings stand out.
First, the sensitivity for modern digital screening mammography in the BCSC is higher than prior BCSC reports from the pre-digital era (86.9% vs 78.7%). This likely reflects the improved performance of digital mammography compared with screen-film mammography in women with dense breast tissue (18,19), which includes almost half of women undergoing screening mammography. In particular, more cases of DCIS are diagnosed with modern screening mammography than in the prior BCSC reports (21% of cancers diagnosed in 2004–2008 BCSC examinations were DCIS, compared with 31% of cancers diagnosed in our current study) (13). The rate of invasive cancers per 1000 examinations in our study was 3.5 invasive cancers detected per 1000 women screened, compared with the prior 1996–2005 BCSC report of 3.7 invasive cancers detected per 1000 women screened. Details of cancers detected are not available from the NMD, precluding comparison.
Second, the CDR of 5.1 cancers per 1000 examinations in our study is significantly higher than that reported by the NMD (3.43 per 1000 [95% CI: 3.2, 3.7]). This may in part be explained by the improved ability of the BCSC to collect pathology data from multiple sources, including state tumor registries, compared with the NMD, which relies on data collected by radiology facilities alone. The total rate of all cancers (those detected and those not detected with mammography) was 5.9 per 1000 (95% CI: 5.7, 6.0). The total rate of cancers is not available from the NMD, precluding comparison.
Last, the mean AIR in our study of 11.6% was higher than those in the 2005 and 2008 BCSC reports (10.9% and 10.0%, respectively) and higher than the 10.0% rate reported by the NMD (14,20). This is particularly concerning, given that recall rates have continually failed to meet the recommendations of the ACR and other expert panels going back to the initial BCSC report in 2005, despite calls for attention to this matter (13). Increasing access to tomosynthesis imaging for screening could yield improvements in recall rates, with current data suggesting that tomosynthesis can reduce recalls by 15%–20% (21–24)—down from initial estimates of 30%–40% (25,26). However, extreme variation across facilities and individuals threatens this gain. For instance, four of the 13 sites in the largest U.S. multicenter report had recall rates for mammograms performed with tomosynthesis that were well above the recommended rates for digital mammography alone (23). Adequate education and training of new users must be matched with ongoing quality assurance efforts if tomosynthesis is to achieve its full benefits in community clinical practice.
A notable limitation of our study was that, despite the large sample size, not all radiologists contributed sufficient interpretations to be included in all performance measures. Given the low rates of cancers in average-risk screening populations combined with the relatively low numbers of mammograms required for credentialing in the United States, accurate estimates of sensitivity necessarily exclude many radiologists in practice. Hence, radiologists with lower numbers of mammograms may not achieve the same high sensitivities we found in the 104 of 359 radiologists who contributed at least 1000 screening mammogram interpretations during the study period. Individual radiologists and breast imaging facilities can nonetheless use our results to gauge their performance against this national cohort.
In summary, we found that the majority of radiologists in U.S. community practice surpass most performance recommendations of the ACR; however, AIRs continue to be higher than the recommended rate for almost half of radiologists interpreting screening mammograms. Programs to support second reviews of mammograms recalled by radiologists known to “overcall” mammograms could be implemented. The second reviews of the recalls could be performed by radiologists with documented high performance for both recall and CDRs. The resource investment would be manageable for most practices, as it would require second reads of roughly only 11%–20% of mammograms read by the radiologists with poor specificity, rather than second reads of all mammograms. The latter approach (second reads of all mammograms) would be required for radiologists who performed below benchmarks for CDRs. In our study, we found this was a relatively uncommon scenario.
Mammography screening programs stand out as unique in imaging because they are required by law to perform practice audits. However, currently there are no requirements for additional training or practice restrictions for radiologists performing below minimal performance standards. Carney et al (27) have shown the potential positive impacts on our patients and health care expenditures if all radiologists were to meet minimally acceptable standards of performance. Yet achieving this end will likely require remedial or restrictive action to be taken regarding subpar performers. Whether we are ready to take this next step in quality assurance and cost containment in screening mammography warrants careful consideration.
Advances in Knowledge
■ Mean performance measures for modern digital screening mammography in the Breast Cancer Surveillance Consortium (BCSC) were as follows: abnormal interpretation rate (AIR), 11.6 (95% confidence interval [CI]: 11.5, 11.6); cancers detected per 1000 screens, 5.1 (95% CI: 5.0, 5.2); sensitivity, 86.9% (95% CI: 86.3%, 87.6%); specificity, 88.9% (95% CI: 88.8%, 88.9%); false-negative rate per 1000 screens, 0.8 (95% CI: 0.7, 0.8); positive predictive value (PPV) 1, 4.4% (95% CI: 4.3%, 4.5%); PPV2, 25.6% (95% CI: 25.1%, 26.1%); PPV3, 28.6% (95% CI: 28.0%, 29.3%).
■ Compared with prior performance reports of screening mammography in the BCSC (1996–2008), the sensitivity of screening mammography has increased from 78.7% to 86.9%.
■ More than 92% of radiologists in community practice achieve recommended rates of cancers detected per 1000 women screened, and more than 97% achieve recommended ranges for sensitivity.
■ More than 40% of radiologists have AIRs outside the recommended ranges, and more than 37% fall below recommended ranges for specificity.
Implication for Patient Care
■ Efforts to develop and implement advanced technology and effective educational programs to reduce false-positive rates without sacrificing improved detection of invasive node-negative cancers are encouraged.
SUPPLEMENTAL TABLE
Acknowledgments
Acknowledgments
We thank the BCSC investigators, participating women, mammography facilities, and radiologists for the data they have provided for this study. A list of the BCSC investigators and procedures for requesting BCSC data for research purposes is provided at http://breastscreening.cancer.gov/.
Received May 20, 2016; revision requested July 25; revision received August 19; final version accepted August 29.
Supported by a National Cancer Institute–funded Program Project (P01CA154292). Breast Cancer Surveillance Consortium data collection was also supported by HHSN261201100031C. Vermont Breast Cancer Surveillance System data collection was also supported by U54CA163303. Collection of cancer and vital status data used in this study was supported in part by several state public health departments and cancer registries throughout the United States. For a full description of these sources, please see http://breastscreening.cancer.gov/work/acknowledgement.html. The content is solely the responsibility of the authors and does not necessarily represent the official views of the National Cancer Institute or the National Institutes of Health.
See also the article by Sprague et al and the editorial by D’Orsi and Sickles in this issue.
Disclosures of Conflicts of Interest: C.D.L. disclosed no relevant relationships. R.F.A. disclosed no relevant relationships. B.L.S. disclosed no relevant relationships. J.M.L. Activities related to the present article: none to disclose. Activities not related to the present article: institution has received grants from GE for the STAR Study. Other relationships: none to disclose. D.S.M.B. disclosed no relevant relationships. K.K. disclosed no relevant relationships. L.M.H. disclosed no relevant relationships. T.O. disclosed no relevant relationships. A.N.A.T. disclosed no relevant relationships. G.H.R. disclosed no relevant relationships. D.L.M. disclosed no relevant relationships.
Abbreviations:
- ACR
- American College of Radiology
- AIR
- abnormal interpretation rate
- BCSC
- Breast Cancer Surveillance Consortium
- BI-RADS
- Breast Imaging Reporting and Data System
- CDR
- cancer detection rate
- CI
- confidence interval
- DCIS
- ductal carcinoma in situ
- FN
- false-negative
- FNR
- FN rate
- FP
- false-positive
- NMD
- National Mammography Database
- PPV
- positive predictive value
- SEER
- Surveillance, Epidemiology, and End Results
- TN
- true-negative
- TP
- true-positive
References
- 1.Wolfe JN. Mammography as a screening examination in breast cancer. Radiology 1965;84:703–708. [DOI] [PubMed] [Google Scholar]
- 2.Independent UK Panel on Breast Cancer Screening . The benefits and harms of breast cancer screening: an independent review. Lancet 2012;380(9855):1778–1786. [DOI] [PubMed] [Google Scholar]
- 3.Shapiro S, Venet W, Strax P, Venet L, Roeser R. Ten- to fourteen-year effect of screening on breast cancer mortality. J Natl Cancer Inst 1982;69(2):349–355. [PubMed] [Google Scholar]
- 4.Andersson I, Janzon L, Sigfússon BF. Mammographic breast cancer screening: a randomized trial in Malmö, Sweden. Maturitas 1985;7(1):21–29. [DOI] [PubMed] [Google Scholar]
- 5.Tabár L, Fagerberg CJ, Gad A, et al. Reduction in mortality from breast cancer after mass screening with mammography: randomised trial from the Breast Cancer Screening Working Group of the Swedish National Board of Health and Welfare. Lancet 1985;1(8433):829–832. [DOI] [PubMed] [Google Scholar]
- 6.Roberts MM, Alexander FE, Anderson TJ, et al. The Edinburgh randomised trial of screening for breast cancer: description of method. Br J Cancer 1984;50(1):1–6. [DOI] [PMC free article] [PubMed] [Google Scholar]
- 7.Frisell J, Glas U, Hellström L, Somell A. Randomized mammographic screening for breast cancer in Stockholm: design, first round results and comparisons. Breast Cancer Res Treat 1986;8(1):45–54. [DOI] [PubMed] [Google Scholar]
- 8.Miller AB, Howe GR, Wall C. The National Study of Breast Cancer Screening Protocol for a Canadian randomized controlled trial of screening for breast cancer in women. Clin Invest Med 1981;4(3-4):227–258. [PubMed] [Google Scholar]
- 9.Bjurstam N, Björneld L, Duffy SW, et al. The Gothenburg breast screening trial: first results on mortality, incidence, and mode of detection for women ages 39-49 years at randomization. Cancer 1997;80(11):2091–2099. [PubMed] [Google Scholar]
- 10.Oeffinger KC, Fontham ET, Etzioni R, et al. Breast cancer screening for women at average risk: 2015 guideline update from the American Cancer Society. JAMA 2015;314(15):1599–1614. [DOI] [PMC free article] [PubMed] [Google Scholar]
- 11.DeAngelis CD, Fontanarosa PB. US Preventive Services Task Force and breast cancer screening. JAMA 2010;303(2):172–173. [DOI] [PubMed] [Google Scholar]
- 12.American College of Radiology . American College of Radiology Breast Imaging Reporting and Data System Atlas (BI-RADS Atlas). Reston, Va: American College of Radiology, 2013. [Google Scholar]
- 13.Rosenberg RD, Yankaskas BC, Abraham LA, et al. Performance benchmarks for screening mammography. Radiology 2006;241(1):55–66. [DOI] [PubMed] [Google Scholar]
- 14.National Cancer Institute DoCCPS, Healthcare Delivery Research Program . Breast Cancer Surveillance Consortium. Updated July 6, 2015. Accessed March 4, 2016.
- 15.Ballard-Barbash R, Taplin SH, Yankaskas BC, et al. Breast Cancer Surveillance Consortium: a national mammography screening and outcomes database. AJR Am J Roentgenol 1997;169(4):1001–1008. [DOI] [PubMed] [Google Scholar]
- 16.National Cancer Institute Breast Cancer Surveillance Consortium . Performance Benchmarks for Screening Mammography (HHSN261201100031C). http://breastscreening.cancer.gov/statistics/benchmarks/screening/. Updated May 20, 2015. Accessed May 8, 2016.
- 17.Tice JA, Cummings SR, Smith-Bindman R, Ichikawa L, Barlow WE, Kerlikowske K. Using clinical factors and mammographic breast density to estimate breast cancer risk: development and validation of a new predictive model. Ann Intern Med 2008;148(5):337–347. [DOI] [PMC free article] [PubMed] [Google Scholar]
- 18.Kerlikowske K, Hubbard RA, Miglioretti DL, et al. Comparative effectiveness of digital versus film-screen mammography in community practice in the United States: a cohort study. Ann Intern Med 2011;155(8):493–502. [DOI] [PMC free article] [PubMed] [Google Scholar]
- 19.Pisano ED, Gatsonis C, Hendrick E, et al. Diagnostic performance of digital versus film mammography for breast-cancer screening. N Engl J Med 2005;353(17):1773–1783. [DOI] [PubMed] [Google Scholar]
- 20.Lee CS, Bhargavan-Chatfield M, Burnside ES, Nagy P, Sickles EA. The National Mammography Database: preliminary data. AJR Am J Roentgenol 2016;206(4):883–890. [DOI] [PubMed] [Google Scholar]
- 21.Skaane P, Bandos AI, Gullien R, et al. Comparison of digital mammography alone and digital mammography plus tomosynthesis in a population-based screening program. Radiology 2013;267(1):47–56. [DOI] [PubMed] [Google Scholar]
- 22.Ciatto S, Houssami N, Bernardi D, et al. Integration of 3D digital mammography with tomosynthesis for population breast-cancer screening (STORM): a prospective comparison study. Lancet Oncol 2013;14(7):583–589. [DOI] [PubMed] [Google Scholar]
- 23.Friedewald SM, Rafferty EA, Rose SL, et al. Breast cancer screening using tomosynthesis in combination with digital mammography. JAMA 2014;311(24):2499–2507. [DOI] [PubMed] [Google Scholar]
- 24.McCarthy AM, Kontos D, Synnestvedt M, et al. Screening outcomes following implementation of digital breast tomosynthesis in a general-population screening program. J Natl Cancer Inst 2014;106(11):dju316. [DOI] [PMC free article] [PubMed] [Google Scholar]
- 25.Rafferty EA, Park JM, Philpotts LE, et al. Assessing radiologist performance using combined digital mammography and breast tomosynthesis compared with digital mammography alone: results of a multicenter, multireader trial. Radiology 2013;266(1):104–113. [DOI] [PMC free article] [PubMed] [Google Scholar]
- 26.Gur D, Abrams GS, Chough DM, et al. Digital breast tomosynthesis: observer performance study. AJR Am J Roentgenol 2009;193(2):586–591. [DOI] [PubMed] [Google Scholar]
- 27.Carney PA, Sickles EA, Monsees BS, et al. Identifying minimally acceptable interpretive performance criteria for screening mammography. Radiology 2010;255(2):354–361. [DOI] [PMC free article] [PubMed] [Google Scholar]
Associated Data
This section collects any data citations, data availability statements, or supplementary materials included in this article.


