

Abstract
TET proteins oxidize 5-methylcytosine in DNA to 5-hydroxymethylcytosine and other oxidation products. We found that simultaneous deletion of Tet2 and Tet3 in mouse CD4+CD8+ double-positive thymocytes resulted in dysregulated development and proliferation of invariant natural killer T cells (iNKT cells). Tet2-Tet3 double-knockout (DKO) iNKT cells displayed pronounced skewing toward the NKT17 lineage, with increased DNA methylation and impaired expression of genes encoding the key lineage-specifying factors T-bet and ThPOK. Transfer of purified Tet2-Tet3 DKO iNKT cells into immunocompetent recipient mice resulted in an uncontrolled expansion that was dependent on the nonclassical major histocompatibility complex (MHC) protein CD1d, which presents lipid antigens to iNKT cells. Our data indicate that TET proteins regulate iNKT cell fate by ensuring their proper development and maturation and by suppressing aberrant proliferation mediated by the T cell antigen receptor (TCR).
T cell development is tightly regulated by transcription factors that dictate lineage commitment1,2. The DNA-binding transcription factors Foxp3, Runx3, ThPOK and PLZF orchestrate the cell-specific transcriptional programs of regulatory T cells (Treg cells), CD8+ single-positive (CD8SP) T cells, CD4+ single-positive (CD4SP) T cells and iNKT cells, respectively2,3. Transcription factors also control the further differentiation of peripheral naive CD4+ T cells into the TH1 subset of helper T cells that expresses the transcription factor T-bet, TH2 cells that express the transcription factor GATA-3 and TH17 cells that express the transcription factor RORγt4.
Whereas conventional T cells are selected by peptide antigens presented on MHC class I and II proteins, iNKT cells are positively selected in the thymus through recognition of lipid antigens presented by the nonclassical MHC-class-I-like protein CD1d3, and their differentiation is induced by strong TCR signaling through agonist selection5. iNKT cells are defined by their ability to bind CD1d–α-galactosyl-ceramide tetramers (called simply ‘tetramers’ here) and are subdivided into four stages on the basis of their expression of surface markers: stage 0 iNKT precursors have high expression of the B cell–differentiation marker CD24; stage 1 cells have undergone positive selection and massive proliferation and downregulate CD24 expression; stage 2 cells continue proliferating and upregulate expression of the activation and memory marker CD44, but do not express the activating NK cell receptor NK1.1; and stage 3 cells are CD44+NK1.1+ (ref. 3).
An alternative transcription-factor-centered classification categorizes iNKT cells that express T-bet and secrete interferon-γ (IFN-γ) as NKT1 cells; iNKT cells that express GATA-3 and secrete mostly interleukin 4 (IL-4) as NKT2 cells; and iNKT cells that express RORγt and produce IL-17 as NKT17 cells (ref. 6). Phenotypically, NKT1 cells are PLZFloNK1.1+ and have been described as ‘stage 3′ cells3, whereas NKT2 and NKT17 cells are characterized by the lack of NK1.1 expression3 and therefore fall into stage 2 of iNKT cell development. These three lineages are distinct, as they do not interconvert when they are injected intrathymically6.
Gene expression is subject to epigenetic regulation by histone and DNA modifications, nucleosome positioning, chromatin remodeling, and long-range chromatin interactions, which collectively affect the binding of transcription factors to their consensus sequences in DNA7,8. Among the most recently discovered epigenetic modifiers are the TET-family dioxygenases TET1, TET2 and TET3, which catalyze the oxidation of 5-methylcytosine (5mC) in DNA to 5-hydroxymethylcytosine (5hmC) and other oxidation products9–11. These modified bases are intermediates in DNA demethylation as well as epigenetic marks that may recruit specific readers12.
Dynamic changes in the distribution of 5hmC during thymic T cell lineage specification have been reported13. Here we found that deletion of both Tet2 and Tet3 in mice resulted in a lethal lymphoproliferative disease characterized by massive antigen-dependent expansion of iNKT cells. The disease was recapitulated by the transfer of small numbers of highly purified Tet2-Tet3 DKO iNKT cells into fully immunocompetent wild-type recipient mice, but could not be recapitulated by the transfer of such cells into CD1d-deficient recipient mice, which indicated that the iNKT cell expansion was driven by antigen recognition and TCR signaling. In parallel, we observed a pronounced skewing toward the NKT17 lineage, which correlated with increased DNA methylation and decreased expression of lineage-specifying transcription factors such as T-bet and ThPOK. Overall, our data indicate that TET2 and TET3 are important regulators of iNKT cell development and lineage specification, as well as tumor suppressors that restrict TCR-driven expansion.
RESULTS
iNKT cell expansion in Tet2-Tet3 DKO mice
TET2 and TET3 are the main TET proteins expressed in mouse T cells14. Tet2−/− mice15 are healthy and show no defects in T cell development, but Tet3−/− mice display perinatal death16. To evaluate the effect of deletion of both Tet2 and Tet3, we crossed Tet3fl/flCd4-Cre (Tet3 KO) mice (in which loxP-flanked Tet3 alleles (Tet3fl/fl) are deleted by Cre recombinase expressed from the T cell–specific Cd4 promoter (Cd4-Cre)) with Tet2−/− mice. Deletion of the Tet2 and Tet3 exons in T cells was confirmed by quantitative PCR; there was no compensatory upregulation of Tet1 mRNA (Supplementary Fig. 1a). Global 5hmC content was considerably lower, but was not eliminated, in sorted double-positive (DP), CD4SP and CD8SP thymocytes of Tet2−/− Tet3fl/flCd4-Cre (Tet2-Tet3 DKO mice) than in the corresponding subsets of wild-type mice (Supplementary Fig. 1b). Although most of our experiments were performed with Tet2−/−Tet3fl/flCd4-Cre mice, we observed identical phenotypes in Tet2fl/flTet3fl/flCd4-Cre mice (data not shown).
Beginning at 5 weeks of age, all Tet2-Tet3 DKO mice lost weight and exhibited a bloated and hunched appearance, whereas Tet2−/− and Tet3 KO mice remained healthy up to 14 months (data not shown). Within a few weeks of birth, Tet2-Tet3 DKO mice developed enlarged spleens and lymph nodes (data not shown), with disrupted architecture and loss of germinal centers (Supplementary Fig. 1c). The lungs and livers of Tet2-Tet3 DKO mice showed pronounced lymphocyte infiltration (Supplementary Fig. 1c). By 5–7 weeks, spleen cellularity was substantially increased (Fig. 1a), and all of the mice succumbed by 8 weeks of age (Fig. 1b). Disease development was associated with a massive expansion of iNKT cells in spleen and lymph nodes, even in young mice that maintained a normal reservoir of Treg cells (Fig. 1c,d); single deletion of Tet2 or Tet3 had a small, but significant, effect (Fig. 1e,f and Supplementary Fig. 1d,e). Moreover, compared with their wild-type counterparts, 3–4-week-old Tet2-Tet3 DKO mice showed decreased thymic cellularity and decreased percentages and numbers of DP thymocytes, suggestive of intrathymic stress, as well as a relative increase in the number and frequency of CD4SP and CD8SP cells in the thymus (Supplementary Fig. 2a–d). In contrast, peripheral lymphoid organs (spleen and lymph nodes) showed greatly increased cellularity despite decreased frequencies of peripheral CD4+ and CD8+ T cells (Supplementary Fig. 2e–h). Overall, simultaneous loss of Tet2 and Tet3 resulted in iNKT cell expansion and lethal disease.
Figure 1.
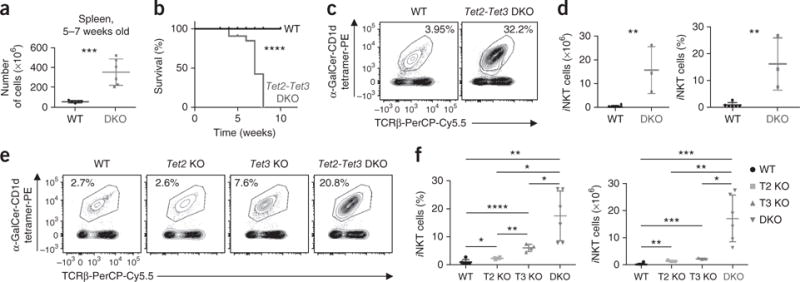
Simultaneous deletion of Tet2 and Tet3 severely compromises T cell homeostasis, leading to iNKT cell expansion and disease. (a) Quantification of total cells in the spleen of 5- to 7-week-old wild-type mice (WT) (n = 5) and Tet2-Tet3 DKO mice (DKO) (n = 6). (b) Disease-free survival of wild-type mice (n = 10) and Tet2-Tet3 DKO mice (n = 10) (Kaplan-Meier curve). (c) iNKT cells in spleens of 4-week-old wild-type (n = 6) versus Tet2-Tet3 DKO (n = 3) mice. (d) Quantification (left) and frequency (right) of iNKT cells in spleens isolated from 4-week-old Tet2-Tet3 DKO mice (n = 3) and wild-type mice (n = 6). (e) iNKT cells in the spleen of 3- to 4-week-old wild-type mice (n = 5), Tet2−/− (Tet2 KO) mice (n = 3), Tet3 KO mice (n = 3) and Tet2-Tet3 DKO mice (n = 6). (f) Frequency of iNKT cells in wild-type mice (n = 5), Tet2 KO mice (n = 3), Tet3 KO mice (n = 4) and Tet2-Tet3 DKO mice (n = 6) (left), and number of iNKT cells in wild-type mice (n = 3), Tet2 KO mice (n = 3), Tet3 KO mice (n = 3) and Tet2-Tet3 DKO mice (n = 6) (right). Numbers adjacent to outlined areas (c,e) indicate percent tetrameter+TCRβ+ cells. Each symbol (a,d,f) represents an individual mouse; horizontal lines indicate the mean (± s.e.m.). *P < 0.05, **P < 0.01, ***P < 0.001 and ****P < 0.0001 (unpaired t-test). Data are representative of 5 experiments (a), 10 experiments (b), 3 experiments (d), 3 experiments (e) or 3 experiments (f) or are from three independent experiments (c).
Regulation of iNKT-cell-lineage specification by TET2 and TET3
Notably, the selective expansion of Tet2-Tet3 DKO iNKT cells was already apparent in the thymus of very young (20-day-old) Tet2-Tet3 DKO mice (Fig. 2a–c). The percentages and absolute numbers of thymic iNKT cells were much greater in Tet2-Tet3 DKO mice than in wild-type, Tet2−/− or Tet3 KO mice (Supplementary Fig. 3a,b). Compared with iNKT cells of the other genotypes, Tet2-Tet3 DKO iNKT cells showed increased expression of RORγt in the thymus and periphery and loss of CD4 expression, which suggested skewing toward an NKT17-like phenotype6; decreased expression of Tbet in the thymus, which reflected a decrease in the number of NKT1-lineage cells; and increased expression of PLZF, consistent with a reduction in the number of cells of the NKT1 cell (PLZFlo) lineage (Fig. 2d,e and Supplementary Fig. 3). In wild-type mice, more than 60% of iNKT cells were NKT1 cells, whereas the predominant NKT cell subtype in Tet2-Tet3 DKO mice was NKT17 (Fig. 2f). However, because of the prominent iNKT cell expansion in the thymus, all effector iNKT cell subtypes were overrepresented in thymocytes of Tet2-Tet3 DKO relative to their abundance in wild-type mice (Fig. 2g).
Figure 2.

Tet2-Tet3 DKO iNKT cells in the thymus of young (3- to 4-week-old) mice are skewed toward the NKT17 cell lineage. (a) iNKT cells in the thymus of 20-day-old wild-type and Tet2-Tet3 DKO mice. Numbers adjacent to outlined areas indicate percent tetrameter+TCRβ+ cells. (b,c) Frequency (b) and number (c) of iNKT cells in the thymus of Tet2-Tet3 DKO mice (n = 22) and wild-type mice (n = 15). (d) Flow cytometry analysis of the expression of PLZF and RORγt in tetramer+CD24−TCRβ+ thymocytes. (d,e) Flow cytometry analysis of the expression of PLZF and RORγt (d) or of PLZF and T-bet (e) in tetramer+CD24−TCRβ+ thymocytes. (f) Frequency of iNKT cell subsets among total iNKT cells. (g) Results in f, presented as frequency among total thymocytes. (h) Flow cytometry of tetramer+CD24−TCRβ+ thymocytes from wild-type mice (n = 9) (top) and Tet2-Tet3 DKO mice (n = 12) (bottom), analyzing the expression of NK1.1 and binding of tetramer (left), expression of CD4 and CD27 in the tetramer+NK1.1− subset (arrow) (middle), and expression of CCR6 and CD27 in the tetramer+NK1.1+ subset (arrow) (right). (i) Frequency of the NK1.1− and NK1.1+ subsets (as defined in h) among total iNKT cells. (j) Quantification of the NK1.1− and NK1.1+ subsets (as defined in h) among total iNKT cells. Numbers adjacent to outlined areas (a,d,e,h) indicate percent cells in each. Each symbol (b,c,f,g,i,j) represents an individual mouse; horizontal lines indicate the mean (± s.e.m.). *P < 0.05, **P < 0.01, ***P < 0.001 and ****P < 0.0001 (unpaired t-test). Data are representative of 15 experiments (a), 5 experiments (i), 5 experiments (i), are from one experiment representative of four experiments (b–e) or are from four independent experiments with five wild-type mice and seven Tet2-Tet3 DKO mice (f,g) or five independent experiments (h).
Consistent with their skewing toward the NKT17 cell lineage, Tet2-Tet3 DKO iNKT cells potently produced IL-17 when stimulated with phorbol 12-myristate 13-acetate (PMA) and ionomycin (Supplementary Fig. 4a–c). The frequency of IFN-γ-producing iNKT cells was diminished relative to wild type, but, as a result of the iNKT cell expansion, the percentage of IFN-γ-producing iNKT cells among total thymocytes was increased (Supplementary Fig. 4d–f). This was also observed for IL-4 (Supplementary Fig. 4g–i). Relative to wild type, the increased numbers of PLZFhi, IL-4 producing iNKT cells in Tet2-Tet3 DKO mice were associated with the expected increase in numbers of innate-like memory CD8SP cells17 (Supplementary Fig. 4j,k), which showed high expression of genes associated with an activated, memory-like phenotype (data not shown). Tet2-Tet3 DKO CD8+ cells were underrepresented in the periphery (Supplementary Fig. 2e–h), presumably as a result of defects in migration and/or survival. We focused on the aberrant iNKT cells in Tet2-Tet3 DKO mice.
TetramerhiNK1.1− cells, which normally include CD4+CD27+ NKT2 cells6, NKT17 cells that do not express CD4 (ref. 6) and NKT1 precursor cells identified by T-bet expression18, were greater in terms of both percentage and absolute numbers in Tet2-Tet3 DKO mice than in wild-type mice (Fig. 2h–j). CD4 expression was almost undetectable in Tet2-Tet3 DKO iNKT cells, in contrast to its detectable expression in wild-type iNKT cells (Fig. 2h and Supplementary Fig. 3c). There was also a much larger PLZF+RORγt+ population in the NK1.1− Tet2-Tet3 DKO subset than in its wild-type counterpart (Supplementary Fig. 5a,b), with a concomitant decrease in the PLZF+T-bet+ subset that is thought to contain precursors of NKT1-cell-lineage cells (Supplementary Fig. 5c,d). Compared with their wild-type counterparts, a small population of Tet2-Tet3 DKO tetramer+NK1.1+CCR6−CD27+ NKT1 cells exhibited higher expression of PLZF than that of their their wild-type counterparts and aberrant expression of RORγt, and a small fraction of this PLZFhi population did not express T-bet (Supplementary Fig. 5e). The NK1.1+ Tet2-Tet3 DKO iNKT cells were not only less frequent among the thymic iNKT cells than their wild-type counterparts, but they were also functionally compromised, as they produced less IFN-γ than did wild-type cells (Supplementary Fig. 5f,g). We concluded that Tet2 and Tet3 regulated the generation and maturation of these iNKT cell lineages.
NKT17 lineage skewing in Tet2-Tet3 DKO iNKT cells
Transcriptional profiling of total thymic iNKT cells confirmed skewing toward the NKT17 cell lineage, with iNKT cells from young (3- to 4-week-old) Tet2-Tet3 DKO mice showing higher expression of Il17f, Rorc (which encodes RORγt) and Eomes and lower expression of Ifng, Il4, Tbx21 (which encodes T-bet) and Zbtb7b (which encodes ThPOK) than wild-type iNKT cells (Fig. 3a,b). We also observed higher expression of Lef1, which can promote malignant transformation19; Rag1, whose expression in NK cells correlates with an enhanced fitness, proliferative and survival capacity20; and the oncogenes Lmo4 (ref. 21) and Myb22 (Fig. 3a). These genes normally have high expression in DP thymocytes and are progressively downregulated1, which indicates that Tet2-Tet3 deficiency results in developmental immaturity.
Figure 3.

Gene-expression profiles of thymic wild-type and Tet2-Tet3 DKO iNKT cells. (a) Mean average (MA) plot of genes expressed differentially in thymic iNKT cells isolated from Tet2-Tet3 DKO relative to their expression in such cells from wild-type mice. (b) Expression of genes encoding selected transcriptional regulators (left) and cytokines and their receptors (right) in Tet2-Tet3 DKO, Tet3 KO and wild-type thymic iNKT cells, presented as row-wise z-scores (red, higher expression, and blue, lower expression, relative to other conditions). (c) Expression of selected genes of interest in stage 0, NK1.1− and NKT1 iNKT subsets. (d) Flow cytometry analysis of BrdU incorporation in tetramer+TCRβ+ thymocytes. Numbers adjacent to outlined areas indicate percent cells with BrdU incorporation. (e) Frequency of tetramer+TCRβ+ iNKT cells that incorporated BrdU. Each symbol represents an individual mouse; horizontal lines indicate the mean (± s.e.m.). **P < 0.01, (unpaired t test). Data are representative of one experiment with three biological replicates per genotype (a), one experiment with two biological replicates per genotype (b), one experiment with two biological replicates per genotype for stage 0, three biological replicates per genotype for NK1.1−, two biological replicates wild-type NKT1, and three biological replicates per genotype for DKO NKT1 (c), are from one experiment representative of two experiments with five mice per genotype (d) or from two independent experiments with five mice per genotype (e).
We also compared subtypes of wild-type and Tet2-Tet3 DKO iNKT cells (Fig. 3c). Genes that were downregulated in Tet2-Tet3 DKO stage 0 iNKT precursors relative to their expression in wild-type cells included those encoding CD4, Bcl11b (which restricts the NKT17 lineage23) and Satb1 (which forms complexes with PLZF in the presence of the Cullin E3 ligase24); genes that were upregulated included Zbtb16 (which encodes PLZF) and Lmo4 (Fig. 3c). In the heterogeneous NK1.1− iNKT cell population, genes that were upregulated in Tet2-Tet3 DKO cells relative to their expression in wild-type cells included Rorc, Zbtb16 and Myc (whose product controls iNKT cell proliferation25), and genes that were downregulated included Cd4, Satb1, Tbx21 and Zbtb7b (Fig. 3c). Combined loss of Tet2 and Tet3 affected the number, maturation and identity of the generated NKT1 cells; among the upregulated genes that we identified, Rorc and Lef1 (which is usually upregulated at an earlier stage (stage 0) of iNKT cell development)18 were expressed in stage 1 and 2 iNKT cells but are normally absent in stage 3 iNKT cells26. Thus, TET2 and TET3 markedly affect the gene-expression profiles of all iNKT cell subsets.
Enhanced proliferation of Tet2-Tet3 DKO iNKT cells
The upregulation of Myc, Rag1, Lmo4, Myb and other genes associated with the iNKT precursor state and high proliferative capacity prompted us to assess the proliferation of Tet2-Tet3 DKO iNKT cells in vivo. We injected mice with BrdU, a thymidine analog that is incorporated into DNA during replication, and analyzed iNKT cells 16 h later. Indeed, Tet2-Tet3 DKO iNKT cells showed significantly higher BrdU incorporation than did wild-type thymic iNKT cells (Fig. 3d,e).
Given that Treg cell function is compromised in Tet2-Tet3 DKO mice27, we sought to determine whether uncontrolled iNKT cell expansion would occur in the presence of intact Treg cells and, if so, whether antigen recognition would be involved. We transferred total Tet2-Tet3 DKO splenocytes (data not shown) or purified Tet2-Tet3 DKO iNKT cells (5 × 10⁵) into fully immunocompetent (non-irradiated) CD45.1+ recipient mice, either wild-type or lacking CD1d. All wild-type recipients developed enlarged spleen and lymph nodes and succumbed to disease by 90 d, whereas all CD1d-deficient (CD1d KO) recipients remained healthy (Fig. 4a). Spleen and lymph node cellularity increased significantly in the recipient mice, to an average of ~5 × 10⁸ cells after transfer (Fig. 4b); of these, typically >80% were iNKT cells (Fig. 4c). We also observed a slight expansion in CD1d KO recipients (Fig. 4b,c).
Figure 4.

Antigen stimulation promotes the expansion of Tet2-Tet3 DKO iNKT cells and disease development in fully immunocompetent recipients. (a) Disease-free survival of wild-type (n = 6) and CD1dKO recipients (n = 5) of Tet2-Tet3 DKO iNKT cells (Kaplan-Meier curve). **P < 0.01 (log-rank (Mantel-Cox) test and Gehan-Brenslow-Wilcoxon test). (b) Cellularity of the spleen (left) and lymph nodes (right) of wild-type recipients (n = 12) and CD1dKO recipients (n = 6) of Tet2-Tet3 DKO iNKT cells. (c) Frequency (top) and numbers (bottom) of iNKT cells in the spleen of wild-type recipients (n = 12) and CD1dKO recipients (n = 6) of Tet2-Tet3 DKO iNKT cells. (d) MA plot of genes expressed differentially in transferred and expanded Tet2-Tet3 DKO iNKT cells isolated from the spleen of congenic recipient mice relative to their expression in iNKT cells isolated from the spleen of healthy wild-type mice. (e) Expression (log2 fold values) of selected genes encoding transcriptional regulators with differential expression (higher (red) or lower (blue)) in Tet2-Tet3 DKO iNKT cells than in wild-type iNKT cells. (f) Pathway-enrichment analysis of differentially expressed genes in transferred Tet2-Tet3 DKO iNKT cells: purple, categories related to DNA replication, cell cycle and DNA repair; green, categories related to T cell function. Each symbol (b,c) represents an individual mouse; horizontal lines indicate the mean (± s.e.m.). **P < 0.01, ***P < 0.001 (unpaired t test). Data are from two independent experiments (a), three independent experiments (b,c), or one experiment with three biological replicates per genotype (d–f).
Compared with the expression of these genes in wild-type iNKT cells (Fig. 4d), transferred Tet2-Tet3 DKO iNKT cells maintained their expression of Rorc and Myb, upregulated their expression of genes encoding transcriptional regulators and oncogenic factors indicative of earlier stages of T cell development (Lmo1 and Lmo2 (ref. 21), Tcf7 and Myc28,29), as well as genes such as Ret30, whose products improve hematopoietic stem cell expansion and transplantation efficiency (Fig. 4d,e). Pathway-enrichment analysis revealed two main categories of differentially expressed genes: those encoding products related to T cell function and those encoding products related to DNA replication, cell cycle and DNA damage repair (Fig. 4f). Together these data indicated that loss of function of TET proteins conferred a cell-intrinsic phenotype of uncontrolled iNKT cell proliferation that was driven by antigen recognition and could be observed in recipient mice with normal immunological and Treg cell function.
TET2 and TET3 regulate chromatin accessibility
5hmC mapping by immunoprecipitation of DNA fragments containing cytosine-5-methylenesulfonate, the product of the reaction of 5hmC with sodium bisulfite (CMS-IP)31,32. revealed that the greatest amounts of 5hmC in wild-type iNKT cells were present in the gene bodies of the genes with the highest expression (Fig. 5a,b), as has been shown for other T cell types13. Whole-genome bisulfite sequencing (WGBS) of wild-type iNKT cells confirmed the expected inverse correlation between gene expression and DNA modification (5mC+5hmC) at promoters and transcription start sites (TSS)33 and revealed that loss of 5mC+5hmC extended deeply into the gene bodies of the genes with the greatest transcription (Fig. 5c). Relative to the abundance of 5mC and/or 5hmC at enhancers identified in embryonic stem cells or in cardiac tissue, thymus-specific enhancers34 showed greater enrichment for 5hmC13 (472 of 5,605 thymic enhancers intersect with 5hmC; Fig. 5d). Their and their 5mC+5hmC content was greater in Tet2-Tet3 DKO iNKT cells than in wild-type iNKT cells (Fig. 5e). Our data indicated that TET proteins were needed continuously to constrain CpG methylation of these enhancers in iNKT cells.
Figure 5.
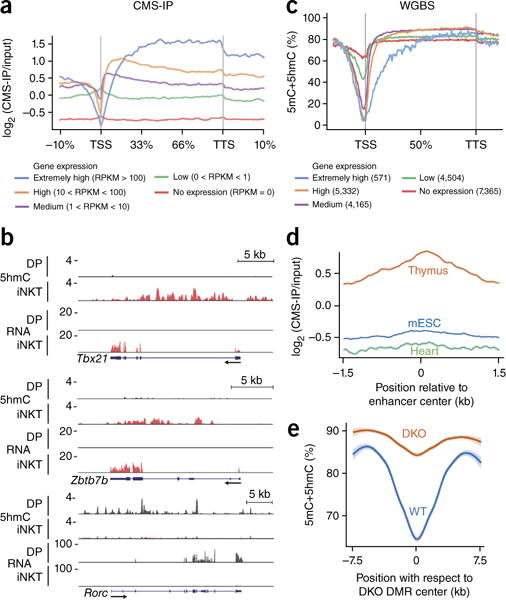
5hmC shows enrichment in the bodies of genes with high expression in iNKT cells and those expressing key iNKT-cell-lineage-specifying factors. (a) CMS-IP analysis of the enrichment for 5hmC over the gene body, categorized on the basis of gene expression (RNA-seq analysis), in wild-type thymic iNKT cells. (b) Genome browser views of intragenic 5hmC (CMS-IP analysis) and gene expression (RNA-seq analysis) in Tbx21, Zbtb7b and Rorc in wild-type thymocytes. (c) Average enrichment for 5mC+5hmC over the gene body, categorized on the basis of gene expression (WGBS and RNA-seq analysis), in wild-type thymic iNKT cells. (d) Average enrichment of 5hmC in wild-type iNKT cells from tissue-specific enhancers in the thymus (orange), mouse embryonic stem cells (mESC; blue) and heart (green)34. (e) Modification of 5mC+5hmC in wild-type and Tet2-Tet3 DKO iNKT cells, plotted against position relative to DMR. Data are representative of one experiment with two biological replicates for CMS-IP seq, two biological replicates for WGBS and three biological replicates for RNA-seq.
Comparing wild-type and young Tet2-Tet3 DKO iNKT cells, we found a much greater average abundance of 5mC+5hmC at the TSS and in gene bodies of Tet2-Tet3 DKO iNKT cells than in those of wild-type cells, whether we considered all genes (data not shown) or only differentially expressed genes (Supplementary Fig. 6a). The increase was specific, as it was not seen in randomly chosen genome fragments of similar size (Supplementary Fig. 6a). Both upregulated genes and downregulated genes in Tet2-Tet3 DKO iNKT cells showed similar increases 5mC+5hmC at promoters and TSSs, as well as gene-body modifications (Supplementary Fig. 6b). Similar findings have been reported for Tet2-Tet3 DKO hematopoietic stem cells and precursor cells35. Overall, although it was clear that TET proteins regulated DNA modification in transcribed regions of the genome (promoters, gene bodies and enhancers), our data suggested a complex relationship between loss of TET protein function, the resulting increase in DNA methylation and changes in gene expression.
Nevertheless, our data suggested involvement of TET proteins in developmental transitions in lymphocytes. Comparing our WGBS data for wild-type iNKT cells with data for common lymphoid progenitor (CLP) cells36, we identified differentially methylated regions (DMRs) whose modification status changed during the differentiation of CLP cells into iNKT cells (Fig. 6a). 2,100 regions gained 5mC+5hmC and 1,400 DMRs lost 5mC+5hmC. Focusing on differentiation-related DMRs that lost 5mC+5hmC during the CLP–to–iNKT cell transition, we found that Tet2-Tet3 DKO iNKT cells showed increased modification at these DMRs (Fig. 6a), which indicated that loss of 5mC+5hmC during the CLP–to–iNKT cell transition required TET2 and TET3. Even in regions that gained modification as CLPs differentiated into iNKT cells, DNA modification increased further in Tet2-Tet3 DKO iNKT cells (Fig. 6a), which suggested that cytosine methylation by DNA methyltransferases at these regions was unhindered in the absence of TET2 and TET3. All three TET proteins had higher expression in iNKT cells than in CLP cells37 (Fig. 6b).
Figure 6.

TET proteins regulate DNA modification in iNKT cells. (a) DNA modification in CLPs and wild-type and Tet2-Tet3 DKO iNKT cells, showing more (red) or less (blue) modification. (b) RNA-seq analysis of Tet1, Tet2 and Tet3 in iNKT cells and CLPs. (c) Quantification of DMRs relative to their distance to the TSS. Data are representative of one experiment with two technical replicates for CLPs and two biological replicates per genotype for iNKT cells (a,c), and three biological replicates for iNKT cells and one sample for CLPs (b).
We compared the genome-wide distribution of all DMRs with that of 5hmC. Two thirds of all DMRs, whether more highly modified in Tet2-Tet3 DKO iNKT cells or in wild-type iNKT cells, were located distal to promoter-TSS regions (that is, more than 5 kb from the TSS; Fig. 6c). Of a total of 10,945 DMRs (Table 1) that were more methylated (5mC+5hmC) in Tet2-Tet3 DKO iNKT cells than in wild-type cells, ~42% overlapped with regions that contained 5hmC in wild-type iNKT cells; of these, ~32% were near TSSs (±5 kb), corresponding to a total of 1,270 genes (Table 1). Only 183 (~14%) of these genes showed altered expression (Table 1). These results supported the idea that a subset of 5hmC-bearing promoters in wild-type cells acquire more 5mC+5hmC in the absence of TET function and that a small fraction of the corresponding genes show the expected correlation between increased promoter methylation and decreased expression. A caveat for this is that part, or all, of the modification that we measured might have been a result of 5hmC deposited by TET1.
Table 1.
DMRS (5mC+5hmC) identified by WGBS of wild-type and Tet2-Tet3 DKO i NKT cells
| DMRs
| ||
|---|---|---|
| DMRs more methylated in Tet2-Tet3 DKO versus WT iNKT cells | DMRs less methylated in Tet2-Tet3 DKO versus WT iNKT cells | |
| Total DMRs | 10,945 | 767 |
| DMRs overlapping WT CMS-IP | 4,568 | 10 |
| DMRs overlapping WT CMS-IP close to promoters (±5 kb) | 1,468 | 5 |
| Unique genes from above | 1,270 | 4 |
| Downregulated | 138 | 0 |
| Upregulated | 45 | 3 |
Finally, we observed a strong correlation between 5hmC distribution and chromatin accessibility, as judged by assay of transposase-accessible chromatin sequencing (ATAC-seq)38 (Fig. 7). Although similar numbers of genomic regions gained and lost accessibility in Tet2-Tet3 DKO iNKT cells relative to their accessibility in wild-type cells (3,162 and 2,711, respectively), there was a marked overlap (37.5%) between differentially accessible regions (DARs) that lost accessibility in DKO iNKT cells and those that had 5hmC in wild-type iNKT cells (Fig. 7). In contrast, only a few regions (2.7%) that gained accessibility in Tet2-Tet3 DKO iNKT cells relative to their accessibility in wild-type cells were marked by 5hmC in wild-type iNKT cells (Fig. 7a). A considerably smaller fraction of DARs than of DMRs were located close to TSS (Fig. 7b). Most DARs were located far from the TSS, whether they were less accessible in Tet2-Tet3 DKO iNKTs, more accessible in Tet2-Tet3 DKO iNKTs, or commonly accessible in both wild-type and Tet2-Tet3 DKO iNKTs. Overall, these data suggested a link between the loss of chromatin accessibility in Tet2-Tet3 DKO iNKT cells and the loss of 5hmC.
Figure 7.
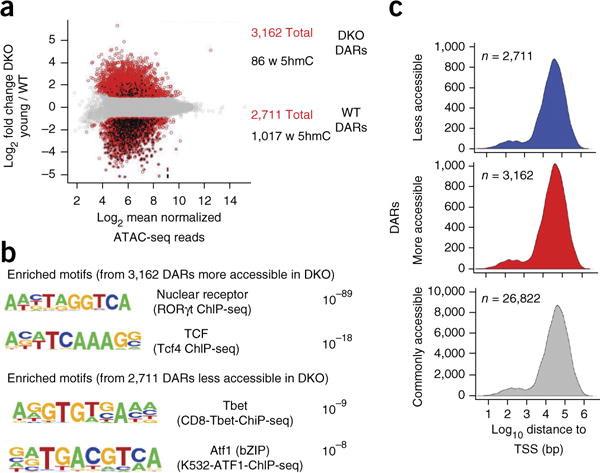
Characterization of chromatin regions with differential accessibility in wild-type iNKT cells versus Tet2-Tet3 DKO iNKT cells. (a) ATAC-seq analysis of DARs (red) in wild-type iNKT cells versus Tet2-Tet3 DKO iNKT cells: black, DARs that overlap 5hmC (CMS-IP peaks). (c) Motif-enrichment analysis (HOMER) of the 3,162 DARs more accessible in Tet2-Tet3 DKO iNKT cells than in wild-type iNKT cells (top) and of the 2,711 DARs less accessible in Tet2-Tet3 DKO iNKT cells than in wild-type cells (bottom). (b) Distance of DARs to the nearest TSS, among DARs less (blue) or more (red) accessible in Tet2-Tet3 DKO iNKT cells than in wild-type iNKT cells or commonly accessible in both wild-type and Tet2-Tet3 DKO iNKT cells (gray). Data are representative of two experiments and three biological replicates per genotype in total for ATAC seq. For CMS-IP, data are representative of one experiment with two biological replicates.
Regulation of iNKT-cell-lineage-specifying factors
Tet2-Tet3 deficiency affected the chromatin accessibility and DNA-modification status of several genes encoding products involved in iNKT cell lineage specification and function (Supplementary Figs. 7 and 8). For example, a region near the TSS and first intron of Zbtb7b showed both a gain of 5mC+5hmC and a decrease in accessibility in Tet2-Tet3 DKO relative to such features in wild-type cells, Tet2-Tet3 DKO iNKT cells; note the large undermethylated canyon39 in the Zbtb7b proximal promoter that gains 5mC+5hmC at its edges (Supplementary Fig. 7a). Similarly, a region 5′ of the Tbx21 promoter that overlaps with a predicted thymic-specific enhancer34 showed a perceptible gain of 5mC+5hmC and there was a concomitant decrease in Tbx21 mRNA expression in young Tet2-Tet3 DKO relative to its expression in wild-type iNKT cells (Supplementary Fig. 7b). Moreover, an intragenic region in Tbx21 that overlaps a different predicted thymus-specific enhancer34 showed lower accessibility in Tet2-Tet3 DKO iNKT cells than in wild-type iNKT cells (Supplementary Fig. 7b). Other genes encoding cytokines and transcriptional regulators, such as Il4, Ifng, Bcl11b and Satb1, also showed downregulated expression, parallel loss of chromatin accessibility and gain of DNA modification, and this was sometimes, but not always, at the same genomic sites (Supplementary Fig. 8 and data not shown). There were also examples in which a substantial increase in DNA modification was observed without a corresponding decrease in gene expression (for example, Gata3; data not shown). Overall, the data points to a stronger link between chromatin accessibility and 5hmC (measured by CMS-IP) than between chromatin accessibility and DNA modification (5mC+5hmC; measured by WGBS).
Notably, of the 3,162 regions that showed greater chromatin accessibility in Tet2-Tet3 DKO iNKT cells than in wild-type cells, eight were located in the vicinity of Rorc (Supplementary Fig. 7c), which correlated with higher expression of Rorc mRNA in Tet2-Tet3 DKO iNKT cells than in wild-type iNKT cells (Supplementary Fig. 7c). One of these more-accessible regions, located upstream of the Rorc promoter, overlapped a predicted thymic-specific enhancer34 (Supplementary Fig. 7c). Furthermore, motif-enrichment analysis of the 3,162 DARs that were more accessible in Tet2-Tet3 DKO iNKT cells than in wild-type iNKT cells revealed considerable enrichment for the consensus RORγt-binding sequence (Fig. 7c); conversely, the 2,711 DARs that were less accessible in Tet2-Tet3 DKO iNKT cells than in wild-type iNKT cells showed enrichment for consensus binding sequences for T-box- and basic-region-leucine (bZIP) transcription factors (Fig. 7c). Overall, the skewing toward the NKT17 cell lineage that we observed in Tet2-Tet3 DKO iNKT cells might be explained by a combination of greater chromatin accessibility at the Rorc promoter and gene body and the enrichment for RORγt-binding motifs and loss of T-bet-binding motifs in Tet2-Tet3 DKO iNKT cells relative to such features in wild-type iNKT cells.
Suppression of aberrant RORγt expression by ThPOK and T-bet
Unlike Tbx21 (which encodes T-bet) and Zbtb7b (which encodes ThPOK), which both had high expression in wild-type iNKT cells and contained large amounts of 5hmC (Fig. 5b), Rorc had low expression and small amounts of 5hmC (Fig. 5b). T-bet and ThPOK probably both repress RORγt expression: T-bet deficiency redirects the development of iNKT cells toward the NKT2 and NKT17 cell lineages6,40, and decreased expression of ThPOK correlates with increased NKT17 differentiation41. To confirm that ThPOK and T-bet were able to suppress the aberrant overexpression of RORγt in Tet2-Tet3 DKO iNKT cells, we retrovirally expressed these transcription factors in Tet2-Tet3 DKO iNKT cells. Indeed, ThPOK, in the absence of TET2 and TET3, was sufficient to completely suppress RORγt expression (Fig. 8a,b) and IL-17 production (Fig. 8c). T-bet, on the other hand, only partially suppressed RORγt expression in Tet2-Tet3 DKO iNKT cells (Fig. 8d,e). We concluded that the decrease in ThPOK and T-bet expression in Tet2-Tet3 DKO iNKT cells might explain the increase in RORγt expression.
Figure 8.
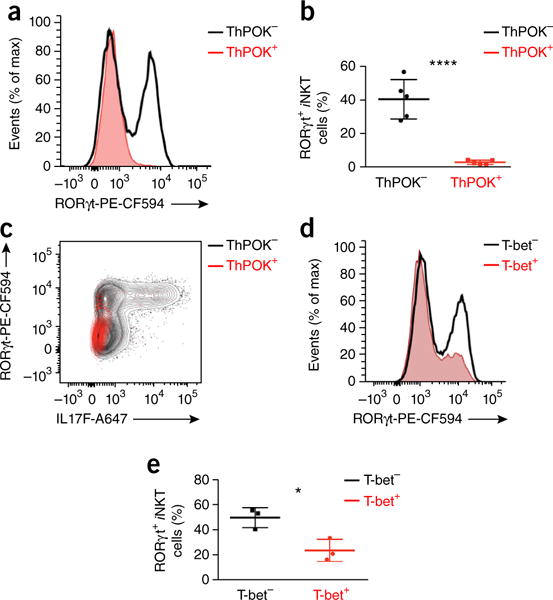
Ectopic expression of ThPOK or T-bet in Tet2-Tet3 DKO iNKT cells can suppress the aberrant increase in RORγt expression. (a) Flow cytometry analysis of RORγt expression in Tet2-Tet3 DKO iNKT cells transduced to express ThPOK (ThPOK+) or not (ThPOK−). (b) Frequency of RORγt-expressing Tet2-Tet3 DKO iNKT cells as in a. (c) Flow cytometry analysis of Rorγt expression and IL-17F production in Tet2-Tet3 DKO iNKT cells as in a. (d) Flow cytometry analysis of RORγt expression in Tet2-Tet3 DKO iNKT cells transduced to express T-bet (T-bet+) or not (T-bet−). (e) Frequency of RORγt-expressing Tet2-Tet3 DKO iNKT cells as in d. Each symbol (b,e) represents an individual mouse; horizontal lines indicate the mean (± s.e.m.). *P < 0.05, ****P < 0.0001 (unpaired t test). Data are representative of four experiments (a) or three experiments (d) or are from four independent experiments with a total of five mice (b), one experiment representative of two experiments with three mice (c) or one experiment representative of three experiments (e).
DISCUSSION
We studied mice with disrupted Tet2 and Tet3 genes at the DP stage of thymocyte development. Tet2-Tet3 DKO mice showed a marked disease phenotype that reflected multiple factors: compromised development, migration and function of several T cell subsets; uncontrolled expansion of NKT17-cell-lineage-skewed iNKT cells; the appearance of innate CD8+ cells that did not migrate to the periphery; and a dysfunctional phenotype of Treg cells, with unstable Foxp3 expression resulting from impaired demethylation of the intronic Foxp3 enhancer CNS2 (ref. 27). For all these disease features, loss of function of the TET proteins was necessary; individual deletion of TET2 or TET3 had only mild effects.
The phenotype of iNKT cell expansion was already apparent in 3-week-old mice that had not yet developed the disease phenotype; it was recapitulated by the transfer of small numbers of highly purified Tet2-Tet3 DKO iNKT cells into immunocompetent recipient mice, which indicated that the expansion was not a result of the defect in functional Treg cells in Tet2-Tet3 DKO mice27. The expansion was antigen driven, as it was barely observed in CD1d-deficient recipient mice. Treg cells and iNKT cells were the two cell types most affected in Tet2-Tet3 DKO mice; a likely explanation is that conventional self-reactive T cells were deleted in the periphery, whereas both Treg cells and iNKT cells were ‘agonist selected’ and thus proliferated and survived42. The dominant iNKT cell phenotype might also reflect the highly proliferative nature of developing iNKT cells3. iNKT cell expansion is also common in mice lacking other epigenetic regulators, such as Ezh2 (ref. 43) and Jarid2 (ref. 44), in T cells.
Notably, mice lacking individual TET proteins in T cells and hematopoietic stem cells show relatively mildly altered organismal phenotypes, such as individual germline deletions45. Deletions of Tet1 and Tet2 predispose mice to late-onset B cell malignancies and myeloid malignancies, respectively45. TET2 modulates cytokine production and gene expression in CD4+ helper T cells46 and partially controls Treg cell function27,47. However, inducible deletion of both Tet2 and Tet3 in mouse hematopoietic stem cells is needed to cause the rapid development of an aggressive acute myeloid leukemia35. One possible explanation for this is that TET1 and TET2 have distinct functions, whereas TET2 and TET3 have more redundant roles. Indeed, TET1 has a major role in the deposition of 5hmC at promoter and TSS regions in mouse embryonic stem cells, whereas TET2 (and, as shown here, TET3) seems to act predominantly at distal enhancers48. Because of the lack of commercially available chromatin-immunoprecipitation-quality antibodies, we were not able to pinpoint the genomic regions at which TET2 and TET3 act in T cells.
Our genome-wide analyses provided a detailed view of the relationships among DNA-modification status (5mC+5hmC, assessed by WGBS), 5hmC distribution (assessed by CMS-IP), chromatin accessibility (assessed by ATAC-seq) and gene expression in thymic iNKT cells. These factors are interconnected: several transcription factors and chromatin modifiers have been shown to recruit TET proteins45, and regions marked by 5hmC in wild-type iNKT cells showed more chromatin accessibility than that of Tet2-Tet3 DKO iNKT cells. DMRs that lost or gained DNA modification (5mC+5hmC) during CLP–to–iNKT cell development also showed increased modification in Tet2-Tet3 DKO iNKT cells, which indicated that TET proteins participate in developmental transitions in lymphoid-lineage cells. Tbx21 and Zbtb7b, which encode the key transcriptional regulators T-bet and ThPOK, showed parallel decreases in 5hmC, chromatin accessibility and gene expression in Tet2-Tet3 DKO iNKT cells relative to such features in wild-type iNKT cells, which indicated a requirement for TET2 and TET3. In contrast, the marked increase in accessibility and expression of Rorc and RORγt inTet2-Tet3 DKO iNKT cells appeared to be mediated indirectly through decreased expression of T-bet and ThPOK, as overexpression of either T-bet or ThPOK in Tet2-Tet3 DKO iNKT cells suppressed RORγt expression. Future work will need to elucidate the precise sequence of molecular events that lead to TET-mediated control of iNKT cell expansion, lineage skewing and an acquisition of transmissible malignant phenotype.
ONLINE METHODS
Mice
Mice were housed in a pathogen-free animal facility at the La Jolla Institute for Allergy and Immunology and were used according to protocols approved by the Institutional Animal Care and Use Committee. Tet2−/− mice were generated by crossing CMVCre mice to Tet2fl/fl mice, in which exons 8, 9 and 10 that code for the catalytic HxD domain, were floxed (flanked by loxP sites)15. Tet3fl/fl mice were generated by targeting exon 2 (ref. 49). Tet2−/− and Tet3fl/fl mice were crossed with Cd4-Cre50 mice to generate Tet2−/−Tet3fl/fl Cd4-Cre mice (DKO mice). These mice lack Tet3 in the T cell lineage due to deletion of Tet3 exon 2 in thymocytes at the CD4+CD8+ (double-positive, DP) stage. The Tet2-Tet3 DKO mice are in the C57BL/6 background. B6.SJL-PtprcaPep3bBoyJ (CD45.1+) mice, C57BL/6 (CD45.2+) mice and CD1dKO (Cd1dtg1.2) mice (B6(C)-Cd1d1tm1.2Aben/J) were purchased from Jackson laboratory. Both male and female mice were used in this study with similar findings. The majority of the experiments was done using young mice (3–5 weeks old as indicated). Analysis of older mice (6–8 weeks old) was performed to evaluate the lethal and aggressive nature of the observed phenotype. For transfer experiments 5–6 weeks old recipients were used. The recipients were of the same sex as the donors. Both male and female recipients were used and similar results were obtained.
Histology
Organs were isolated from age- and sex-matched control and Tet2-Tet3 DKO mice and placed immediately in 10% formalin (Fisher), fixed overnight and then placed in 70% ethanol. Samples were paraffin-embedded, sectioned, stained with haematoxylin and eosin, and imaged using a Nikon Eclipse 80i microscope.
Flow Cytometry
Cells were isolated from thymus, spleen, lymph nodes and bone marrow. Surface staining was performed using antibodies from BioLegend: CD4 (RM4-5), CD8 (53-6.7), TCRβ (H57-597), B220 (RA3-6B2), CD44 (IM7), CD122 (5H4), CD24 (M1/69), CXCR3 (CXCR3-173), CD45.1 (A20), CD45.2 (104), CCR6 (29-2L17), CD103 (2E7), IL-4 (11B11), IL-17-F (9D3.1C8) and eBioscience: Eomes (Dan11mag), CD27 (LG-7F9) and IFN-γ (XMG1.2). PLZF (R17-809), T-bet (O4-46) and RORγt (Q31-378) were purchased from BD Pharmingen. In the initial stages of this study PLZF-Alexa Fluor 647 (D-9) was used and was obtained from Santa Cruz. α-GalCer–CD1d tetramer (conjugated either with PE or with BV421) was obtained from the NIH Tetramer Core. Vα14 iNKT cells were routinely defined as TCRβ intermediate, B220− and positive for α-GalCer–CD1d tetramer binding. Intracellular staining for transcription factors PLZF, RORγt and Eomes was performed using the Foxp3 staining kit (cat no: 00-5523-00) from eBioscience. In order to evaluate the simultaneous expression of PLZF and T-bet in iNKT cell subsets a different staining strategy was followed that in our hands significantly increased the efficiency of T-bet staining51. Briefly, cells were surfaced stained, washed in flow cytometry staining buffer (PBS containing 3% FBS), resuspended in 100 μl PBS and then add 100 μl of 4% methanol-free formaldehyde (Pierce) to obtain a final concentration of 2% formaldehyde. Cells were fixed for 30 min, centrifuged and washed in 200 μl of 1× permeabilization buffer from the Foxp3 staining kit (cat no: 00-5523-00) from eBioscience. Subsequently, the cells were resuspended in 1x Permeabilization buffer (Foxp3 staining kit) containing PLZF-A647 (R17-809) and T-bet (O4-46) Alexa Fluor 488 and RORγt (Q31-378) PE CF594. Acquisition was performed in a BD LSR Fortessa (BD Biosciences) using the BD FACSDiva Software. Data analysis was performed with FlowJo (Treestar).
Ex vivo cytokine production
Thymocytes (in a concentration of 1 × 10⁶ cells/ml) were stimulated in the presence of 50 ng/ml PMA and 1.5 μM ionomycin for 4 h. In the last 2 h of culture Brefeldin A was added in a concentration of 10 μg/ml. Cells were washed, stained for surface markers and fixed with 2% of formaldehyde for 15 min at 37 °C. Subsequently the protocol of the transcription factor staining set from BD was followed to stain for IL-4 (11B11), IL17-F (9D3.1C8) and IFN-γ (XMG1.2).
In vivo BrdU incorporation
Mice were intraperitoneally injected with 100 μl of 10 mg/ml BrdU. 16 h later mice were euthanized and the cells were stained for surface markers and subsequently for BrdU according to the accompanying protocol (BD Pharmingen, APC BrdU flow kit 552598).
Isolation of Vα14 iNKT cells
Vα14 iNKT cell preparations for RNASeq analysis, CMS-IP seq and WGBS seq were performed using in case of control mice a pool of cells (isolated from thymus or spleen as indicated on each case) from C57BL/6 mice and from age- and sex-matched Tet2-Tet3 DKO mice. For fluorescence-activated cell sorting (FACS), cells from wild-type mice were depleted of CD19+ (6D5), TER-119+ (TER119), CD8+ (53-6.7), CD11c+ (N418), F4/80+ (BM8) and CD11b+ (M1/70) cells using biotinylated antibodies (BioLegend) and subsequent binding to magnetic streptavidin beads (Life Technologies). The unbound cells were incubated with 1 μg/ml Streptavidin A (Sigma-Aldrich) and subsequently stained with α-GalCer-loaded Cd1d tetramers and anti-TCRβ, after which tetramer-binding, TCRβ+ cells were isolated using a FACSAria cell sorter (BD Biosciences). To obtain Tet2-Tet3 DKO cells, no depletion was performed since iNKT cells had proliferated extensively. Rather, live B220− α-GalCer-Cd1d tetramer-binding, TCRβ+ cells were isolated using a FACSAria cell sorter (BD Biosciences).
Transduction of Vα14 Tet2-Tet3 DKO iNKT cells
3 × 10⁶ PLAT-E cells were seeded in 10-cm plates. The cells were cultured in DMEM (Invitrogen) containing 10% FBS and in the absence of antibiotics. Retrovirus was produced by transfecting PLAT-E cells with pRV T-bet52 or pMX-ThPOK-IRES-GFP. The Mirus transfection reagent was used according to the manufacturer’s guidelines. We collected the supernatants 48 h and 72 h post-transfection and stored them at 4 °C. iNKT cells were sorted from Tet2-Tet3 DKO mice 3–4 week-old and cultured in the presence of 10 ng/ml IL-7. 24 h and 48 h post sorting iNKT cells were infected by addition of virus in the presence of 10 μg/mL polybrene and centrifuged at 931 g for 90 min at 35 °C. 24 h after the second transduction Tet2-Tet3 DKO iNKT cells were sorted based on GFP expression to separate un-transduced from transduced cells. To monitor if ThPOK and T-bet could bypass the loss of TET2 and TET3 and directly regulate RORγt expression and subsequent IL-17 secretion, GFP− (non-transduced) and GFP+ (transduced) cells were compared by flow cytometry for RORγt expression. Cells were rested post sorting and restimulated in the presence of 10 nM of PMA and 1nM ionomycin for 4 h. 5 μg/ml brefeldin A (Sigma) was added for the last 2 h to inhibit cytokine secretion.
Splenocyte and iNKT cell adoptive transfer
Total splenocytes or sorted iNKT cells were transferred retro-orbitrally to non-irradiated, fully immune-competent congenic (B6.SJL-PtprcaPep3bBoyJ) (CD45.1+) mice. The mice were monitored by bleeding and subsequent flow cytometry analysis to evaluate the proliferation of the transferred cells.
Bulk RNA-seq
Total RNA was isolated from thymic iNKT cells isolated from young (3–4 weeks old) mice and spleens from wild type or congenic recipients of Tet2-Tet3 DKO iNKT cells using the E.Z.N.A. HP Total RNA kit (Omega) according to the manufacturer’s instructions. Libraries were prepared using the Truseq RNA stranded kit (Illumina). The starting RNA material was 1 μg. Briefly, polyA+ RNAs were selected with magnetic beads, the RNA was fragmented and cDNA was synthesized. After A-tailing and adaptor ligation, libraries were generated by amplifying the cDNA for 10–12 cycles. 3 different biological replicates per genotype were evaluated. The results of these experiments are shown in Figures 3a and 4d–f.
Micro-scaled RNA-seq (Smart-seq) of total iNKT cells
In this case, the starting total RNA for each library was 10 ng. RNA was isolated from wild-type, Tet3 KO and Tet2-Tet3 DKO iNKT cells (data depicted in Fig. 3b) we performed SMART-seq as previously described53. RNA was isolated using the RNeasy Micro kit (Qiagen). RNA was incubated with free dNTPs and tailed oligo-dT oligonucleotides. The reverse transcription reaction was performed at 42 °C in the presence of 1 M betaine (Sigma) and increased concentration of MgCl2 (6 mM) to increase cDNA yield. SuperScript II reverse transcriptase and RNAse Out Inhibitor (Invitrogen) were used. Template switching oligonucleotides (TSO) were added to enable template switching by the reverse transcriptase, which synthesizes a complementary sequence to the TSO. Nine cycles of pre-amplification were performed using the KAPA HiFi HotStart Ready Mix (Kapa Biosystems). PCR products were purified with Ampure XP beads (Beckman Coulter) and quantified using High Sensitivity DNA Qubit (Life Technologies). The size distribution of the amplified DNA was evaluated in a high-sensitivity Bioanalyzer DNA chip (Agilent). Following the pre-amplification step, cDNA was tagmented using Nextera XT DNA kit (Illumina). 1 ng of cDNA per tagmentation reaction was used. The reaction was performed at 55 °C for 5 min. The Tn5 tranposase was stripped off the tagmented DNA by adding neutralize tagment (NT) buffer according to the manufacturers. Eight cycles were performed for amplification of adaptor-ligated fragments using the Nextera PCR master mix and selected indexed primers (Nextera XT Index kit, Illumina). Two independent SMARTseq samples per genotype were used.
Micro-scaled RNA-seq (Smart-seq) of iNKT cell subsets
To prepare the SMART-seq samples for the wild-type and the Tet2-Tet3 DKO subsets iNKT cell stage 1 (defined as TCRint tetramer+ CD24−NK1.1+CD27+CCR6−) (n = 2 subsets isolated from two different mice/genotype were assessed) and the TCRint tetramer+ CD24−NK1.1− (containing mainly stage II iNKT cells) (n = 3 subsets isolated from three independent mice per genotype were evaluated). For the library preparation, ten cycles of PCR amplification were used. The data are shown in Figure 3c.
In all cases, the integrity of the isolated RNA was evaluated in the Bioanalyzer (Agilent Technologies). Only samples with a minimum RIN value of 9 were used for library preparation. The quality and quantity of the amplified libraries was evaluated using Bioanalyzer (Agilent Technologies Inc) and HS Qubit (Life Technologies). The libraries were pooled in a concentration of 10 nM and sequenced using an Illumina Hiseq 2500 instrument.
Genome-wide 5hmC mapping by CMS-IP-seq
Vα14 iNKT cells were isolated by flow cytometry and DNA was isolated using the PureLink genomic DNA mini kit (Life Technologies). DNA was fragmented to an average size of 200 bp using the Adaptive Focused Acoustics Covaris S2 instrument. Library preparation, bisulfite treatment and immunoprecipitation of CMS (5hmC)-enriched DNA were performed as previously described13,31. Briefly, fully unmethylated λ (lambda) DNA (Promega) was spiked into the mouse genomic DNA at a ratio of 1:200. DNA was end-repaired using the End Repair (Illumina Epicentre) and A-tailed (using Klenow fragment, New England BioLabs). Ligation of methylated adapters (NeBNext Multiplex Oligos for Illumina, New England BioLabs) was performed using Quick Ligase Kit (New England BioLabs). DNA was bisulfite-treated using the MethylCode Bisulfite Conversion Kit (Life Technologies). 1% of bisulfite-converted DNA was kept as input and the rest was used for immunoprecipitation with anti-CMS antibody31. The anti-CMS recognizes 5hmC that upon bisulfite treatment is converted to cytosine-5-methylenesulfonate (CMS), enabling thus the enrichment of 5hmC containing DNA fragments31. The immunoprecipitated DNA was amplified using Kapa HiFi Uracil+ (Kapa Biosystems). Two different CMS-IP samples per genotype were evaluated.
Whole-genome bisulfite sequencing (WGBS-seq)
Vα14 iNKT cells were isolated by flow cytometry and DNA was isolated using the PureLink genomic DNA mini kit (Life technologies). DNA was fragmented. 1.5 μg of the fragmented DNA was used for the library preparation and bisulfite treatment was done as described in the CMS-IP seq section. After the bisulfite conversion the purified DNA was amplified for 4 cycles (low amplification) using Kapa HiFi Uracil+ (Kapa Biosystems). 2 independent WGBS samples per genotype were evaluated.
In describing the WGBS data, we use the term “DNA modification” (5mC+5hmC) in preference to “DNA methylation” because bisulfite sequencing does not distinguish between 5mC and 5hmC54, and because dot blot analysis shows persisting 5hmC in Tet2-Tet3 DKO thymocytes (Supplementary Fig. 1b) that is most likely deposited by TET1 (Supplementary Fig. 1a). However, the term “DNA methylation” is approximately correct, since 5hmC represents only a small percentage of total modified cytosines in T cells (<10% of 5mC)14,55.
To examine changes in DNA modification at the level of individual TSS regions and gene bodies, we calculated the average change in DNA modification in each gene body and at each promoter/TSS region (DMR discovery; Supplementary Methods), and plotted the values against the change in expression of the corresponding gene (Supplementary Fig. 6b).
Identifying chromatin accessibility by the assay of transposase-accessible chromatin sequencing (ATAC-seq)
Libraries were prepared as previously described38. 5 × 10⁴ iNKT cells were sorted, washed once with PBS and lysed in 100 μl of ice-cold lysis buffer (10 mM Tris-HCl, pH 7.4, 10 mM NaCl, 3 mM MgCl2 and 0.1% IGEPAL CA-630). Then, nuclei were spun at 500g for 10 min and the pellet was resuspended in 50 μl transposase reaction mix [2.5 μl transposase (Illumina), 25 μl 2 × TD buffer (Illumina) and 22.5 μl nuclease free water). The reaction was incubated for 30 min at 37 °C. Samples were purified using MinElute kit (Qiagen). The purified DNA was amplified using Kapa Real time library amplification kit (Kapa Biosystems). Libraries were amplified for 10–11 cycles. iNKT cells isolated from 3 different mice/genotype were evaluated.
Quantitative real-time RT PCR
Total RNA from DP, CD4SP and CD8SP T cells was isolated with E.Z.N.A HP Total RNA. cDNA was synthesized using Superscript reverse transcriptase and oligo(dT) primers (Life Techologies), and gene expression was evaluated with Step One Plus (Applied Biosystems) using Roche SYBR green real-time master. The following primers were used: Tet1F: 5′-GAGCCTGTTCCTCGATGTGG-3′, Tet1R: 5′-CAAACCCACCTGAGGCTGTT-3′, Tet2F: 5′-AACCTGGCTACTGTCATTGCTCCA-3′, Tet2R: 5′-ATGTTCTGCTGGTCTCTGTGGGAA-3′; Tet3F: 5′-GTCT CCCCAGTCCTACCTCCG-3′, Tet3R: 5′-GTCAGTGCCCCACGCTTCA-3′
Analysis of CMS (bisulfite-converted 5hmC) abundance by dot blot
100 ng genomic DNA samples were sheared using needle and treated with sodium bisulfite using the Methylcode bisulfite kit (Invitrogen). DNA was prepared using twofold serial dilutions in TE buffer and then denatured in 0.4 M NaOH, 10mM EDTA at 95 °C for 10 min and followed by adding an equal volume of cold 2M ammonium acetate (pH 7.0) on ice for 10 min. Denatured DNA samples were spotted on a nitrocellulose membrane in an assembled Bio-Dot apparatus (Bio-Rad) according to the manufacturer’s instructions. The membrane was washed with 2 × SSC buffer and then vacuum-baked at 80 °C for 2 h. Then the membrane was blocked with 5% non-fat milk for 1 h and incubated with rabbit antisera against CMS detected by HRP conjugated secondary antibody and enhanced chemiluminescence.
Statistical Analysis
Statistical analysis was performed with GraphPAd Prism6 (Graphpad software). Unpaired t test, Log-rank (Mantel-Cox) test and Gehan-Brenslow-Wilcoxon test were applied as indicated and the P-values are shown for each figure. Data are mean ± s.e.m. If not otherwise indicated the P value was not statistically significant (P > 0.05). In the graphs each dot represents a mouse. For all the experiments we used sufficient number of mice to ensure adequate power for our conclusions. Mice from different litters and of different sex were evaluated. In addition, we ensured that a minimum of 2 independent experiments was performed in each case. No blinding was applied in this study.
Data availability
Data that support the findings of this study have been deposited in GEO with the accession code GSE66834. Source data for Figures 3–7 are provided with the paper.
Supplementary Material
Acknowledgments
We thank C. Kim, K. van Gunst, L. Nosworthy, D. Hinz and R. Simmons at the LJI Flow Cytometry Core for help with fluorescence-activated cell sorting; G. Seumois and J. Day at the LJI Functional Genomics Center for assistance with next-generation sequencing (Illumina HiSeq 2500); M. Kronenberg, I. Engel and C.-W. Lio (LJI) for discussions, the LJI Bioinformatics Core for routine analysis; Z. Mikulski and B. Kiosses at the LJI microscopy core, M. Chadwell at the LJI Histology core, and the Histology Core at the University of California at San Diego Moores Cancer Center; and R. Bosselut (National Cancer Institute) for pMX-ThPOK-IRES-GFP. Supported by US National Institutes of Health (R01 AI44432, CA151535 and R35CA210043), the Leukemia and Lymphoma Society (Translation Research Project grant 6187-12 to A.R.), the Academy of Finland Centre of Excellence in Molecular Systems Immunology and Physiology Research (H.L. and. S.R.), an Albert Billings Ruddock Professorship at Caltech (E.V.R.), the Cancer Research Institute (Irvington Institute postdoctoral fellowship to A.T.), the Fraternal Order of Eagles Fellow of the Damon Runyon Cancer Research Foundation (DRG-2069-11 to J.P.S.-B.) and the National Science Foundation (W.A.P.).
Footnotes
Note: Any Supplementary Information and Source Data files are available in the online version of the paper.
AUTHOR CONTRIBUTIONS
A.R. and A.T. designed the study; A.T. performed all of the experiments, and A.R. and A.T. wrote the manuscript. E.G.-A. analyzed WGBS and ATAC-seq data sets under the supervision of L.C. and J.P.S.-B., respectively. S.R. analyzed RNA-seq and CMS-IP data sets under the supervision of H.L. S.T. helped with in vivo adoptive transfer experiments. W.A.P. generated the Tet3fl/fl mice. E.V.R. provided critical input and suggestions during the course of this study and helped write the manuscript.
COMPETING FINANCIAL INTERESTS
The authors declare no competing financial interests.
References
- 1.Yui MA, Rothenberg EV. Developmental gene networks: a triathlon on the course to T cell identity. Nat Rev Immunol. 2014;14:529–545. doi: 10.1038/nri3702. [DOI] [PMC free article] [PubMed] [Google Scholar]
- 2.Carpenter AC, Bosselut R. Decision checkpoints in the thymus. Nat Immunol. 2010;11:666–673. doi: 10.1038/ni.1887. [DOI] [PMC free article] [PubMed] [Google Scholar]
- 3.Bendelac A, Savage PB, Teyton L. The biology of NKT cells. Annu Rev Immunol. 2007;25:297–336. doi: 10.1146/annurev.immunol.25.022106.141711. [DOI] [PubMed] [Google Scholar]
- 4.Vahedi G, et al. Helper T-cell identity and evolution of differential transcriptomes and epigenomes. Immunol Rev. 2013;252:24–40. doi: 10.1111/imr.12037. [DOI] [PMC free article] [PubMed] [Google Scholar]
- 5.Hogquist KA, Jameson SC. The self-obsession of T cells: how TCR signaling thresholds affect fate ‘decisions’ and effector function. Nat Immunol. 2014;15:815–823. doi: 10.1038/ni.2938. [DOI] [PMC free article] [PubMed] [Google Scholar]
- 6.Lee YJ, Holzapfel KL, Zhu J, Jameson SC, Hogquist KA. Steady-state production of IL-4 modulates immunity in mouse strains and is determined by lineage diversity of iNKT cells. Nat Immunol. 2013;14:1146–1154. doi: 10.1038/ni.2731. [DOI] [PMC free article] [PubMed] [Google Scholar]
- 7.Winter DR, Amit I. The role of chromatin dynamics in immune cell development. Immunol Rev. 2014;261:9–22. doi: 10.1111/imr.12200. [DOI] [PubMed] [Google Scholar]
- 8.Smith ZD, Meissner A. DNA methylation: roles in mammalian development. Nat Rev Genet. 2013;14:204–220. doi: 10.1038/nrg3354. [DOI] [PubMed] [Google Scholar]
- 9.Tahiliani M, et al. Conversion of 5-methylcytosine to 5-hydroxymethylcytosine in mammalian DNA by MLL partner TET1. Science. 2009;324:930–935. doi: 10.1126/science.1170116. [DOI] [PMC free article] [PubMed] [Google Scholar]
- 10.Ito S, et al. Tet proteins can convert 5-methylcytosine to 5-formylcytosine and 5-carboxylcytosine. Science. 2011;333:1300–1303. doi: 10.1126/science.1210597. [DOI] [PMC free article] [PubMed] [Google Scholar]
- 11.He YF, et al. Tet-mediated formation of 5-carboxylcytosine and its excision by TDG in mammalian DNA. Science. 2011;333:1303–1307. doi: 10.1126/science.1210944. [DOI] [PMC free article] [PubMed] [Google Scholar]
- 12.Pastor WA, Aravind L, Rao A. TETonic shift: biological roles of TET proteins in DNA demethylation and transcription. Nat Rev Mol Cell Biol. 2013;14:341–356. doi: 10.1038/nrm3589. [DOI] [PMC free article] [PubMed] [Google Scholar]
- 13.Tsagaratou A, et al. Dissecting the dynamic changes of 5-hydroxymethylcytosine in T-cell development and differentiation. Proc Natl Acad Sci USA. 2014;111:E3306–E3315. doi: 10.1073/pnas.1412327111. [DOI] [PMC free article] [PubMed] [Google Scholar]
- 14.Ko M, et al. Impaired hydroxylation of 5-methylcytosine in myeloid cancers with mutant TET2. Nature. 2010;468:839–843. doi: 10.1038/nature09586. [DOI] [PMC free article] [PubMed] [Google Scholar]
- 15.Ko M, et al. Ten-Eleven-Translocation 2 (TET2) negatively regulates homeostasis and differentiation of hematopoietic stem cells in mice. Proc Natl Acad Sci USA. 2011;108:14566–14571. doi: 10.1073/pnas.1112317108. [DOI] [PMC free article] [PubMed] [Google Scholar]
- 16.Gu TP, et al. The role of Tet3 DNA dioxygenase in epigenetic reprogramming by oocytes. Nature. 2011;477:606–610. doi: 10.1038/nature10443. [DOI] [PubMed] [Google Scholar]
- 17.Lee YJ, Jameson SC, Hogquist KA. Alternative memory in the CD8 T cell lineage. Trends Immunol. 2011;32:50–56. doi: 10.1016/j.it.2010.12.004. [DOI] [PMC free article] [PubMed] [Google Scholar]
- 18.Engel I, et al. Innate-like functions of natural killer T cell subsets result from highly divergent gene programs. Nat Immunol. 2016;17:728–739. doi: 10.1038/ni.3437. [DOI] [PMC free article] [PubMed] [Google Scholar]
- 19.Yu S, et al. The TCF-1 and LEF-1 transcription factors have cooperative and opposing roles in T cell development and malignancy. Immunity. 2012;37:813–826. doi: 10.1016/j.immuni.2012.08.009. [DOI] [PMC free article] [PubMed] [Google Scholar]
- 20.Karo JM, Schatz DG, Sun JC. The RAG recombinase dictates functional heterogeneity and cellular fitness in natural killer cells. Cell. 2014;159:94–107. doi: 10.1016/j.cell.2014.08.026. [DOI] [PMC free article] [PubMed] [Google Scholar]
- 21.Matthews JM, Lester K, Joseph S, Curtis DJ. LIM-domain-only proteins in cancer. Nat Rev Cancer. 2013;13:111–122. doi: 10.1038/nrc3418. [DOI] [PubMed] [Google Scholar]
- 22.Ramsay RG, Gonda TJ. MYB function in normal and cancer cells. Nat Rev Cancer. 2008;8:523–534. doi: 10.1038/nrc2439. [DOI] [PubMed] [Google Scholar]
- 23.Uddin MN, et al. Transcription factor Bcl11b sustains iNKT1 and iNKT2 cell programs, restricts iNKT17 cell program, and governs iNKT cell survival. Proc Natl Acad Sci USA. 2016;113:7608–7613. doi: 10.1073/pnas.1521846113. [DOI] [PMC free article] [PubMed] [Google Scholar]
- 24.Mathew R, et al. BTB-ZF factors recruit the E3 ligase cullin 3 to regulate lymphoid effector programs. Nature. 2012;491:618–621. doi: 10.1038/nature11548. [DOI] [PMC free article] [PubMed] [Google Scholar]
- 25.Dose M, et al. Intrathymic proliferation wave essential for Valpha14+ natural killer T cell development depends on c-Myc. Proc Natl Acad Sci USA. 2009;106:8641–8646. doi: 10.1073/pnas.0812255106. [DOI] [PMC free article] [PubMed] [Google Scholar]
- 26.Carr T, et al. The transcription factor lymphoid enhancer factor 1 controls invariant natural killer T cell expansion and TH2-type effector differentiation. J Exp Med. 2015;212:793–807. doi: 10.1084/jem.20141849. [DOI] [PMC free article] [PubMed] [Google Scholar]
- 27.Yue X, et al. Control of Foxp3 stability through modulation of TET activity. J Exp Med. 2016;213:377–397. doi: 10.1084/jem.20151438. [DOI] [PMC free article] [PubMed] [Google Scholar]
- 28.Wolf E, Lin CY, Eilers M, Levens DL. Taming of the beast: shaping Myc-dependent amplification. Trends Cell Biol. 2014;25:241–248. doi: 10.1016/j.tcb.2014.10.006. [DOI] [PMC free article] [PubMed] [Google Scholar]
- 29.Lee YJ, et al. Lineage-specific effector signatures of invariant NKT cells are shared amongst γδ T, innate lymphoid, and TH cells. J Immunol. 2016;197:1460–1470. doi: 10.4049/jimmunol.1600643. [DOI] [PMC free article] [PubMed] [Google Scholar]
- 30.Fonseca-Pereira D, et al. The neurotrophic factor receptor RET drives haematopoietic stem cell survival and function. Nature. 2014;514:98–101. doi: 10.1038/nature13498. [DOI] [PubMed] [Google Scholar]
- 31.Huang Y, Pastor WA, Zepeda-Martínez JA, Rao A. The anti-CMS technique for genome-wide mapping of 5-hydroxymethylcytosine. Nat Protoc. 2012;7:1897–1908. doi: 10.1038/nprot.2012.103. [DOI] [PMC free article] [PubMed] [Google Scholar]
- 32.Pastor WA, et al. Genome-wide mapping of 5-hydroxymethylcytosine in embryonic stem cells. Nature. 2011;473:394–397. doi: 10.1038/nature10102. [DOI] [PMC free article] [PubMed] [Google Scholar]
- 33.Laurent L, et al. Dynamic changes in the human methylome during differentiation. Genome Res. 2010;20:320–331. doi: 10.1101/gr.101907.109. [DOI] [PMC free article] [PubMed] [Google Scholar]
- 34.Shen Y, et al. A map of the cis-regulatory sequences in the mouse genome. Nature. 2012;488:116–120. doi: 10.1038/nature11243. [DOI] [PMC free article] [PubMed] [Google Scholar]
- 35.An J, et al. Acute loss of TET function results in aggressive myeloid cancer in mice. Nat Commun. 2015;6:10071. doi: 10.1038/ncomms10071. [DOI] [PMC free article] [PubMed] [Google Scholar]
- 36.Kieffer-Kwon KR, et al. Interactome maps of mouse gene regulatory domains reveal basic principles of transcriptional regulation. Cell. 2013;155:1507–1520. doi: 10.1016/j.cell.2013.11.039. [DOI] [PMC free article] [PubMed] [Google Scholar]
- 37.Lara-Astiaso D, et al. Immunogenetics. chromatin state dynamics during blood formation. Science. 2014;345:943–949. doi: 10.1126/science.1256271. [DOI] [PMC free article] [PubMed] [Google Scholar]
- 38.Buenrostro JD, Giresi PG, Zaba LC, Chang HY, Greenleaf WJ. Transposition of native chromatin for fast and sensitive epigenomic profiling of open chromatin, DNA-binding proteins and nucleosome position. Nat Methods. 2013;10:1213–1218. doi: 10.1038/nmeth.2688. [DOI] [PMC free article] [PubMed] [Google Scholar]
- 39.Jeong M, et al. Large conserved domains of low DNA methylation maintained by Dnmt3a. Nat Genet. 2014;46:17–23. doi: 10.1038/ng.2836. [DOI] [PMC free article] [PubMed] [Google Scholar]
- 40.Townsend MJ, et al. T-bet regulates the terminal maturation and homeostasis of NK and Valpha14i NKT cells. Immunity. 2004;20:477–494. doi: 10.1016/s1074-7613(04)00076-7. [DOI] [PubMed] [Google Scholar]
- 41.Engel I, Zhao M, Kappes D, Taniuchi I, Kronenberg M. The transcription factor Th-POK negatively regulates TH17 differentiation in Vα14i NKT cells. Blood. 2012;120:4524–4532. doi: 10.1182/blood-2012-01-406280. [DOI] [PMC free article] [PubMed] [Google Scholar]
- 42.Stritesky GL, Jameson SC, Hogquist KA. Selection of self-reactive T cells in the thymus. Annu Rev Immunol. 2012;30:95–114. doi: 10.1146/annurev-immunol-020711-075035. [DOI] [PMC free article] [PubMed] [Google Scholar]
- 43.Dobenecker MW, et al. Coupling of T cell receptor specificity to natural killer T cell development by bivalent histone H3 methylation. J Exp Med. 2015;212:297–306. doi: 10.1084/jem.20141499. [DOI] [PMC free article] [PubMed] [Google Scholar]
- 44.Pereira RM, et al. Jarid2 is induced by TCR signaling and controls iNKT cell maturation. Nat Commun. 2014;5:4540. doi: 10.1038/ncomms5540. [DOI] [PMC free article] [PubMed] [Google Scholar]
- 45.Rasmussen KD, Helin K. Role of TET enzymes in DNA methylation, development, and cancer. Genes Dev. 2016;30:733–750. doi: 10.1101/gad.276568.115. [DOI] [PMC free article] [PubMed] [Google Scholar]
- 46.Ichiyama K, et al. The methylcytosine dioxygenase Tet2 promotes DNA demethylation and activation of cytokine gene expression in T cells. Immunity. 2015;42:613–626. doi: 10.1016/j.immuni.2015.03.005. [DOI] [PMC free article] [PubMed] [Google Scholar]
- 47.Sasidharan Nair V, Song MH, Oh KI. Vitamin C facilitates demethylation of the Foxp3 enhancer in a Tet-dependent manner. J Immunol. 2016;196:2119–2131. doi: 10.4049/jimmunol.1502352. [DOI] [PubMed] [Google Scholar]
- 48.Huang Y, et al. Distinct roles of the methylcytosine oxidases Tet1 and Tet2 in mouse embryonic stem cells. Proc Natl Acad Sci USA. 2014;111:1361–1366. doi: 10.1073/pnas.1322921111. [DOI] [PMC free article] [PubMed] [Google Scholar]
- 49.Ko M, et al. TET proteins and 5-methylcytosine oxidation in hematological cancers. Immunol Rev. 2015;263:6–21. doi: 10.1111/imr.12239. [DOI] [PMC free article] [PubMed] [Google Scholar]
- 50.Lee PP, et al. A critical role for Dnmt1 and DNA methylation in T cell development, function, and survival. Immunity. 2001;15:763–774. doi: 10.1016/s1074-7613(01)00227-8. [DOI] [PubMed] [Google Scholar]
- 51.Heinen AP, et al. Improved method to retain cytosolic reporter protein fluorescence while staining for nuclear proteins. Cytometry A. 2014;85:621–627. doi: 10.1002/cyto.a.22451. [DOI] [PubMed] [Google Scholar]
- 52.Djuretic IM, et al. Transcription factors T-bet and Runx3 cooperate to activate Ifng and silence Il4 in T helper type 1 cells. Nat Immunol. 2007;8:145–153. doi: 10.1038/ni1424. [DOI] [PubMed] [Google Scholar]
- 53.Picelli S, et al. Full-length RNA-seq from single cells using Smart-seq2. Nat Protoc. 2014;9:171–181. doi: 10.1038/nprot.2014.006. [DOI] [PubMed] [Google Scholar]
- 54.Huang Y, et al. The behaviour of 5-hydroxymethylcytosine in bisulfite sequencing. PLoS One. 2010;5:e8888. doi: 10.1371/journal.pone.0008888. [DOI] [PMC free article] [PubMed] [Google Scholar]
- 55.Tsagaratou A, Rao A. TET proteins and 5-methylcytosine oxidation in the immune system. Cold Spring Harb Symp Quant Biol. 2013;78:1–10. doi: 10.1101/sqb.2013.78.020248. [DOI] [PMC free article] [PubMed] [Google Scholar]
Associated Data
This section collects any data citations, data availability statements, or supplementary materials included in this article.
Supplementary Materials
Data Availability Statement
Data that support the findings of this study have been deposited in GEO with the accession code GSE66834. Source data for Figures 3–7 are provided with the paper.