ABSTRACT
GATA1 is a critical regulator of erythropoiesis. While the mechanisms underlying the high-level expression of GATA1 in maturing erythroid cells have been studied extensively, the initial activation of the Gata1 gene in early hematopoietic progenitors remains to be elucidated. We previously identified a hematopoietic stem and progenitor cell (HSPC)-specific silencer element (the Gata1 methylation-determining region [G1MDR]) that recruits DNA methyltransferase 1 (Dnmt1) and provokes methylation of the Gata1 gene enhancer. In the present study, we hypothesized that removal of the G1MDR-mediated silencing machinery is the molecular basis of the initial activation of the Gata1 gene and erythropoiesis. To address this hypothesis, we generated transgenic mouse lines harboring a Gata1 bacterial artificial chromosome in which the G1MDR was deleted. The mice exhibited abundant GATA1 expression in HSPCs, in a GATA2-dependent manner. The ectopic GATA1 expression repressed Gata2 transcription and induced erythropoiesis and apoptosis of HSPCs. Furthermore, genetic deletion of Dnmt1 in HSPCs activated Gata1 expression and depleted HSPCs, thus recapitulating the HSC phenotype associated with GATA1 gain of function. These results demonstrate that the G1MDR holds the key to HSPC maintenance and suggest that release from this suppressive mechanism is a fundamental requirement for subsequent initiation of erythroid differentiation.
KEYWORDS: Gata1 gene regulation, hematopoietic stem and progenitor cell, erythropoiesis
INTRODUCTION
The transcription factor GATA1 plays a key role in erythroid and megakaryocytic cell differentiation and in the differentiation of basophilic, eosinophilic, and mast cell lineages (1–8). For erythroid differentiation, GATA1 expression increases in stages, from common myeloid progenitors (CMPs) to megakaryocyte-erythroid progenitors (MEPs), and reaches a peak at the proerythroblast (ProEB) stage (9, 10). Earlier studies identified a series of cis-acting regulatory elements within the Gata1 gene that participate in the elaborate transcriptional regulation of the gene (11, 12). Based on both in vivo and in vitro studies, Gata1 gene expression during erythropoiesis has been reported to require promoter-proximal CACCC motifs, a palindromic double-GATA motif (dbG) approximately 650 bp upstream of the transcription start site (TSS), and a GATA motif in the Gata1 hematopoietic enhancer (G1HE), 3.7 kb upstream of the TSS (10, 13–15).
GATA2 is abundantly expressed in hematopoietic stem and progenitor cells (HSPCs) (16–22). During commitment to the erythroid-megakaryocytic lineages, GATA2 acts to induce Gata1 gene expression, while at the same time, the enhanced level of GATA1 represses Gata2 gene expression. This exchange of GATA2 for GATA1 has been referred to as GATA factor switching (23–28). One intriguing observation is that while GATA2 is abundantly expressed in HSPCs, the Gata1 gene is expressed only at a low level. This observation suggests that a certain predominantly repressive mechanism controls the transcription of the Gata1 gene in HSPCs. In this regard, we previously identified a cis-acting silencer element located between the G1HE and dbG elements that may play a pivotal role in Gata1 gene repression in HSPCs. We also found that DNA methyltransferase 1 (Dnmt1) is recruited to the element and participates in Gata1 gene methylation (29). We refer to this silencer element as the Gata1 methylation-determining region (G1MDR).
While the mechanisms maintaining the high level of Gata1 expression in maturing erythroid lineage cells have been studied extensively, the initial activation of the Gata1 gene in early hematopoietic progenitors remains to be fully understood. As mentioned above, in HSPCs, Gata1 expression is repressed to a very low level, even in the presence of abundant GATA2. In light of the GATA factor switching mechanism, we surmise that certain cues that release the Gata1 gene from the silencing machinery may serve as the central mechanism that initiates Gata1 gene activation. In this regard, several lines of evidence are worthy of attention. First, Dnmt1 is strongly recruited to the G1MDR to maintain DNA methylation of the Gata1 locus in HSPCs, and deletion of the G1MDR selectively abrogates Gata1 gene repression in HSPCs, which is associated with an increase of GATA2 occupancy in the Gata1 gene enhancer (29). Second, demethylation of the Gata1 enhancer and promoter around the G1MDR is associated with the enhancement of gene expression during erythropoiesis (29). Based on these observations, we hypothesized that derepression of Dnmt1-G1MDR-mediated repression is the key molecular mechanism that triggers the initial activation of Gata1 gene expression in HSPCs, which subsequently leads HSPCs to differentiate toward the erythroid lineage.
To address this hypothesis, we generated three transgenic mouse lines that carry modified Gata1 bacterial artificial chromosome (BAC) DNAs in which the G1MDR was deleted to express either wild-type GATA1, a GATA1-estrogen receptor fusion protein (G1ERT2), or a Cre-estrogen receptor fusion protein (CreERT2) in HSPCs. The mouse lines harboring these constructs individually are referred to as MG-G1, MG-G1ERT2, and MG-CreERT2, for minigene-Gata1, minigene-Gata1ERT2, and minigene-CreERT2, respectively. We found that MG-G1 and MG-G1ERT2 transgenic mice exhibited aberrant Gata1 gene expression in HSPCs, in a GATA2-dependent manner. The release of Gata1 from repressive regulation by means of this strategy provoked skewed hematopoiesis toward erythroid differentiation and concomitantly induced HSPC apoptosis. Importantly, the genetic deletion of Dnmt1 in HSPCs in MG-CreERT2 mice activated Gata1 gene expression and recapitulated the hematopoietic phenotype of MG-G1 and MG-G1ERT2 transgenic mice. Taken together, these results demonstrate that the Dnmt1-G1MDR complex plays a key role in the repression of the Gata1 gene for HSPC maintenance and suggest that release from this repression is critical for subsequent Gata1 gene activation for erythroid commitment and differentiation.
RESULTS
G1MDR-mediated Gata1 repression is crucial for hematopoietic homeostasis and perinatal survival.
To address the consequences of release from G1MDR-mediated Gata1 gene repression in HSPCs on subsequent hematopoietic differentiation, we generated a transgenic mouse line (MG-G1) carrying a Gata1 BAC that retained a Gata1 minigene lacking the G1MDR (Fig. 1A). Because the deletion of the G1MDR abrogated Gata1 repression in HSPCs (29), the MG-G1 transgenic mice had a 3.3-fold higher level of Gata1 mRNA in the fetal liver Lin− Sca1+ c-Kit+ (LSK) fraction (representing HSPCs) than that for the comparable wild-type LSK cells (Fig. 1B). We found that all MG-G1 embryos exhibited severe anemia at embryonic day 17.5 (E17.5) (Fig. 1C).
FIG 1.
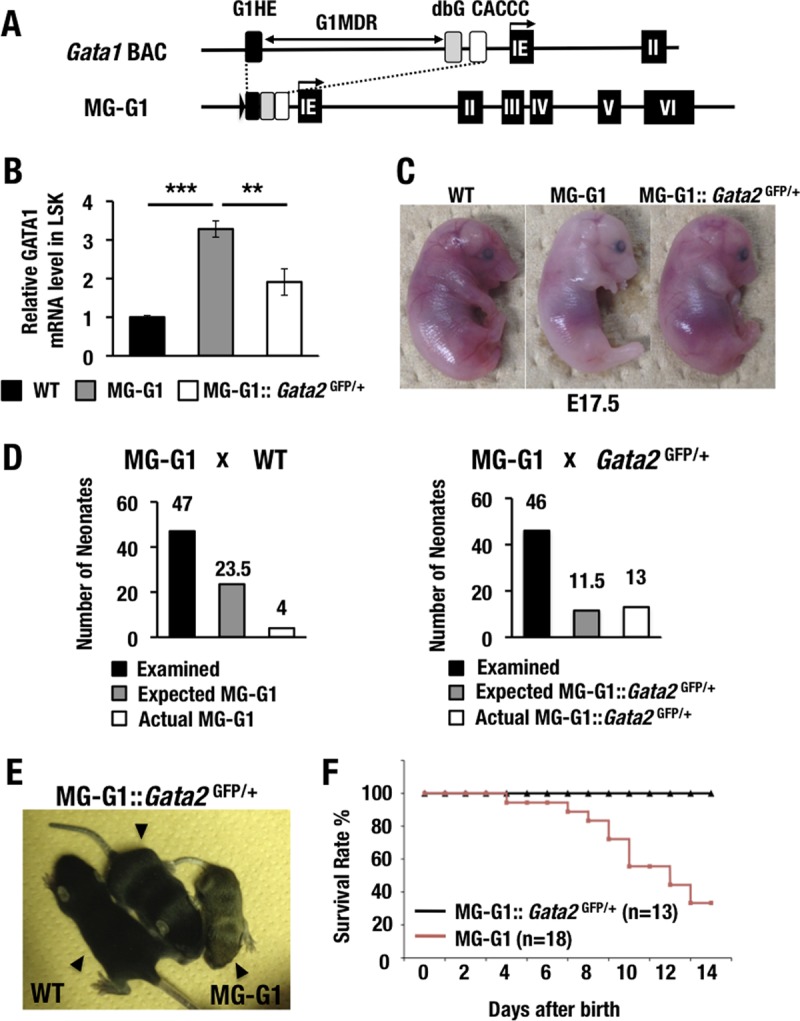
GATA2 transactivates GATA1 in the HSPCs of MG-G1 mice, and haploid insufficiency of the Gata2 gene rescues MG-G1 mice from perinatal lethality. (A) Structure of MG-G1 BAC DNA. The G1MDR sequence was deleted in the context of Gata1 BAC DNA. The three regulatory elements of the Gata1 gene, shown as black (G1HE), gray (dbG), and white (CACCC) rectangles, were combined to generate MG-G1. IE, erythroid cell-specific 1st exon of the Gata1 gene. (B) Gata1 mRNA levels in LSK cells from E14.5 livers. Note that MG-G1 embryos showed 3.3-fold more Gata1 mRNA but that the increase was abrogated by Gata2 haploid insufficiency. WT, wild type. (C) Pale appearance of an MG-G1 embryo compared to that of a wild-type littermate embryo at E17.5. The anemic appearance was rescued by the reduction of GATA2 abundance. (D) Genotyping results for neonates born from crosses of MG-G1 and wild-type mice (left) or MG-G1 and Gata2GFP/+ mice (right). The total numbers of neonates examined, the Mendelian expected numbers, and the actual numbers of neonates born alive are shown. (E) Retarded growth of MG-G1 neonates was rescued by Gata2 haploid insufficiency. (F) Kaplan-Meier survival curves for MG-G1 and MG-G1::Gata2GFP/+ mice after birth. The numbers of mice examined in this cohort were 18 and 13 for MG-G1 and MG-G1::Gata2GFP/+ mice, respectively. Data shown are the means ± SD for three mice. **, P < 0.01; ***, P < 0.001 (unpaired Student's t test).
In our initial experiment, we crossed MG-G1 male mice with wild-type female mice and recovered 47 neonates with live births. However, we identified only four MG-G1 transgenic neonates among these 47 live births, which was far fewer than expected from the Mendelian frequency (Fig. 1D, left panel). We repeated this experiment on a larger scale (n = 18 MG-G1 mice) and found that successfully delivered MG-G1 mice showed severe growth retardation (Fig. 1E). Approximately 70% of the MG-G1 neonates died of anemia within 2 weeks of birth (Fig. 1F). Taken together, these data indicate that G1MDR-mediated Gata1 gene repression in HSPCs is crucial for the maintenance of HSPC homeostasis in the fetal mouse liver.
Haploid Gata2 deletion rescues MG-G1 mice from lethality.
Since it has been shown that GATA2 activates Gata1 expression in erythroid and megakaryocytic progenitors (30), we were interested in the relationship between G1MDR-mediated repression and GATA2-mediated activation of Gata1 gene expression in HSPCs. In this regard, we previously demonstrated that GATA2 occupancy at the critical Gata1 gene enhancer and upstream regulatory element in the proximity of the G1MDR (i.e., G1HE and dbG, respectively) is significantly increased in HSPCs when the G1MDR is deleted (29). Therefore, one plausible possibility is that upon removal of G1MDR-mediated repression, GATA2 binds to Gata1 and activates Gata1 gene expression.
To address this possibility, we next crossed MG-G1 mice with Gata2GFP/+ mice that heterozygously lacked Gata2 expression (16). As expected, the Gata2 haploid deletion significantly reduced the MG-G1-directed GATA1 expression in the fetal liver LSK fraction (Fig. 1B). In agreement with the reduction of GATA1 expression, the anemic appearance of MG-G1 E17.5 embryos was nicely rescued by the Gata2 haploid insufficiency (Fig. 1C, right panel), and the live birth rate of MG-G1 pups was significantly improved. In fact, 13 MG-G1::Gata2GFP/+ pups were born among 46 littermates (28.3%) from the intercross between MG-G1 and Gata2GFP/+ mice, which is close to the expected ratio from Mendelian frequency analysis (Fig. 1D, right panel). The size of the 12-day-old MG-G1::Gata2GFP/+ pups was comparable to that of their wild-type littermates, while the MG-G1 littermates exhibited a small body size (Fig. 1E, middle mouse). A Kaplan-Meier analysis demonstrated that the postnatal survival rate of the MG-G1::Gata2GFP/+ mice was also rescued to a normal level (Fig. 1F). These results indicate that GATA2-mediated activation of Gata1 gene expression is elaborately counterbalanced by the G1MDR-mediated repression of gene expression in HSPCs. We surmised that removal of G1MDR-mediated repression or demethylation of the G1MDR triggers the GATA2-mediated transcriptional activation of the Gata1 gene.
Derepression of Gata1 results in HSPC depletion and enhanced erythropoiesis.
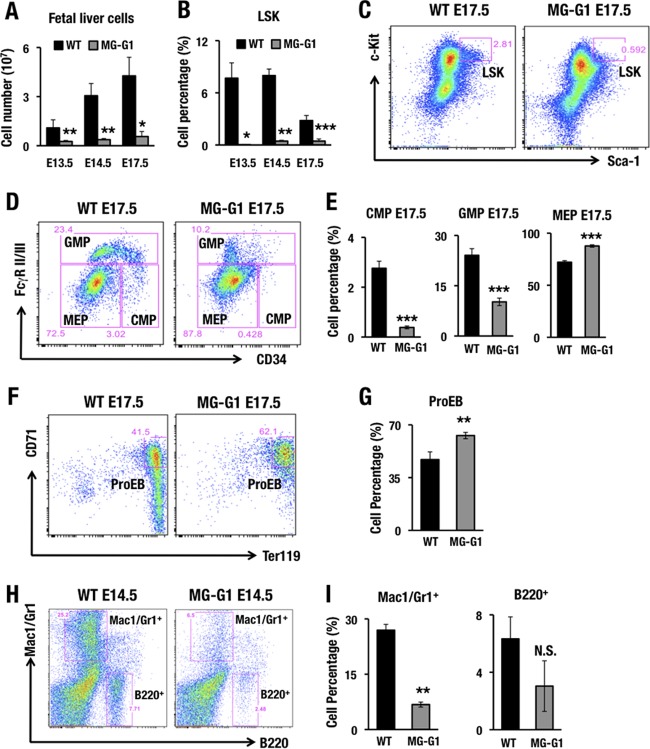
As the perinatal lethality precluded closer analyses of adult MG-G1 mice, we examined fetal liver cells for the phenotypes of hematopoietic differentiation. We found that MG-G1 embryos exhibited a severe reduction of fetal liver cellularity from E13.5 to E17.5 (Fig. 2A). Flow cytometry of the fetal liver cells demonstrated that the percentages of LSK cells (Fig. 2B and C), CMPs, and granulocyte-monocyte progenitors (GMPs) (Fig. 2D and E) were significantly decreased, while the percentages of MEPs (Fig. 2D and E) and ProEBs (Fig. 2F and G) were slightly increased. The percentages of Mac1/Gr1+ myeloid and B220+ B-lymphocytic cells were also lower (Fig. 2H and I). These results demonstrate that release from G1MDR-mediated repression induced GATA1 expression in HSPCs, which directed their differentiation toward erythroid lineages, at the expense of myeloid and lymphoid differentiation, and induced depletion of HSPCs in the fetal liver.
FIG 2.
MG-G1 BAC transgenic mice exhibit enhanced erythropoiesis and HSPC depletion during the embryonic stage. (A) Fetal liver cellularity in E13.5, E14.5, and E17.5 embryos. Note that MG-G1 fetal livers showed a significant reduction in the hematopoietic cell population compared to that in wild-type fetal livers. (B) Percentages of LSK cells in E13.5, E14.5, and E17.5 fetal livers of MG-G1 and littermate control embryos. (C and D) Flow cytometry analysis of LSK cell (C) and progenitor (D) fractions. (E) CMP, GMP, and MEP percentages in E17.5 fetal livers of MG-G1 and littermate control embryos. (F) Flow cytometry analysis of proerythroblasts from WT and MG-G1 E17.5 fetal livers. (G) Percentages of CD71+ Ter119+ proerythroblasts in E17.5 livers. (H) Flow cytometry analysis of Mac1/Gr1+ and B220+ cells from WT and MG-G1 E14.5 fetal livers. (I) Percentages of Mac1/Gr1+ and B220+ cells. Data shown are the means ± SD for three to six mice. *, P < 0.05; **, P < 0.01; ***, P < 0.001 (unpaired Student's t test). N.S., not significant.
Ectopic GATA1 expression exhausts the HSC population and skews differentiation toward the erythroid lineage.
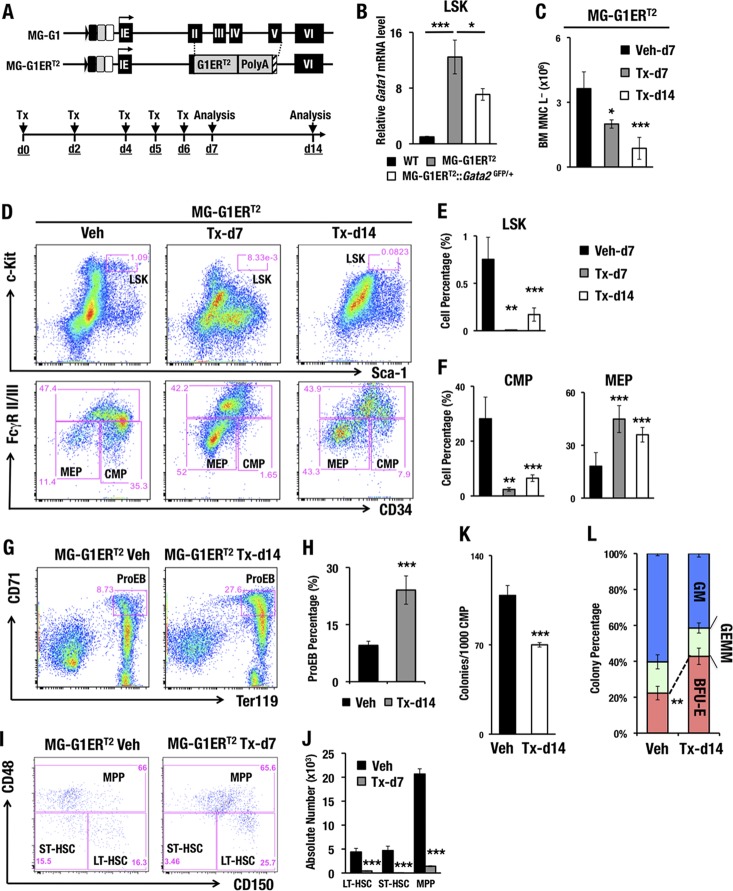
As the lethality of the MG-G1 embryos largely obscured the analysis of adult hematopoiesis, we generated another line of G1MDR-deleted mice to circumvent this difficulty. To this end, we generated a new mouse line harboring a tamoxifen-inducible GATA1-ERT2 fusion protein expressed under the regulation of the Gata1 MG-G1 BAC (MG-G1ERT2) (Fig. 3A). The MG-G1ERT2 transgenic mice had a 12-fold higher level of Gata1 mRNA in adult bone marrow LSK cells than that in wild-type control LSK cells in the absence of tamoxifen (Fig. 3B). In contrast, the Gata2 haploid insufficiency significantly reduced GATA1 expression (Fig. 3B), supporting the notion that transcription of the Gata1 gene in the MG-G1ERT2 construct is also dependent on the abundance of GATA2. Importantly, without tamoxifen administration, there was no difference in the LSK cell populations between MG-G1ERT2 and wild-type mice, indicating that the estrogen receptor (ER) in the GATA1-ERT2 fusion protein in MG-G1ERT2 mice was intact and not leaky (data not shown).
FIG 3.
Increased erythropoiesis and HSPC depletion in the adult bone marrows of MG-G1ERT2 mice upon tamoxifen treatment. (A) Structure of the MG-G1ERT2 BAC transgenic construct. The G1ERT2 fusion cDNA was integrated by homologously replacing the 2nd to 5th exons of the Gata1 gene in the MG-G1 BAC DNA. (Top) Transgenic mice were generated using the MG-G1ERT2 BAC construct. (Bottom) Tamoxifen (Tx) was injected intraperitoneally into the mice on days 0, 2, 4, 5, and 6. The analysis was performed on days 7 and 14. (B) Gata1 mRNA levels in LSK cells from WT, MG-G1ERT2, and MG-G1ERT2::Gata2GFP/+ bone marrows from adult mice without tamoxifen treatments. (C) Number of bone marrow lineage-negative mononuclear cells (BM MNC L−) in vehicle (Veh)- or tamoxifen-treated MG-G1ERT2 mice at day 7 or 14. (D) Flow cytometry analysis of LSK cells (upper panels) and progenitors (lower panels) in MG-G1ERT2 mice treated with vehicle (left) or with tamoxifen for 7 days (middle) or 14 days (right). (E and F) Percentages of LSK cell (E) and CMP and MEP (F) populations. Note that after tamoxifen treatment, the percentages of LSK cells and CMPs were significantly reduced, while that of MEP was increased. (G) Flow cytometry analysis of proerythroblasts from MG-G1ERT2 mouse bone marrow 14 days after vehicle or tamoxifen treatment. (H) Percentages of CD71+ Ter119+ proerythroblast cells. (I) LT-HSC, ST-HSC, and MPP populations were separated by means of flow cytometry from LSK-gated adult bone marrow cells from MG-G1ERT2 mice 7 days after vehicle (left) or tamoxifen (right) treatment. (J) Absolute numbers of the LT-HSC, ST-HSC, and MPP subsets. Note the significant decreases in LT-HSC, ST-HSC, and MPP populations in LSK-gated MG-G1ERT2 mouse bone marrow cells. (K and L) Colony number per 1,000 CMP cells (K) and percentages of CFU-GM, CFU-GEMM, and BFU-E colonies (L) from vehicle- or tamoxifen-treated MG-G1ERT2 mice. Data shown are the means ± SD for three to seven mice. *, P < 0.05; **, P < 0.01; ***, P < 0.001 (unpaired Student's t test).
To induce the GATA1 activity of GATA1-ERT2, we injected tamoxifen intraperitoneally five times and analyzed bone marrow cells 7 and 14 days after the first tamoxifen administration (Fig. 3A). MG-G1ERT2 mice with vehicle administration were used as the control. We found that the number of lineage-negative bone marrow mononuclear (BM MNC L−) cells, which includes HSPCs, gradually diminished after the tamoxifen treatment (Fig. 3C). For each of the HSC and hematopoietic progenitor fractions, the MG-G1ERT2 mice showed dramatic reductions in the percentages of LSK and CMP cells following tamoxifen treatment (Fig. 3D to F). In contrast, the percentages of MEPs and ProEBs in the MG-G1ERT2 mice were significantly increased after tamoxifen administration (Fig. 3D and F to H).
The LSK fraction is known to represent a heterogeneous cell population containing long-term HSCs (LT-HSCs; CD150+ CD48−), short-term HSCs (ST-HSCs; CD150− CD48−), and multipotent progenitors (MPPs; CD48+) (31). The percentage of LT-HSCs was increased, while that of ST-HSCs was decreased, within the LSK fraction of the tamoxifen-treated MG-G1ERT2 bone marrow cells (day 7) (Fig. 3I). More remarkably, the absolute numbers of LT-HSCs, ST-HSCs, and MPPs were dramatically reduced after GATA1 induction (day 7) (Fig. 3J). Thus, consistent with the results observed with the MG-G1 transgenic fetal livers, these results demonstrate that derepression of the Gata1 gene in HSPCs increases erythroid differentiation and depletes the HSPC population in the adult bone marrow.
Aberrant GATA1 expression directs erythroid differentiation but reduces hematopoietic colony-forming activity.
To examine whether aberrant GATA1 expression changes the erythroid differentiation properties and/or perturbs the progenitor number, we performed CFU assays by exploiting CMP cells recovered from MG-G1ERT2 bone marrow that was isolated 14 days after tamoxifen treatment. We employed the MethoCult GF M3434 culture system and identified burst-forming unit–erythroid (BFU-E), CFU-granulocyte, erythroid, macrophage, megakaryocyte (CFU-GEMM), and CFU-granulocyte, macrophage (CFU-GM) colonies according to their distinct morphologies. We found that the total colony-forming activity of the MG-G1ERT2 cells was reduced to 64% compared to that of vehicle-treated control cells (Fig. 3K). Among the remaining colonies, the percentage of BFU-E was significantly increased, while the percentage of CFU-GM was decreased and that of CFU-GEMM was unchanged (Fig. 3L). These results support the notion that elevated GATA1 activity in HSPCs skews hematopoiesis toward the erythroid lineage.
GATA1 dysregulation evokes erythropoiesis- and apoptosis-related gene signatures.
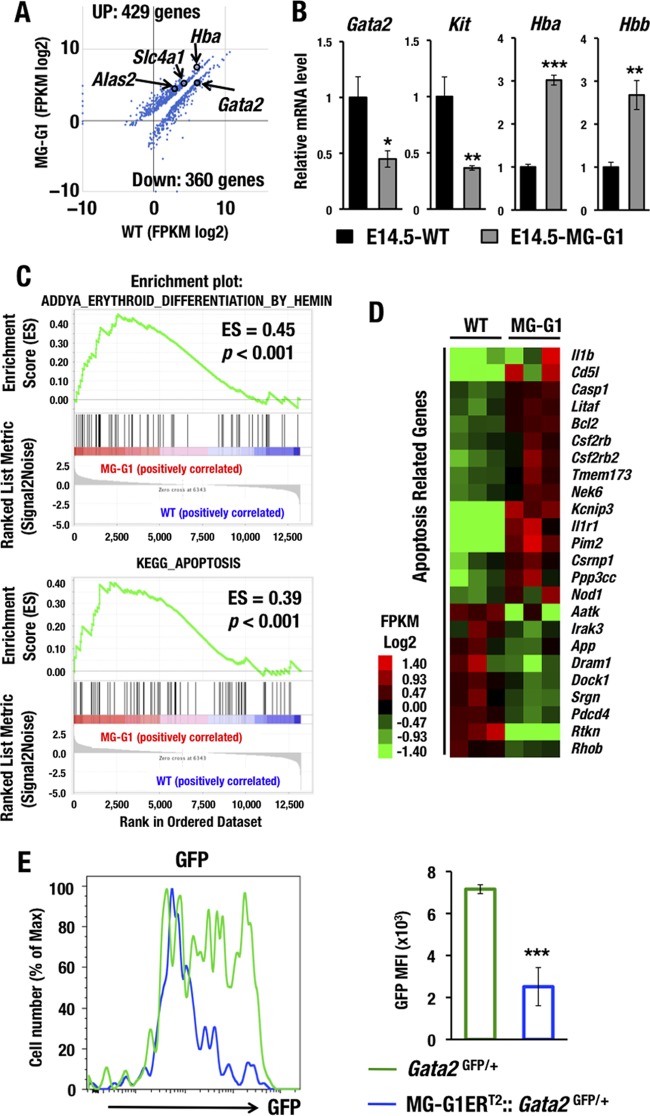
To comprehensively elucidate the molecular alterations that occur under conditions of GATA1 dysregulation in HSPCs, we next performed deep RNA sequencing (RNA-Seq) of the LSK fraction, which was purified from bone marrows from surviving adult MG-G1 mice (n = 3 mice, each approximately 3 months of age). The RNA-Seq data demonstrated statistically significant upregulation of 429 genes and downregulation of 360 genes in MG-G1 LSK cells compared to the gene expression in wild-type LSK cells (Fig. 4A). Upregulated genes included Hba (α-globin), Alas2 (erythroid-type 5-aminolevulinate synthase), and Slc4a1 (Band3), while downregulated genes included Gata2.
FIG 4.
GATA1 dysregulation changes the HSPC gene signature to erythroid differentiation and apoptotic cell death. (A) Scatterplots comparing transcript levels (in fragments per kilobase of exon per million fragments [FPKM]) in wild-type (x axis) and MG-G1 (y axis) mice. Only data for significantly changed genes are shown (P < 0.05). (B) mRNA levels of GATA1 target genes as assessed by manual RT-qPCR using E14.5 LSK cells from livers of wild-type and MG-G1 embryos. (C) GSEA of erythroid differentiation- and apoptosis-related data sets for all RNA-Seq reads of LSK RNAs from MG-G1 and wild-type littermate adult bone marrow cells. (D) Heat map showing relative expression levels of apoptosis-related genes in MG-G1 LSK cells compared to wild-type LSK cells. Heat map colors indicate normalized expression levels. (E) GFP mean fluorescence intensities (MFI) in LSK-gated fractions from Gata2GFP/+ and MG-G1ERT2::Gata2GFP/+ mice after tamoxifen treatment. Note the decrease of GFP MFI in MG-G1ERT2::Gata2GFP/+ mice. Data shown are the means ± SD for three mice. *, P < 0.05; **, P < 0.01; ***, P < 0.001 (unpaired Student's t test).
To verify the RNA-Seq results, we also examined the gene expression profiles of several related genes by real-time quantitative PCR (RT-qPCR). In this verification, we utilized fetal liver LSK cells for comparison to the RNA-Seq results obtained from the adult bone marrow LSK cells. Consistent with the results of the RNA-Seq analysis, the RT-qPCR analysis detected significant upregulation of Hba and Hbb (β-globin) but downregulation of Gata2 and Kit in the MG-G1 fetal liver LSK cells (Fig. 4B). Gene set enrichment analysis (GSEA) of the RNA-Seq data demonstrated significant enrichment of gene signatures affiliated with erythroid differentiation (Fig. 4C, upper panel). Interestingly, we also found significant enrichment of gene signatures affiliated with apoptosis (in the Kyoto Encyclopedia of Genes and Genomes [KEGG]) in the MG-G1 LSK cells (Fig. 4C, lower panel). Twenty-four genes among all the significantly affected genes were likely to have an apoptosis-related function by gene annotation analysis with DAVID (Database for Annotation, Visualization and Integrated Discovery) (Fig. 4D). These results show agreement with the observation that derepression of Gata1 gene expression in HSPCs of MG-G1 and MG-G1ERT2 mice directed hematopoietic differentiation toward the erythroid linage and HSPC depletion.
Aberrant GATA1 induction represses Gata2 expression in bone marrow HSPCs.
During the erythroid lineage differentiation, GATA1 represses Gata2 gene transcription; this phenomenon is known as GATA factor switching (23–27). Consistent with this notion, we found that aberrant GATA1 activation in both fetal liver and adult bone marrow LSK cells markedly repressed Gata2 gene expression (Fig. 4A and B).
To further confirm the reproducibility and to elucidate the significance of GATA1-mediated repression of Gata2 in HSPCs, we employed Gata2GFP/+ mice to monitor GATA2 expression in adult bone marrow LSK cells by flow cytometry (16). For this purpose, MG-G1ERT2::Gata2GFP/+ mice were treated with tamoxifen five times and analyzed 12 days after the initial tamoxifen treatment. We found that the green fluorescent protein (GFP) intensity in LSK cells was significantly reduced after the aberrant GATA1 activation by tamoxifen in MG-G1ERT2::Gata2GFP/+ mice (Fig. 4E), confirming that abundant GATA1 represses Gata2 gene transcription in HSPCs. Because GATA2 is responsible for Gata1 gene activation in MG-G1 (Fig. 1B) and MG-G1ERT2 (Fig. 3B) LSK cells, the repression of Gata2 transcription by GATA1 in the same cells of these mice demonstrated that the ectopic GATA factor switching indeed occurred in the absence of the G1MDR. These lines of evidence thus indicate that the G1MDR is the molecular key to preventing dysregulation of GATA factor switching in HSPCs.
Gata1 gene derepression induces apoptosis in HSPCs.
Because GSEA indicated that enhanced GATA1 expression in MG-G1 LSK cells is associated with apoptosis, and since this effect is consistent with our observation that HSC and progenitor cells were depleted in MG-G1 mice, we next approached the issue of whether the elevated GATA1 expression in HSPCs actually participates in the program of apoptotic cell death. For this purpose, we examined the cell viability status of the LSK cell population in the livers of E14.5 MG-G1 embryos by annexin V-propidium iodide (PI) staining. In wild-type embryos, the vast majority of LSK cells were distributed in the annexin V− PI− population, whereas only a small number of LSK cells underwent late apoptosis, corresponding to the annexin V+ PI+ population (Fig. 5A and B). In MG-G1 embryos, the percentage of viable LSK cells was dramatically reduced, from 82% ± 3% to 5% ± 2%, whereas the percentage of late apoptotic LSK cells was significantly increased, from 11% ± 3% to 86% ± 4% (data are means ± standard deviations [SD] for three independent analyses; a representative analysis is shown in Fig. 5A). These results demonstrate that aberrant GATA1 activity induces HSPCs to undergo apoptosis in MG-G1 embryos.
FIG 5.
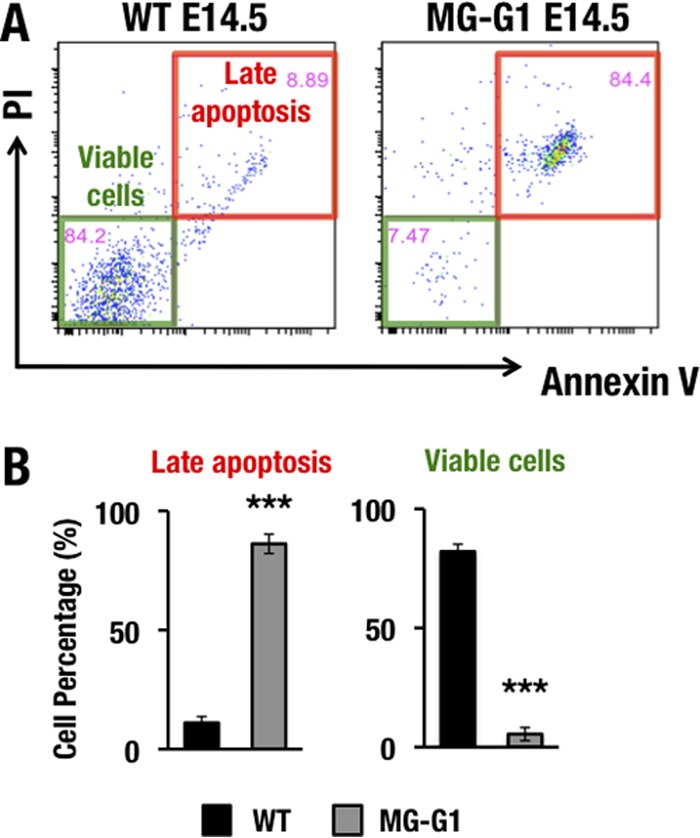
Gata1 gene derepression induces HSPC apoptosis in the MG-G1 fetal liver. (A) PI and annexin V staining of LSK-gated cells from wild-type (left) and MG-G1 (right) E14.5 fetal livers. Note that the late apoptosis fraction was significantly increased in LSK-gated cells from MG-G1 fetal livers, while viable cells were predominant in LSK-gated cells from wild-type fetal livers. (B) Percentages of late apoptotic (PI+ annexin V+) and viable (PI− annexin V−) LSK cells in wild-type and MG-G1 fetal livers. Data shown are the means ± SD for three mice. ***, P < 0.001 (unpaired Student's t test).
High-level GATA1 activity induces apoptosis in LT-HSCs, ST-HSCs, MPPs, and CMPs but prevents apoptosis in MEPs.
To clarify whether abrogation of G1MDR-mediated Gata1 repression renders HSPCs vulnerable to apoptosis in adult mouse bone marrow, we examined LSK cell viability in the bone marrows of adult MG-G1ERT2 mice. Consistent with the results of the MG-G1 embryonic fetal liver analysis described in the previous section, the vast majority of LSK cells were viable annexin V− PI− cells (81% ± 3%) in the absence of tamoxifen treatment (Fig. 6A and B). However, 7 days after the tamoxifen treatment, the percentage of viable cells was significantly decreased, to 20% ± 3% of the LSK cell population, while the percentages of annexin V+ PI+ late apoptotic cells and annexin V+ PI− early apoptotic cells were both significantly increased, from 10% ± 0.5% to 33% ± 4% and from 7% ± 3% to 40% ± 3%, respectively (data are means ± SD for three independent analyses; a representative example is shown in Fig. 6A). These results indicate that the majority of LSK cells in MG-G1ERT2 mouse bone marrow underwent apoptosis upon the induction of GATA1 activity.
FIG 6.
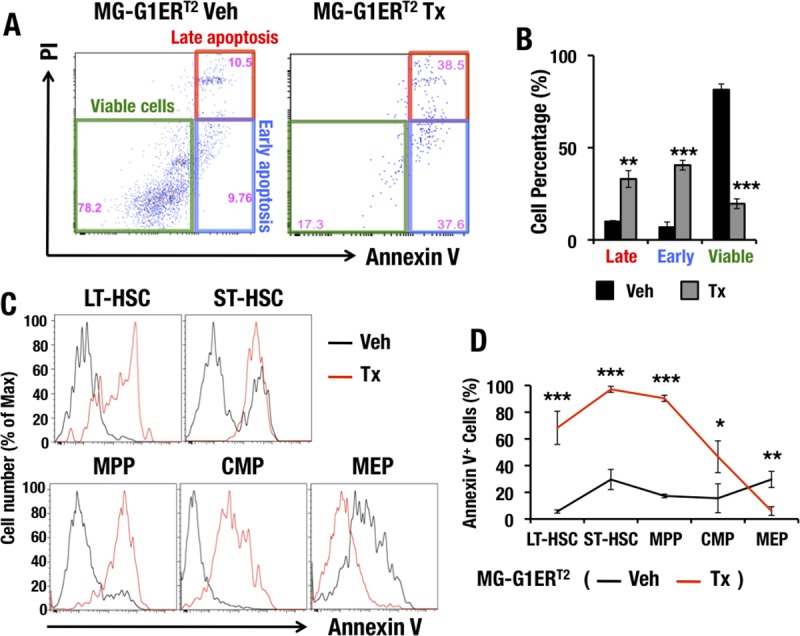
Ectopic GATA1 activation induces HSPC apoptosis but prevents programmed cell death of erythroid and megakaryocytic committed cells. (A) PI and annexin V staining of LSK-gated cells from MG-G1ERT2 mouse bone marrow after vehicle treatment (left) or 7 days of tamoxifen treatment (right). (B) Percentages of late apoptotic, early apoptotic, and viable adult bone marrow LSK cells. (C) Flow cytometry analysis of annexin V staining in LT-HSCs, ST-HSCs, MPPs, CMPs, and MEPs from MG-G1ERT2 mouse bone marrow 7 days after vehicle or tamoxifen treatment. (D) Percentages of annexin V+ apoptotic cells based on the data from panel C. Data shown are the means ± SD for three or four mice. *, P < 0.05; **, P < 0.01; ***, P < 0.001 (unpaired Student's t test).
To further address the consequences of aberrant GATA1 activity for the viability of cell subsets during erythroid differentiation, we stained bone marrow LT-HSCs, ST-HSCs, MPPs, CMPs, and MEPs with annexin V. In the tamoxifen-treated MG-G1ERT2 mice, the percentages of annexin V+ apoptotic cells were significantly increased for the LT-HSC, ST-HSC, MPP, and CMP subsets (Fig. 6C and D). In contrast, the percentage of annexin V+ cells was significantly reduced in MEP cells from tamoxifen-treated MG-G1ERT2 mice (Fig. 6C and D). Thus, our results demonstrate that the aberrant GATA1 activity observed by deletion of the G1MDR rendered HSCs and CMPs vulnerable to apoptosis, while it prevented MEPs from initiating programmed cell death.
The vast majority of HSPCs are labeled in MG-CreERT2::R26T transgenic mice.
To further clarify Gata1 gene regulation in HSPCs, we generated two lines of MG-CreERT2 transgenic mice (Fig. 7A). We bred MG-CreERT2 mice with Rosa26 flox-Stop-flox tdTomato reporter mice (MG-CreERT2::R26T) and examined the recombination efficiency of the inducible Cre recombinase. MG-CreERT2::R26T mice were administered tamoxifen and then subjected to analysis 14 days after the first administration (Fig. 7A). In this analysis, we used R26ΔT mice (Rosa26 flox-Stop-flox tdTomato reporter mice with a constitutive stop codon deletion) as a positive control in which all cells expressed tdTomato fluorescence, while wild-type C57BL/6 mice served as a negative control. We found that 87.5% and 73.4% of LSK cells from lines 1 and 2, respectively, of MG-CreERT2::R26T mice showed tdTomato fluorescence after the tamoxifen treatments (Fig. 7B). These fluorescence percentages were comparable to those observed in the positive-control R26ΔT mice, in which 88.2% of LSK cells were tdTomato+. These results indicate that MG-CreERT2 efficiently activated Cre activity in the majority of LSK cells. The vehicle-treated MG-CreERT2::R26T mice and the wild-type negative-control mice had no tdTomato-positive cells (Fig. 7B, right panel), indicating the absence of Cre recombinase activity without prior tamoxifen treatment.
FIG 7.
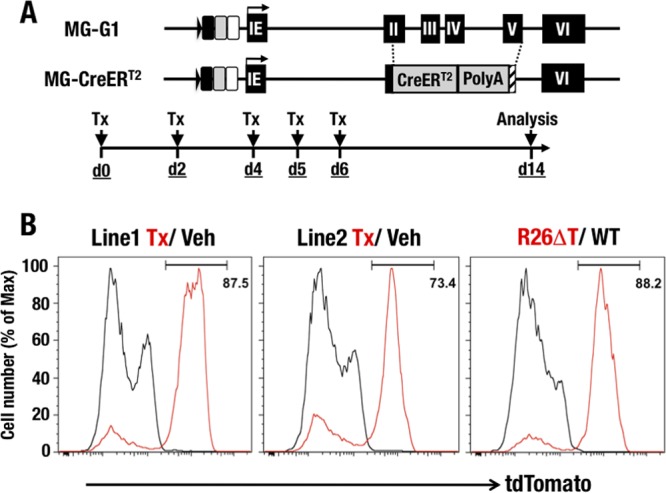
Generation of MG-CreERT2 mice. (A) Structure of the MG-CreERT2 BAC transgenic allele. The CreERT2 fusion cDNA was integrated by homologously replacing the 2nd to 5th exon regions of the Gata1 gene in the MG-G1 BAC DNA. Tamoxifen was administered to the mice by intraperitoneal injection on days 0, 2, 4, 5, and 6. Analysis was performed on day 14. (B) tdTomato histograms confirming Cre activity in the LSK fractions of R26T::MG-CreERT2 and control mice. (Left) R26T::MG-CreERT2 line 1 (red line, tamoxifen; black line, vehicle). (Middle) R26T::MG-CreERT2 line 2 (red line, tamoxifen; black line, vehicle). (Right) R26ΔT positive control (red line) and WT negative control (black line).
Dnmt1 plays a key role in repressing Gata1 gene expression in HSPCs.
Dnmt1 is recruited to the G1MDR and participates in the maintenance of DNA methylation at the Gata1 locus in HSPCs (29). Therefore, we attempted to further dissect this mechanism by employing a Dnmt1 conditional knockout mouse line (32). We crossbred the MG-CreERT2 mice (line 1) with Dnmt1f/f and generated Dnmt1f/f::MG-CreERT2 mice. We called these mice Dnmt1-CKO mice and used them to elucidate the consequences of Dnmt1 deletion in HSPCs. We exploited straightforward MG-CreERT2 mice with tamoxifen treatment as a negative control.
In the Dnmt1-CKO mice, Dnmt1 mRNA expression in bone marrow LSK cells was reduced more than 60% 14 days after tamoxifen administration (Fig. 8A). Consistent with our hypothesis, the Gata1 mRNA abundance increased significantly upon Dnmt1 deletion (Fig. 8A). To clarify whether the Gata1 mRNA induction was associated with the gene enhancer demethylation in Dnmt1-CKO mice, we performed bisulfite sequencing using DNA samples isolated from bone marrow LSK cells of Dnmt1-CKO mice and control MG-CreERT2 mice. We designed primers that specifically amplified the dbG enhancer from the endogenous Gata1 locus. Notably, the methylation level of the dbG enhancer was significantly reduced, from 100% in control LSK cells of MG-CreERT2 mice to approximately 33% in LSK cells of Dnmt1-CKO mice (Fig. 8B), which shows agreement with the increase of Gata1 expression in LSK cells from Dnmt1 conditional knockout mouse bone marrow.
FIG 8.
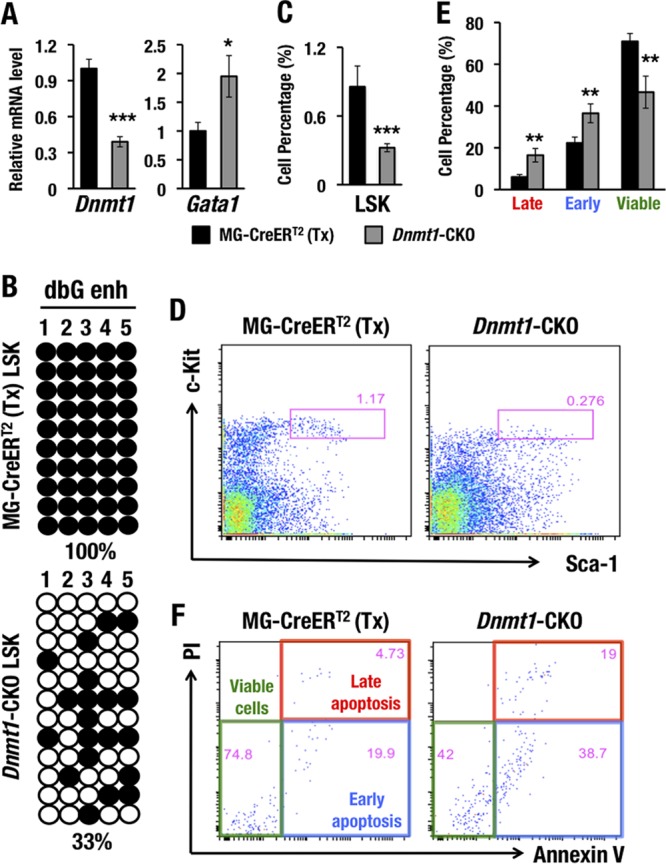
Dnmt1 deletion induces Gata1 expression and subsequently depletes HSPCs. (A) Dnmt1 and Gata1 mRNA levels in the LSK fractions from MG-CreERT2 and Dnmt1-CKO mouse bone marrows 14 days after tamoxifen treatment. (B) Bisulfite sequencing of the dbG enhancer (dbG enh) in LSK cells from MG-CreERT2 and Dnmt1-CKO adult mouse bone marrows 14 days after tamoxifen treatment. (C and D) LSK percentages (C) and LSK flow cytometry (D) for MG-CreERT2 and Dnmt1-CKO mice after tamoxifen treatment. (E and F) Late apoptotic, early apoptotic, and viable LSK cell percentages (E) and annexin V-PI staining of LSK-gated cells (F) for MG-CreERT2 and Dnmt1-CKO adult mouse bone marrows 14 days after tamoxifen treatment. Note that conditional knockout of Dnmt1 induced GATA1 expression and reduced the total LSK population and the number of viable LSK cells. Data shown are the means ± SD for three to five mice. *, P < 0.05; **, P < 0.01; ***, P < 0.001 (unpaired Student's t test).
In the previous section, we showed that ectopic GATA1 expression led to HSPC depletion in MG-G1 mice and tamoxifen-treated MG-G1ERT2 mice. Consistent with the increase of GATA1 expression in the Dnmt1 conditional knockout mice, the percentage of LSK cells was significantly decreased in the bone marrows of Dnmt1-CKO mice (Fig. 8C and D). To elucidate whether the LSK cell depletion in Dnmt1-CKO mouse bone marrow was associated with the induction of apoptosis, we examined the viability of these cells. Dnmt1-CKO LSK cells harbored significantly increased percentages of early and late apoptotic cells, but the viable cell population in Dnmt1-CKO LSK cells was dramatically diminished compared to that in the MG-CreERT2 control mice (Fig. 8E and F). Thus, the genetic Dnmt1 ablation caused an increase of Gata1 expression, which recapitulated the HSPC deficiency in the MG-G1 and tamoxifen-treated MG-G1ERT2 mouse models. These results strongly support our contentions that Dnmt1 represses Gata1 gene expression in HSPCs through methylation of the G1MDR for HSPC maintenance and that G1MDR demethylation and GATA2-mediated activation of Gata1 gene expression are prerequisites for the start of erythroid differentiation.
DISCUSSION
In this study, we showed the essential requirement of the G1MDR cis-element as the key regulator of Gata1 gene suppression for HSPC maintenance. As summarized in the top panel of Fig. 9, the G1MDR recruits Dnmt1 and methylates DNA at the Gata1 locus, which prevents Gata1 gene activation by GATA2 in HSPCs. For the initiation of erythroid differentiation (Fig. 9, middle panel), Dnmt1- and G1MDR-mediated methylation of the Gata1 locus is gradually downregulated, which facilitates gene activation by GATA2. Subsequently, increased GATA1 expression represses Gata2 gene expression, and GATA factor switching occurs. In this way, erythroid differentiation begins. However, if the G1MDR-mediated Gata1 gene repression is completely abrogated in HSPCs, as is the case in MG-G1 mice or tamoxifen-treated MG-G1ERT2 mice (Fig. 9, bottom panel), excess GATA1 provokes accelerated erythropoiesis and HSPC apoptosis. Thus, this study demonstrates that Dnmt1-G1MDR-mediated Gata1 gene repression plays a crucial role in HSPC maintenance and suggests that derepression of Dnmt1-G1MDR repression is the critical mechanism that initiates Gata1 gene expression and promotes erythroid commitment and differentiation of HSPCs.
FIG 9.
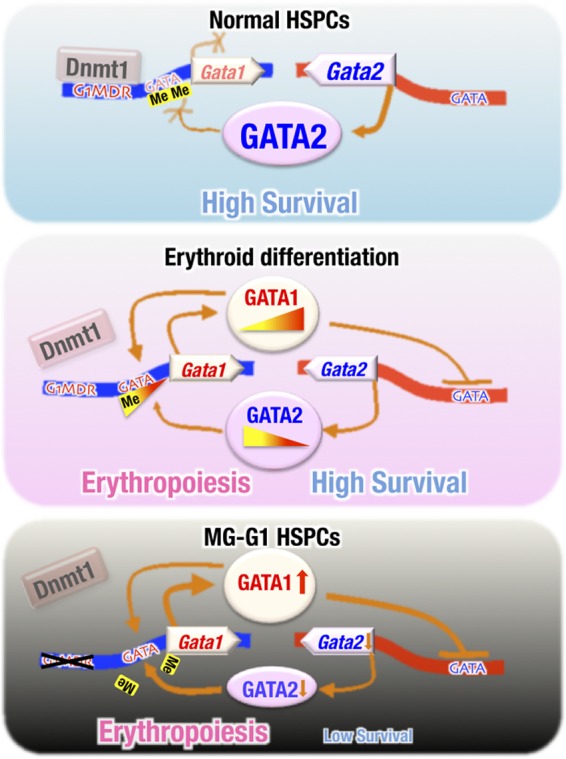
Dnmt1 and the G1MDR cis-acting repressor element maintain the HSPC balance between erythropoiesis initiation and cell survival. (Top) Under normal conditions, G1MDR-mediated Dnmt1 recruitment and methylation of the Gata1 gene enhancer and the upstream promoter regions repress Gata1 gene expression in HSPCs, which maintains HSPC homeostasis. (Middle) During erythroid differentiation, the Dnmt1-G1MDR-mediated DNA methylation of the Gata1 enhancer is gradually reduced (in contrast to the total loss caused by G1MDR deletion). The decreased methylation allows GATA2 to initiate Gata1 transcription gradually during the initiation of erythropoiesis. The progressively enhanced level of GATA1 then transactivates the expression of the Gata1 gene itself (autoregulation) and represses Gata2 gene expression, thus directing the progress of erythropoiesis. (Bottom) Upon deletion of the G1MDR, the epigenetic repression of Gata1 gene expression is completely abrogated such that GATA2 is able to fully transactivate Gata1 gene expression in HSPCs. The aberrant GATA1 activation represses the Gata2 gene and accelerates HSPC depletion through inducing erythroid differentiation and apoptosis.
We found in this study that the aberrant GATA1 expression in HSPCs observed on deletion of the G1MDR induces erythropoiesis that is coupled to apoptosis. We surmised that HSPC apoptosis might be due to the induction of apoptosis-related genes by GATA1. In this regard, it is interesting that erythroid lineage cells tend to undergo apoptosis and that erythropoietin signaling prevents this apoptosis (33, 34). The expression of the erythropoietin receptor is usually upregulated after the BFU-E stage of erythropoiesis (34). Therefore, we envisaged that full Gata1 gene activation needed to be balanced by the enhancement of erythropoietin signaling in the erythroid lineage-committed progenitors; without erythropoietin signaling, for instance, in the case of MG-G1 mice (Fig. 9, bottom panel), HSPCs head toward apoptosis. These observations suggest that Gata1 gene expression must be coupled with enhanced antiapoptotic signaling to maintain erythroid homeostasis. Indeed, we observed a decrease of the c-Kit expression level in MG-G1 LSK cells (Fig. 4B). The Kit gene is a well-known target that is negatively regulated by GATA1 and plays a crucial role in HSPC survival (35, 36). The decrease of c-Kit expression may also be involved in the induction of HSPC apoptosis.
During erythroid differentiation, GATA2 activates Gata1 gene expression, while GATA1 activates Gata1 gene expression but represses Gata2 gene expression to make the switch of GATA factors from GATA2 to GATA1 (23–28). In this study, we addressed the mechanisms of GATA factor switching. Our results demonstrate that G1MDR-mediated DNA methylation is the molecular key to initiating GATA factor switching.
We surmise that this research opens the doors to a number of intriguing projects. For instance, the mechanism that initiates enfeebling of the Dnmt1 activity at the G1MDR and demethylation of the Gata1 gene enhancers is the immediate target of our future study, as it is crucial for the understanding of the molecular basis of GATA factor switching at the initiation of erythroid differentiation. In this regard, the following observations may be pertinent. The 3′-end sequence of the G1MDR contains a consensus binding site for the E2F transcription factor, and a substitution mutation of the binding site abrogates the repressor activity of the G1MDR (29). This E2F activity is particularly intriguing because Dnmt1 is known to form a complex with E2F and to repress target gene expression (37). These observations suggest that negative regulation of the Gata1 gene in HSPCs may be based on a G1MDR-E2F-Dnmt1 complex. We surmise that the E2F expression pattern or activity may be changed during erythroid differentiation, which consequently reduces Dnmt1 recruitment and removes DNA methylation at the G1MDR.
Myelodysplastic syndrome (MDS) is a hematopoietic stem cell disorder characterized by ineffective blood cell production, which can progress to acute myeloid leukemia (AML) at a high frequency (38). Increased apoptotic death of CD34+ hematopoietic progenitors has been assumed to be one of the mechanisms underlying the hematopoietic defect in early-stage MDS patients (39). One clinical report found that GATA1 mRNA expression had increased approximately 10-fold in the CD34+ progenitors of MDS patients (40). In this study, we found that ectopic increases of GATA1 expression in HSCs led them to apoptosis and subsequent depletion. Based on these lines of evidence, we surmise that our current observation may be relevant to clinical observations on MDS patients, such that an enhanced level of GATA1 in CD34+ MDS cells may be critically involved in the pathology of MDS through activation of MDS cell apoptosis.
In summary, we found that Dnmt1-G1MDR-mediated Gata1 repression is crucial for HSPC survival and that derepression of the Gata1 gene following Dnmt1-G1MDR-mediated repression is an important mechanism for promoting the initiation of GATA factor switching, which subsequently drives the HSPC differentiation toward the erythroid lineage.
MATERIALS AND METHODS
BAC modification and generation of BAC transgenic mice.
A mouse Gata1 BAC clone (RP23-443E19) was homologously recombined with the targeting vector which was used to modify the MG-GFP BAC in our previous study (29). The correctly targeted BAC was then subjected to Neo excision to generate the MG-G1 BAC (Fig. 1A). The MG-G1 BAC was used as a parental clone to generate MG-G1ERT2 and MG-CreERT2 BACs (Fig. 3A and 7A). The targeting vector includes a 2-kb 5′ homologous region (containing the DNA region from the first intron to right before the Gata1 starting ATG in the second exon) and a 1.3-kb 3′ homologous region. G1ERT2-polyA-Neo or CreERT2-polyA-Neo was inserted into the endogenous Gata1 initiating ATG by recombination. The correct clone was then used for Neo excision to generate MG-G1ERT2 and MG-CreERT2 BAC clones. BAC transgenic mice were generated as described previously (10, 29). Mouse experimental procedures were approved by the Institutional Animal Experiment Committee of Tohoku University.
Flow cytometry analyses.
Flow cytometry was performed on a FACSAria II flow cytometer (BD Biosciences). Mononuclear cells were prepared by use of Histopaque (Sigma), and lineage-positive cells were removed using a mouse hematopoietic lineage biotin panel (eBioscience) and Dynabeads M-280 streptavidin (Invitrogen). Apoptotic analysis was performed with a BD Pharmingen APC annexin V kit (BD Biosciences) according to the manufacturer's instructions. PI-negative cells were used for all flow cytometry experiments except for the apoptosis analysis. The following flow cytometry antibodies were used: c-Kit–allophycocyanin (APC) (eBioscience), c-Kit–APC–eFluor780 (eBioscience), CD34-fluorescein isothiocyanate (FITC) (eBioscience), CD34-APC (R&D), FcrR-phycoerythrin (PE) (BD Biosciences), Sca1-FITC (BD Biosciences), Sca1-PE (BD Biosciences), Sca1-PE-Cy7 (Biolegend), Ter119-PE (eBioscience), CD71-FITC (eBioscience), CD41-FITC (BD Biosciences), CD61-PE (BD Biosciences), CD150-BV421 (Biolegend), and CD48-PE (Biolegend) antibodies.
CFU assay.
One thousand CMP cells were isolated and cultured in 3 ml MethoCult GF M3434 (Stemcell Technologies) for 7 days. Colonies were determined by morphology according to the instructions in the product manual.
RT-qPCR.
Cells were directly sorted into Isogen or Isogen-LS (Nippon Gene). RNA extraction, cDNA synthesis, and quantitative PCR were performed as described previously (41). The primer sequences are listed in Table 1.
TABLE 1.
Primer and probe sequences used for genomic PCR and RT-qPCR
| Primer use and target | Sequence |
||
|---|---|---|---|
| Sense primer | Antisense primer | Probe | |
| Genotyping | |||
| MG | GGTCTCAAATGGAAGCCTGA | TGGAGTCCAGTGTCCAGTCA | |
| Chloramphenicol acetylase (BAC transgene) | CAGTCAGTTGCTCAATGTACC | ACTGGTGAAACTCACCCA | |
| GFP | CTGAAGTTCATCTGCACCACC | GAAGTTGTACTCCAGCTTGTGC | |
| ERT2 | GACAGGGAGCTGGTTCACAT | AGAGACTTCAGGGTGCTGGA | |
| Cre | ACGTTCACCGGCATCAACGT | CTGCATTACCGGTCGATGCA | |
| Dnmt1 flox | GCCAGTTGTGTGACTTGGAAA | GAGTGTGTGTTCCGTTCTCCA | |
| R26T reporter | GGCATTAAAGCAGCGTATCC | CTGTTCCTGTACGGCATGG | |
| qRT-PCR with SYBR green | |||
| Hba | CCCGGTGCCTTGTCTGCT | GGGTGAAATCGGCAGGGTGG | |
| Hbb | TGTGGGGAAAGGTGAACGC | CATGGGCCTTCACTTTGGC | |
| c-Kit | TGACAAATTCACCCTCAAAGTG | CCCCTTTCTTAAGGAGGTGAC | |
| GATA2 | ACCTGTGCAATGCCTGTGGG | TTGCACAACAGGTGCCCGCT | |
| GATA1 | CAGAACCGGCCTCTCATCC | TAGTGCATTGGGTGCCTGC | |
| Dnmt1 | CACCTTTGGTGTGCTCCAG | CGCAAACACATGCAGAGG | |
| qRT-PCR with TaqMan | |||
| rRNA | CGGCTACCACATCCAAGGAA | GCTGGAATTACCGCGGCT | TGCTGGCACCAGACTTGCCCTC |
Tamoxifen administration.
Tamoxifen (Sigma) was dissolved in corn oil at 20 mg/ml and administered intraperitoneally.
RNA sequencing.
Lin− Sca1+ c-Kit+ (LSK) cells were isolated from wild-type or MG-G1 adult bone marrow in triplicate by flow cytometry, and RNA was extracted. Seventy-five nanograms of total RNA was used to generate an RNA library. Isolation of poly(A)-tailed RNA and library preparation were performed using a SureSelect strand-specific RNA sample prep kit (Agilent Technologies). The quality and quantity of the libraries were assessed by the quantitative MiSeq (qMiSeq) method (42). The libraries were sequenced using a NextSeq500 system (Illumina) for 86 cycles of single reads.
RNA-Seq data analysis.
TopHat (43) was used to map the RNA-Seq data, and Cufflinks, version 2.1.1 (44), was used to quantify the expression level of each gene, in fragments per kilobase of exon per million fragments (FPKM), using default parameters. The differentially expressed genes were identified using Cuffdiff, version 2.1.1, with a threshold q value of 0.05. Pathway analysis of the gene expression data was performed using Gene Set Enrichment Analysis (GSEA) software (45).
Bisulfite sequencing.
LSK cells were isolated from MG-CreERT2 or Dnmt1-CKO adult bone marrow 14 days after tamoxifen treatment. Bisulfite treatment and sample recovery were performed by use of a MethylEasy Xceed kit (Genetic Signatures) according to the manufacturer's instructions. The sequences of the primers used for nested PCR amplification of the dbG enhancer were as follows: dbG 1st sense primer, AAAATACATACACTTCTTTAATACTTC; dbG 1st antisense primer, TTATTTTGGGTGTTATTTTAGTTTTT; dbG 2nd sense primer, AGTTTTAAGATAGTTTGTTATTG; and dbG 2nd antisense primer, ACATACACTTCTTTAATACTT.
Accession number(s).
The data discussed in this publication have been deposited in NCBI's Gene Expression Omnibus and are accessible through accession number GSE85750.
ACKNOWLEDGMENTS
We thank Hozumi Motohashi and Ritsuko Shimizu for helpful discussions and Hiromi Suda for microinjection. We also thank the animal faculty and biomedical research core of the Tohoku University Graduate School of Medicine for technical support.
This study was supported by JSPS KAKENHI (grant 15H06037 to L.Y., grant 16H05147 to T.M., and grant 15H02507 to M.Y.), the Kobayashi Foundation for Cancer Research (T.M.), the Platform for Drug Discovery, Informatics, and Structural Life Science from AMED (M.Y.), and AMED-Core Research for Evolutional Science and Technology (AMED-CREST) (M.Y.).
REFERENCES
- 1.Takahashi S, Onodera K, Motohashi H, Suwabe N, Hayashi N, Yanai N, Nabesima Y, Yamamoto M. 1997. Arrest in primitive erythroid cell development caused by promoter-specific disruption of the GATA-1 gene. J Biol Chem 272:12611–12615. doi: 10.1074/jbc.272.19.12611. [DOI] [PubMed] [Google Scholar]
- 2.Takahashi S, Komeno T, Suwabe N, Yoh K, Nakajima O, Nishimura S, Kuroha T, Nagasawa T, Yamamoto M. 1998. Role of GATA-1 in proliferation and differentiation of definitive erythroid and megakaryocytic cells in vivo. Blood 92:434–442. [PubMed] [Google Scholar]
- 3.Zon LI, Yamaguchi Y, Yee K, Albee EA, Kimura A, Bennett JC, Orkin SH, Ackerman SJ. 1993. Expression of mRNA for the GATA-binding proteins in human eosinophils and basophils: potential role in gene transcription. Blood 81:3234–3241. [PubMed] [Google Scholar]
- 4.Martin DI, Zon LI, Mutter G, Orkin SH. 1990. Expression of an erythroid transcription factor in megakaryocytic and mast cell lineages. Nature 344:444–447. doi: 10.1038/344444a0. [DOI] [PubMed] [Google Scholar]
- 5.Shimizu R, Engel JD, Yamamoto M. 2008. GATA1-related leukaemias. Nat Rev Cancer 8:279–287. doi: 10.1038/nrc2348. [DOI] [PubMed] [Google Scholar]
- 6.Shimizu R, Yamamoto M. 2012. Contribution of GATA1 dysfunction to multi-step leukemogenesis. Cancer Sci 103:2039–2044. doi: 10.1111/cas.12007. [DOI] [PMC free article] [PubMed] [Google Scholar]
- 7.Hasegawa A, Kaneko H, Ishihara D, Nakamura M, Watanabe A, Yamamoto M, Trainor CD, Shimizu R. 2016. GATA1 binding kinetics on conformation-specific binding sites elicit differential transcriptional regulation. Mol Cell Biol 36:2151–2167. doi: 10.1128/MCB.00017-16. [DOI] [PMC free article] [PubMed] [Google Scholar]
- 8.Toki T, Kanezaki R, Kobayashi E, Kaneko H, Suzuki M, Wang R, Terui K, Kanegane H, Maeda M, Endo M, Mizuochi T, Adachi S, Hayashi Y, Yamamoto M, Shimizu R, Ito E. 2013. Naturally occurring oncogenic GATA1 mutants with internal deletions in transient abnormal myelopoiesis in Down syndrome. Blood 121:3181–3184. doi: 10.1182/blood-2012-01-405746. [DOI] [PubMed] [Google Scholar]
- 9.Suzuki N, Suwabe N, Ohneda O, Obara N, Imagawa S, Pan X, Motohashi H, Yamamoto M. 2003. Identification and characterization of 2 types of erythroid progenitors that express GATA-1 at distinct levels. Blood 102:3575–3583. doi: 10.1182/blood-2003-04-1154. [DOI] [PubMed] [Google Scholar]
- 10.Suzuki M, Moriguchi T, Ohneda K, Yamamoto M. 2009. Differential contribution of the Gata1 gene hematopoietic enhancer to erythroid differentiation. Mol Cell Biol 29:1163–1175. doi: 10.1128/MCB.01572-08. [DOI] [PMC free article] [PubMed] [Google Scholar]
- 11.Tsai SF, Strauss E, Orkin SH. 1991. Functional analysis and in vivo footprinting implicate the erythroid transcription factor GATA-1 as a positive regulator of its own promoter. Genes Dev 5:919–931. doi: 10.1101/gad.5.6.919. [DOI] [PubMed] [Google Scholar]
- 12.Onodera K, Takahashi S, Nishimura S, Ohta J, Motohashi H, Yomogida K, Hayashi N, Engel JD, Yamamoto M. 1997. GATA-1 transcription is controlled by distinct regulatory mechanisms during primitive and definitive erythropoiesis. Proc Natl Acad Sci U S A 94:4487–4492. doi: 10.1073/pnas.94.9.4487. [DOI] [PMC free article] [PubMed] [Google Scholar]
- 13.Nishimura S, Takahashi S, Kuroha T, Suwabe N, Nagasawa T, Trainor C, Yamamoto M. 2000. A GATA box in the GATA-1 gene hematopoietic enhancer is a critical element in the network of GATA factors and sites that regulate this gene. Mol Cell Biol 20:713–723. doi: 10.1128/MCB.20.2.713-723.2000. [DOI] [PMC free article] [PubMed] [Google Scholar]
- 14.Ohneda K, Shimizu R, Nishimura S, Muraosa Y, Takahashi S, Engel JD, Yamamoto M. 2002. A minigene containing four discrete cis elements recapitulates GATA-1 gene expression in vivo. Genes Cells 7:1243–1254. doi: 10.1046/j.1365-2443.2002.00595.x. [DOI] [PubMed] [Google Scholar]
- 15.Moriguchi T, Suzuki M, Yu L, Takai J, Ohneda K, Yamamoto M. 2015. Progenitor stage-specific activity of a cis-acting double GATA motif for Gata1 gene expression. Mol Cell Biol 35:805–815. doi: 10.1128/MCB.01011-14. [DOI] [PMC free article] [PubMed] [Google Scholar]
- 16.Suzuki N, Ohneda O, Minegishi N, Nishikawa M, Ohta T, Takahashi S, Engel JD, Yamamoto M. 2006. Combinatorial Gata2 and Sca1 expression defines hematopoietic stem cells in the bone marrow niche. Proc Natl Acad Sci U S A 103:2202–2207. doi: 10.1073/pnas.0508928103. [DOI] [PMC free article] [PubMed] [Google Scholar]
- 17.Yamamoto M, Ko LJ, Leonard MW, Beug H, Orkin SH, Engel JD. 1990. Activity and tissue-specific expression of the transcription factor NF-E1 multigene family. Genes Dev 4:1650–1662. doi: 10.1101/gad.4.10.1650. [DOI] [PubMed] [Google Scholar]
- 18.Tsai FY, Orkin SH. 1997. Transcription factor GATA-2 is required for proliferation/survival of early hematopoietic cells and mast cell formation, but not for erythroid and myeloid terminal differentiation. Blood 89:3636–3643. [PubMed] [Google Scholar]
- 19.Minegishi N, Suzuki N, Yokomizo T, Pan X, Fujimoto T, Takahashi S, Hara T, Miyajima A, Nishikawa S, Yamamoto M. 2003. Expression and domain-specific function of GATA-2 during differentiation of the hematopoietic precursor cells in midgestation mouse embryos. Blood 102:896–905. doi: 10.1182/blood-2002-12-3809. [DOI] [PubMed] [Google Scholar]
- 20.Lim KC, Hosoya T, Brandt W, Ku CJ, Hosoya-Ohmura S, Camper SA, Yamamoto M, Engel JD. 2012. Conditional Gata2 inactivation results in HSC loss and lymphatic mispatterning. J Clin Invest 122:3705–3717. doi: 10.1172/JCI61619. [DOI] [PMC free article] [PubMed] [Google Scholar]
- 21.de Pater E, Kaimakis P, Vink CS, Yokomizo T, Yamada-Inagawa T, van der Linden R, Kartalaei PS, Camper SA, Speck N, Dzierzak E. 2013. Gata2 is required for HSC generation and survival. J Exp Med 210:2843–2850. doi: 10.1084/jem.20130751. [DOI] [PMC free article] [PubMed] [Google Scholar]
- 22.Yamazaki H, Suzuki M, Otsuki A, Shimizu R, Bresnick EH, Engel JD, Yamamoto M. 2014. A remote GATA2 hematopoietic enhancer drives leukemogenesis in inv(3)(q21;q26) by activating EVI1 expression. Cancer Cell 25:415–427. doi: 10.1016/j.ccr.2014.02.008. [DOI] [PMC free article] [PubMed] [Google Scholar]
- 23.Ohneda K, Yamamoto M. 2002. Roles of hematopoietic transcription factors GATA-1 and GATA-2 in the development of red blood cell lineage. Acta Haematol 108:237–245. doi: 10.1159/000065660. [DOI] [PubMed] [Google Scholar]
- 24.Kaneko H, Shimizu R, Yamamoto M. 2010. GATA factor switching during erythroid differentiation. Curr Opin Hematol 17:163–168. doi: 10.1097/MOH.0b013e32833800b8. [DOI] [PubMed] [Google Scholar]
- 25.Bresnick EH, Lee HY, Fujiwara T, Johnson KD, Keles S. 2010. GATA switches as developmental drivers. J Biol Chem 285:31087–31093. doi: 10.1074/jbc.R110.159079. [DOI] [PMC free article] [PubMed] [Google Scholar]
- 26.Suzuki M, Shimizu R, Yamamoto M. 2011. Transcriptional regulation by GATA1 and GATA2 during erythropoiesis. Int J Hematol 93:150–155. doi: 10.1007/s12185-011-0770-6. [DOI] [PubMed] [Google Scholar]
- 27.Suzuki M, Kobayashi-Osaki M, Tsutsumi S, Pan X, Ohmori S, Takai J, Moriguchi T, Ohneda O, Ohneda K, Shimizu R, Kanki Y, Kodama T, Aburatani H, Yamamoto M. 2013. GATA factor switching from GATA2 to GATA1 contributes to erythroid differentiation. Genes Cells 18:921–933. doi: 10.1111/gtc.12086. [DOI] [PubMed] [Google Scholar]
- 28.Shimizu R, Yamamoto M. 2016. GATA-related hematologic disorders. Exp Hematol 44:696–705. doi: 10.1016/j.exphem.2016.05.010. [DOI] [PubMed] [Google Scholar]
- 29.Takai J, Moriguchi T, Suzuki M, Yu L, Ohneda K, Yamamoto M. 2013. The Gata1 5′ region harbors distinct cis-regulatory modules that direct gene activation in erythroid cells and gene inactivation in HSCs. Blood 122:3450–3460. doi: 10.1182/blood-2013-01-476911. [DOI] [PubMed] [Google Scholar]
- 30.Moriguchi T, Yamamoto M. 2014. A regulatory network governing Gata1 and Gata2 gene transcription orchestrates erythroid lineage differentiation. Int J Hematol 100:417–424. doi: 10.1007/s12185-014-1568-0. [DOI] [PubMed] [Google Scholar]
- 31.Kiel MJ, Yilmaz OH, Iwashita T, Terhorst C, Morrison SJ. 2005. SLAM family receptors distinguish hematopoietic stem and progenitor cells and reveal endothelial niches for stem cells. Cell 121:1109–1121. doi: 10.1016/j.cell.2005.05.026. [DOI] [PubMed] [Google Scholar]
- 32.Jackson-Grusby L, Beard C, Possemato R, Tudor M, Fambrough D, Csankovszki G, Dausman J, Lee P, Wilson C, Lander E, Jaenisch R. 2001. Loss of genomic methylation causes p53-dependent apoptosis and epigenetic deregulation. Nat Genet 27:31–39. doi: 10.1038/83730. [DOI] [PubMed] [Google Scholar]
- 33.Socolovsky M, Nam H, Fleming MD, Haase VH, Brugnara C, Lodish HF. 2001. Ineffective erythropoiesis in Stat5a(−/−)5b(−/−) mice due to decreased survival of early erythroblasts. Blood 98:3261–3273. doi: 10.1182/blood.V98.12.3261. [DOI] [PubMed] [Google Scholar]
- 34.Richmond TD, Chohan M, Barber DL. 2005. Turning cells red: signal transduction mediated by erythropoietin. Trends Cell Biol 15:146–155. doi: 10.1016/j.tcb.2005.01.007. [DOI] [PubMed] [Google Scholar]
- 35.Munugalavadla V, Dore LC, Tan BL, Hong L, Vishnu M, Weiss MJ, Kapur R. 2005. Repression of c-kit and its downstream substrates by GATA-1 inhibits cell proliferation during erythroid maturation. Mol Cell Biol 25:6747–6759. doi: 10.1128/MCB.25.15.6747-6759.2005. [DOI] [PMC free article] [PubMed] [Google Scholar]
- 36.Broudy VC. 1997. Stem cell factor and hematopoiesis. Blood 90:1345–1364. [PubMed] [Google Scholar]
- 37.Robertson KD, Ait-Si-Ali S, Yokochi T, Wade PA, Jones PL, Wolffe AP. 2000. DNMT1 forms a complex with Rb, E2F1 and HDAC1 and represses transcription from E2F-responsive promoters. Nat Genet 25:338–342. doi: 10.1038/77124. [DOI] [PubMed] [Google Scholar]
- 38.Li J. 2013. Myelodysplastic syndrome hematopoietic stem cell. Int J Cancer 133:525–533. doi: 10.1002/ijc.27896. [DOI] [PubMed] [Google Scholar]
- 39.Kerbauy DB, Deeg HJ. 2007. Apoptosis and antiapoptotic mechanisms in the progression of myelodysplastic syndrome. Exp Hematol 35:1739–1746. doi: 10.1016/j.exphem.2007.09.007. [DOI] [PMC free article] [PubMed] [Google Scholar]
- 40.Maratheftis CI, Bolaraki PE, Voulgarelis M. 2007. GATA-1 transcription factor is up-regulated in bone marrow hematopoietic progenitor CD34(+) and erythroid CD71(+) cells in myelodysplastic syndromes. Am J Hematol 82:887–892. doi: 10.1002/ajh.20993. [DOI] [PubMed] [Google Scholar]
- 41.Yu L, Moriguchi T, Souma T, Takai J, Satoh H, Morito N, Engel JD, Yamamoto M. 2014. GATA2 regulates body water homeostasis through maintaining aquaporin 2 expression in renal collecting ducts. Mol Cell Biol 34:1929–1941. doi: 10.1128/MCB.01659-13. [DOI] [PMC free article] [PubMed] [Google Scholar]
- 42.Katsuoka F, Yokozawa J, Tsuda K, Ito S, Pan X, Nagasaki M, Yasuda J, Yamamoto M. 2014. An efficient quantitation method of next-generation sequencing libraries by using MiSeq sequencer. Anal Biochem 466:27–29. doi: 10.1016/j.ab.2014.08.015. [DOI] [PubMed] [Google Scholar]
- 43.Yi Z, Cohen-Barak O, Hagiwara N, Kingsley PD, Fuchs DA, Erickson DT, Epner EM, Palis J, Brilliant MH. 2006. Sox6 directly silences epsilon globin expression in definitive erythropoiesis. PLoS Genet 2:e14. doi: 10.1371/journal.pgen.0020014. [DOI] [PMC free article] [PubMed] [Google Scholar]
- 44.Wu LC, Sun CW, Ryan TM, Pawlik KM, Ren J, Townes TM. 2006. Correction of sickle cell disease by homologous recombination in embryonic stem cells. Blood 108:1183–1188. doi: 10.1182/blood-2006-02-004812. [DOI] [PMC free article] [PubMed] [Google Scholar]
- 45.Gregory RC, Taxman DJ, Seshasayee D, Kensinger MH, Bieker JJ, Wojchowski DM. 1996. Functional interaction of GATA1 with erythroid Kruppel-like factor and Sp1 at defined erythroid promoters. Blood 87:1793–1801. [PubMed] [Google Scholar]


