

Abstract
Objective
With an increasing incidence of Alzheimer's disease (AD) and neurodegenerative tauopathies, there is an urgent need to develop reliable biomarkers for the diagnosis and monitoring of the disease, such as the recently discovered toxic tau oligomers. Here, we aimed to demonstrate the presence of tau oligomers in the cerebrospinal fluid (CSF) of patients with cognitive deficits, and to determine whether tau oligomers could serve as a potential biomarker for AD.
Methods
A multicentric collaborative study involving a double‐blinded analysis with a total of 98 subjects with moderate to severe AD (N = 41), mild AD (N = 31), and nondemented control subjects (N = 26), and two pilot studies of 33 total patients with AD (N = 19) and control (N = 14) subjects were performed. We carried out biochemical assays to measure oligomeric tau from CSF of these patients with various degrees of cognitive impairment as well as cognitively normal controls.
Results
Using a highly reproducible indirect ELISA method, we found elevated levels of tau oligomers in AD patients compared to age‐matched controls. Western blot analysis confirmed the presence of oligomeric forms of tau in CSF. In addition, the ratio of oligomeric to total tau increased in the order: moderate to severe AD, mild AD, and controls.
Conclusion
These assays are suitable for the analysis of human CSF samples. These results here suggest that CSF tau oligomer measurements could be optimized and added to the panel of CSF biomarkers for the accurate and early detection of AD.
Introduction
Alzheimer's disease (AD), the most common cause of dementia in the elderly, imposes a tremendous socioeconomic burden worldwide.1 Increasing life span has augmented the incidence of AD in developed countries, where the patients are principally at risk of developing this disease with their increasing age. AD, like other neurodegenerative disorders, is caused by the abnormal accumulation of pathogenic protein aggregates. The well‐established pathological hallmarks of AD include plaques, consisting mainly of amyloid‐β (Aβ) peptides, and neurofibrillary tangles, consisting of phosphorylated tau (p‐tau) protein.2 Prior to the manifestation of symptoms and clinical diagnosis, the neurodegenerative processes have already progressed to a relatively advanced stage with marked synaptic loss and neuronal damage.3 A recent study by Rajan et al. has shown that impairment in cognition starts almost 18 years before AD dementia could be clinically diagnosed.4 The distinction between memory decline due to the normal course of aging and early stage AD dementia is so ambiguous that the category of mild cognitive impairment (MCI) has been developed to better characterize the earliest signs of AD.5 The MCI category was initially created to identify the early stages of AD and was primarily based on impairment in memory, but with the advances in research made over time, it was noticeable that some patients with MCI remain stable while others progress to AD.6, 7 Identifying biomarkers at the preclinical stage of AD is essential in properly diagnosing and determining the probability of developing AD. At this point, cerebrospinal fluid (CSF) biomarkers are of great significance, as they reflect the neuropathology of the diseased brain.8
In 2011, the 1984 diagnostic criteria for AD were revised by a work group from the National Institute on Aging and the Alzheimer's Association. In this modified version, imaging and CSF biomarkers have been integrated into the criteria for pathophysiological processes occurring in AD dementia.9 Aβ42, total‐tau (t‐tau), and phosphorylated tau (p‐tau) are now considered the major CSF biomarkers in AD pathogenesis, and they have been included as research criteria for the diagnosis of AD since 2007.10 Apart from these core CSF biomarkers, neurofilament light protein (NFL) and plasma t‐tau have also been reported to be associated with AD.11 CSF surrounds the brain, acting as a protective cushion for the brain and spine, and is in direct contact with the interstitial fluid of the brain. Thus, studying CSF protein profiles may increase the understanding of the pathological changes occurring in the brain. The t‐tau levels are elevated in the CSF of AD and MCI patients as compared to normal controls.12, 13 In contrast, decreased levels of CSF Aβ42, reflecting plaque pathology, have been repeatedly and consistently reported in AD patients.14, 15 Soon after these reports, increased levels of p‐tau were reported in MCI and AD cases compared to healthy controls.16, 17, 18, 19 It has been shown that by measuring the three core CSF AD biomarkers, t‐tau, p‐tau (threonine 181), and Aβ42, a 96.4% detection sensitivity for autopsy‐confirmed AD can be achieved.20 Routine clinical use in a central laboratory found high sensitivity and specificity for AD in over 5000 CSF samples.21 This CSF signature appears to predict conversion from MCI to AD, but did not meet the criteria for correctly diagnosing MCI or predicting preclinical AD cases.20, 22, 23 Elevated levels of total and p‐tau (Thr 181) were also found in the CSF of familial Alzheimer disease (FAD) mutation carriers (presenilin‐1 and APP); these levels were reported as sensitive indicators for presymptomatic AD.24
Despite, the availability of core CSF biomarkers, identification of new biomarkers is highly needed to better understand the molecular mechanism underlying AD pathogenesis, 25, 26 which will aid in AD diagnosis in its preclinical stage.27 An evolving concept in AD research is that the intermediate species in the protein aggregation process, oligomers, are the most noxious entity that causes neuronal toxicity. We have previously demonstrated elevated levels of tau oligomers in the soluble fraction of brain homogenates from patients with AD, Parkinson's disease (PD), and dementia with Lewy body (DLB), using two anti‐tau oligomer‐specific antibodies, T22 (rabbit polyclonal), and TOMA (mouse monoclonal).28, 29 In this study, we aimed to measure the level of CSF tau oligomers in moderate to severe AD, mild AD, and nondemented controls to test the specific hypothesis that the CSF tau oligomer levels are increased in AD compared to controls.
Methods
Pilot studies
CSF samples (AD; N = 19, Co; N = 14) used for indirect enzyme‐linked immunosorbent assay (ELISA) and Western blot analyses were obtained from the Institute for Brain Aging and Dementia (UC Irvine), Prof. John Ringman (Mary S. Easton Center for Alzheimer's Disease Research, UCLA), Prof. Randall Woltjer (Oregon Health and Science University), Prof. Douglas Galasko (Shiley‐Marcos Alzheimer's Disease Research Center, UCSD) (Table 1). MMSE scores are available for all patients. CASI scores are available for the presymptomatic patients (UCLA samples).24 Prior to analyses, CSF samples were thawed on ice. Unused samples were aliquoted and refrozen at −80°C until further analysis.
Table 1.
Demographics and cerebrospinal fluid characteristics of the subjects from pilot studies
| Diagnosis | No. of patients Male/Female | Age (Years) | MMSE Score | Total tau (pg/mL) | pThr181‐tau (pg/mL) | Aβ 42 (pg/mL) |
|---|---|---|---|---|---|---|
| Nondemented control | 6/8 | 79.87 ± 5.15 | 27.33 ± 2.51 | 401 ± 181 | NA | NA |
| AD | 7/12 | 83.85 ± 8.53 | 13.87 ± 10.56* | 852 ± 124 | NA | NA |
Statistical significance of AD and non‐demented control was calculated using Mann‐Whitney test, *P < 0.05.
Subjects included in clinical study
Subjects in the clinical study were recruited from the CSF samples from the Memory clinic, Skåne University Hospital, Sweden, and included moderate to severe AD (N = 41), mild AD (N = 31), and nondemented controls (N = 26). See Table 2 for demographic and biomarker characteristics of the patients included in the study. The individuals were assessed by a medical doctor specialized in dementia disorders and they had undergone brain imaging and routine laboratory testing as well as neurological, psychiatric, and cognitive examinations. Patients diagnosed with AD fulfilled the DSM‐IIIR criteria of dementia30 and the criteria of probable AD defined by NINCDS‐ADRDA.31 The nondemented controls experienced subjective cognitive symptoms at baseline, but thorough clinical investigation as well as clinical follow‐up revealed that they were not affected by a dementia disorder or a neurological disease. Lumbar puncture was performed in all cases as part of routine clinical practice and procedure and analysis of the CSF followed the Alzheimer's Association Flow Chart for CSF biomarkers.32 All individuals have given informed consent for research before their samples were stored in a biobank. A passive consent procedure was then used where consent for retrospective use of banked samples and basic data were assumed if individuals did not actively retract permission, as instructed in local press advertisements. This study procedure was approved by the local ethics committee at Lund University Sweden.
Table 2.
Demographics and cerebrospinal fluid characteristics of the subjects from clinical study
| Diagnosis | No. of patientsMale/Female | Age (Years) | MMSE score | Total tau (pg/mL) | pThr181‐tau (pg/mL) | Aβ 42 (pg/mL) |
|---|---|---|---|---|---|---|
| Nondemented control | 10/16 | 64.24 ± 9.66 | 28.17 ± 1.63 | 378.36 ± 198.76 | 54 ± 17.49 | 582.8 ± 177.27 |
| Mild AD | 7/24 | 74.35 ± 8.0 | 6.27 ± 1.5a | 723.43 ± 277.11b | 101.13 ± 37.47b | 418.30 ± 140.76a |
| Moderate‐severe AD | 13/28 | 76.72 ± 7.14 | 17.8 ± 4.54b | 847.43 ± 378.49b | 105.36 ± 46.10b | 333.92 ± 100.55b |
AD, Alzheimer's disease; Aβ42, amyloid β42 protein; pThr181‐tau, tau phosphorylated at threonine 181; NA, not applicable.
Data are presented as mean±SD (standard deviation). Statistical significance of mild AD and moderate‐severe AD were calculated compared with nondemented controls using Mann‐Whitney test and presented as.
P < 0.001.
P < 0.0001.
Preparation of Aβ oligomers
One mg of lyophilized Aβ42 peptide was dissolved in 1.5 mL of 50% acetonitrile (acetonitrile:water) and divided into three portions, each containing 500 μL (approximately 0.3 mg) and relyophilized. Each tube of 0.3 mg peptide was then dissolved in 200 μL hexafluoroisopropanol (HFIP) and incubated for 10–20 min at room temperature. To this solution, 700 μL dd H2O was added. Tubes were closed with perforated caps allowing HFIP to evaporate. Tubes were then stirred at 500 RPM, using a Teflon‐coated micro stir bar for 36 h in the fume hood at room temperature.
Preparation of recombinant tau oligomers
Recombinant full‐length human tau protein (tau 441, 2N4R, 45.9 kDa) was expressed in an E. coli system and subsequently purified from this system as previously described.33 This recombinant tau was then oligomerized following our published protocol.34 In brief, tau protein was treated with 8M urea to obtain monomers. Aliquots were stored at −20°C. Monomeric tau was then dialyzed against 1X PBS and the final volume was adjusted by adding 1X PBS to a final tau concentration of 0.3 mg/mL. To this, Aβ42 oligomers were added as a seed at a dilution of 1:140 (w/w) and the sample was incubated at room temperature for 1 h on an orbital shaker. This oligomer preparation was purified by fast protein liquid chromatography (FPLC) and used to seed another fresh batch of monomeric tau. This process was continued for another batch (third time) of oligomer preparations to exclude any remaining Aβ42 oligomer seed. After three rounds of tau oligomer preparation, the final sample did not have any Aβ42 oligomer (seed) detected by ELISA since Aβ42/tau ratio was estimated to be <1:2470000. This final tau oligomer preparation was used to generate standard curves as well as a positive control for all the ELISAs performed with CSF samples.
Antibodies
Antibodies against oligomeric tau as well as the total used for Western blot and ELISA are summarized in Table 3.
Table 3.
Tau antibodies used in this study
| Antibody | Epitope | Application | Species | Source |
|---|---|---|---|---|
| T22 | Tau oligomer | Western blot, ELISA | Rabbit | Generated in‐house28; also we made it available from Millipore (#ABN454) |
| TOMA | Tau oligomer | Western blot | Mouse | Generated in‐house43; also we made it available from Millipore (#MABN819) |
| Tau 5 | 210‐230 aa | Western blot, ELISA | Mouse | Biolegend |
| Tau 13 | 20‐35 aa | Western blot | Mouse | Covance |
| Tau 12 | 9‐18 aa | Western blot | Mouse | Biolegend |
| Tau‐46 | 404‐441 aa | Western blot | Mouse | Covance |
| TTC‐35 | Aggregated tau | Western blot | Rabbit | In‐house |
Measuring tau oligomers from CSF samples by ELISA
To measure tau oligomers in CSF samples, 12 μL of CSF sample per well was added with 0.05 mol/L sodium bicarbonate (pH 9.6) as a coating buffer in 96‐well ELISA plates (NUNC, Polysorp). Each sample was plated in duplicates. Plates were incubated overnight at 4°C. Plates were then washed 1 time with TBST buffer (containing 0.01% Tween 20), followed by blocking for 2 h at room temperature with 10% nonfat dry milk prepared in TBST buffer. After washing one time with TBST, 100 μL of T22 (1:250) diluted in 5% nonfat milk prepared in TBST was added and allowed to react for 1 h at room temperature. Plates were then washed three times with TBST buffer. T22 immunoreactivity was detected, using 100 μL of HRP‐conjugated anti‐rabbit IgG (GE Healthcare, Pittsburg, Pennsylvania, United States). The secondary antibody (diluted 1:3000 in 5% nonfat milk in TBST) was added, followed by incubation for 1 h at room temperature. Finally, plates were washed three times with TBST and incubated with 100 μL of 3,3,5,5‐tetramethylbenzidine (TMB‐1 component substrate, from Dako) for 1 h in the dark. The reaction was stopped by adding 100 μL 2mol/L HCl and the plates were read at 450 nm in a Polar Star Omega plate reader (BMG Labtech, Cary, North Carolina, United States). We used calibration curves generated with recombinant tau oligomer. The concentration of recombinant tau was measured by Bicinchoninic Acid Assay (BCA method, Pierce) and then used to generate the calibration curves against T22 and Tau 5 antibodies. The concentrations of total tau and tau oligomers for the samples were obtained from their corresponding calibration curves by performing linear regression analyses, using GraphPad prism 6. Graphs were plotted as median and interquartile ranges.
Western blot analysis of CSF samples
CSF samples from 3 AD patients and 2 controls included in the pilot study were quantified by the BCA method. These CSF samples were loaded and run in 4–12% bis‐tris SDS‐PAGE gels in nonreducing condition so that each sample contained 35 μg of CSF protein. Proteins were transferred onto nitrocellulose membranes. Membranes were first blocked overnight at 4°C in 10% nonfat dry milk prepared in 1X TBS‐T (containing 0.01% Tween 20) buffer and were then incubated with primary antibodies T22 (1:250), TOMA (1:100), TTC‐35 (1:250), Tau 5 (1:500), Tau 13 (1:1000), Tau 12 (1:1000) and Tau 46 (1:500) diluted in 5% nonfat dry milk solution for 1 h at room temperature. After washing three times (5 min each), membranes were probed with their corresponding secondary antibodies diluted in 5% nonfat dry milk for 1 h at room temperature. Membranes were washed three times (first washing for 15 min and next two washes for 5 min). Immunoreactivity with T22 and TTC‐35 was detected with HRP‐conjugated anti‐rabbit IgG (GE Healthcare) and TOMA, Tau5, Tau 13, Tau 12, and Tau 46 immunoreactivities were detected, using HRP‐conjugated anti‐mouse IgG (GE Healthcare). Human α ‐albumin antibody (1:1000) was used as loading control for the CSF samples and its signal was detected, using an HRP‐conjugated anti‐human IgG (GE Healthcare). Finally, ECL plus solution (GE Healthcare) was used for signal detection. Bands from immunoblots were normalized by their corresponding α‐albumin signals, and densitometric quantifications were performed, using ImageJ software, National Institute of Health.
Spike recovery of recombinant tau oligomers
A mixture of pooled CSF samples from 9 control subjects was spiked with two different concentrations of recombinant tau oligomers, 600 pg/mL and 1200 pg/mL (prepared as described earlier). The spiked CSF sample and another aliquot of the same CSF sample mixture without any spike were then analyzed by ELISA, using T22 antibody. Percent recovery of the spike sample was measured as compared with nonspiked sample.
Statistical analysis
All raw data obtained from ELISA assays and Western blot quantifications were first analyzed by Excel. Statistical analyses of these data were performed, using GraphPad prism 6 software. Bar graphs from densitometric quantification for Western blot bands were plotted as median and interquartile ranges and the percentage of oligomeric tau out of total tau were expressed as mean ± standard deviation. The nonparametric Mann–Whitney test was used as a test of significance for the ELISA assays with CSF samples and results were represented as median with interquartile range. To compare the ratio of oligomeric tau to total tau in the CSF between moderate to severe AD, mild AD, and nondemented control groups, ANOVA with Dunnet's multiple comparisons test was used. A cut‐off value of 0.05 was considered significant for statistical analyses.
Results
Oligomeric tau aggregates in AD‐CSF
Western blot analysis of 3 AD and 2 control CSF samples from the pilot study, using the anti‐tau oligomer antibodies T22 and TOMA clearly showed tau oligomers in the AD samples, while the signals in the controls were not as intense (Fig. 1A–F). Tau oligomers detected by these antibodies exhibited different orders of aggregation ranging from 100 kDa in molecular weight and above. The bands observed at 100–150 kDa molecular weight, immunoblotted with T22 and TOMA, appeared to correspond to dimers and/or trimers of tau and were elevated with both the antibodies (P < 0.001). There was no tau detected below the dimer/trimer bands (Fig.S1A and B). Guzman‐Martinez et al. had demonstrated tau oligomers in the platelets of AD patients showing bands between 100 and 190 kDa molecular weights, which is in accordance with our observation.35 Tau aggregates at the dimer or trimer size range have also been observed in synaptosome‐enriched fraction from AD brains.36 Using T22 and TOMA, a few other bands were noted above 250 kDa in AD‐CSF samples, but were not detected in control samples. Densitometric quantification of higher molecular weight bands labeled with T22 and TOMA antibodies (as indicated in blue box) showed significant increase in the AD‐CSF samples (P < 0.05) (Fig 1B and E). Tau5 antibody confirmed the dimer/trimer bands as well as higher molecular weight bands (Fig 1G). It also detected monomeric tau (Fig 2A). Probing with only anti‐rabbit and anti‐mouse secondary antibodies did not show any signal in these CSF samples (Fig 1H and I). Additionally, we tested these CSF samples with two N‐terminal tau antibodies, Tau 13, and Tau 12, C‐terminal antibody Tau 46, and another in‐house rabbit polyclonal antibody, TTC‐35 that recognizes aggregated tau (Fig 2B–E). Tau 13 antibody detected monomeric tau between 60 kDa and 37 kDa molecular weight in both AD and control CSF samples that were not recognized by the anti‐tau oligomeric antibodies. Tau 12 antibody also detected monomer in these samples. Additionally, Tau 46 antibody detected both high‐molecular weight tau and monomeric tau monomer. TTC‐35 antibody reacted with the higher aggregates of tau which was observed only in the two AD‐CSF samples and also with tau dimer/trimer. A much weaker signal is observed at 250 kDa molecular weight in the two AD samples, further verifying the tau oligomers in these CSF samples. We performed two independent pilot studies with ELISA, using T22 antibody to confirm tau oligomers in the CSF samples observed from Western blot. ELISA results were used to quantify tau oligomers interpolated from the calibration curve which was generated against recombinant tau oligomers (Fig 3A and B). Both the studies showed significant presence of tau oligomers in AD‐CSF samples in comparison with control CSF (P = 0.002 and P < 0.0001, respectively).
Figure 1.
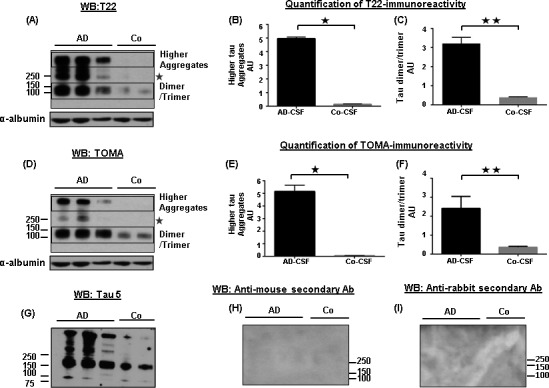
Detection and biochemical characterization of tau oligomers in AD‐CSF. (A, D) Representative Western blots of CSF samples from 3 AD patients and 2 controls with anti‐tau oligomer antibodies, T22 and TOMA. Immunoblotting with T22 and TOMA antibodies clearly showed tau aggregates in AD compared to controls. Tau aggregates of differing molecular weights were noted, ranging from 100 kDa and above. (B, E) Densitometric quantifications of higher molecular weight of tau from the Western blots probed with T22 and TOMA antibodies (indicated in boxes) showed elevated tau oligomers in the AD CSF samples (P = 0.01). (C, F) Densitometric quantifications of dimer/trimer revealed significantly increased tau oligomers in AD (P = 0.005 and P = 0.008, respectively) (indicated in boxes). Bands were normalized with α‐albumin, used as loading control. Bars represent median with interquartile ranges. A comparatively weaker band of tau oligomers was also noticed in the AD‐CSF samples at 250 kDa molecular weight with both T22 and TOMA antibodies (indicated with star). (G) Probing with Tau5 antibody showed co‐localization of signal from dimer/trimer as well as from highest band observed in the blots. (H, I) Anti‐rabbit IgG and anti‐mouse IgG secondary antibodies were used to show the specificity of the antibodies used. AU, arbitrary unit; CSF, cerebrospinal fluid.
Figure 2.
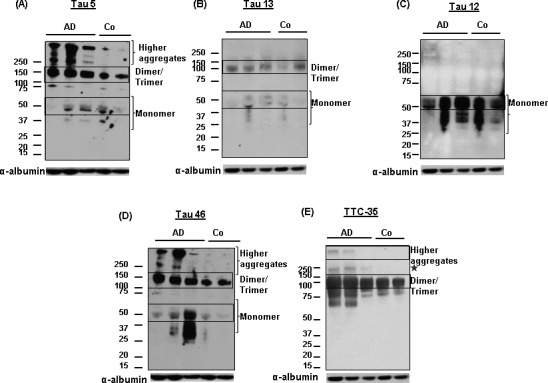
Confirming tau oligomers in CSF from multiple independent studies by biochemical analyses. (A–E) Representative Western blot showing differing orders of tau oligomers versus monomer in CSF, using Tau 5, tau 13, Tau 12, tau, 46 and a rabbit polyclonal antibody TTC‐35. Immunolabeling with rabbit polyclonal TTC‐35 demonstrated the presence of both higher tau aggregates as well as its dimer/trimer (indicated in boxes). Tau 13 antibody detected both tau dimer/trimer and monomer (indicated in boxes). Tau 46 demonstrated high‐molecular weight tau as well as its monomer. Whereas, Tau 12 antibody explicitly demonstrated monomeric tau. A band was noted in AD‐CSF samples at 250 kDa molecular weight (indicated with star) that was also noticed with T22 and TOMA antibodies.CSF, cerebrospinal fluid.
Figure 3.
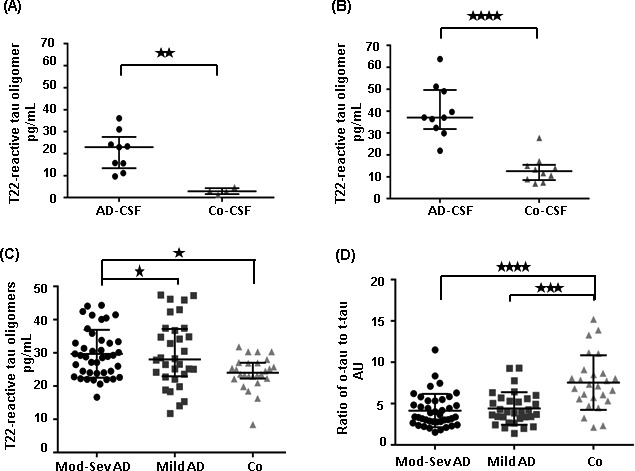
The ratio of tau oligomers to total tau is decreased in AD. (A, B) CSF samples from two independent pilot studies were analyzed by ELISA, using T22 antibody. T22‐reactive tau oligomers from these ELISA assays were then quantified using a standard curve generated against recombinant tau oligomers. AD‐CSF samples clearly showed significant level of tau oligomers as compared to controls (P = 0.002 and P < 0.0001, Mann‐Whitney test). Data points were represented as median with interquartile ranges. (C) A double blinded analysis of large cohort of CSF samples from moderate‐severe AD (N = 41), mild AD (N = 31) and nondemented controls (N = 26) was performed using T22 antibody in ELISA. Tau oligomers were quantified from this analysis using a standard curve generated against recombinant tau oligomers. Tau oligomers were significantly increased in groups of moderate to severe AD and mild AD patients when compared with controls (P < 0.05, Mann–Whitney test). (D) The ratio of oligomeric tau to total was plotted for all the 3 groups of CSF samples. The oligomeric tau to total tau ratio was significantly increased in control groups in comparison with mild AD and then moderate to severe AD groups (P < 0.0001 between both the groups). Data were represented as median with interquartile ranges. One‐way ANOVA with Dunnets's multiple comparisons test was used for statistical analyses.CSF, cerebrospinal fluid. *P < 0.05, **P < 0.01, ***P < 0.001 and ****P < 0.0001.
We quantified the dimer/trimer signal at 100‐150 kDa molecular weight detected by T22, TOMA and Tau 5 antibodies in the Western blot. Intensity values from T22 to Tau 5 signals were compared and percentage of oligomeric tau (mostly at dimer/trimer) was measured. Similar percentage quantification was also performed for oligomeric tau (dimer/trimer) detected by TOMA and Tau 5 antibodies (Supplementary Fig 1D and E). Approximately, 35–40% of the total tau detected by Tau 5 antibody was detected as tau oligomers in AD (P < 0.05 for T22, P < 0.005 for TOMA). To rule out any matrix interference in the CSF sample assay, we spiked the CSF samples with various concentrations of recombinant tau oligomers and the spiked CSF samples were assayed by ELISA for oligomers with around 100% recovery (Fig. S1C).
Finally, we performed a double‐blinded clinical study, including CSF samples from 41 moderate to severe AD, 31 mild AD, and 26 nondemented controls. We measured tau oligomer levels in these samples, using T22 (Fig 3A). The total tau concentration was determined, using sandwich ELISA (Innotest hTAU‐Ag, Innogenetics, Gent, Belgium). Increased levels of tau oligomers were observed in AD samples as compared to the controls (P = 0.01). The ratios of oligomeric tau to total tau were plotted separately for each of the three groups of samples, and we found that the control group had the highest ratio followed by mild AD, whereas the moderate to severe AD group exhibited the lowest value (Fig 3B). The ratio was significantly lower in both the moderate to severe AD and mild AD groups than in the control group (P < 0.0001).
Discussion
AD is a devastating disorder that heavily impacts society, both emotionally and economically. Given the aging population, and the fact that AD is the most common form of dementia in the elderly, it is expected that the prevalence of this grave condition will increase. AD can be definitively diagnosed only after death by combining clinical assessment and the histopathological analysis of the autopsied brain. Earlier, AD was only diagnosed once the clinical symptoms have become sufficiently apparent. This is problematic, because the destructive process of degeneration in the brain begins almost a decade prior to the appearance of the first symptoms.37 This argues almost unequivocally for the significance of identifying tools, techniques or methods to diagnose AD in the preclinical stage. Although the exact mechanism of neurodegeneration is still not known in detail, the role of tau undergoing posttranslational modification, conformational changes and aggregation has received much attention in recent years. The levels of tau in CSF are being used as a complementary biomarker, and the quantification of both t‐tau and p‐tau (threonine 181) have been validated by frequent testing of human CSF samples in several clinical studies. Increased concentration of tau was detected almost 15 years before the onset of symptoms was expected in the CSF of AD patients.38 A growing number of studies point to the roles of oligomeric assemblies of pathogenic proteins in toxicity and propagation of AD. Here, we present our findings from multiple independent studies showing that the levels of CSF tau oligomers are present and are increased in the CSF of AD patients. Tau aggregations at different molecular weights were noticed in these patients. Our observation suggests that tau oligomer levels in human CSF have the potential to serve as a valuable biomarker for AD. We also found increased levels of tau oligomers in AD samples compared to samples from mild AD and controls, and in fact the levels descended in that order. Measurements of both the levels of tau oligomers and the ratio of oligomeric tau to total tau, once reproduced across multiple laboratories using different cohorts, have the potential to serve as an indicator for disease progression.
Although CSF Aβ and tau, with their limitation to standardization and sensitivity, reveal the disease pathology to some extent, only a handful of fluid biomarkers have been identified for AD after extensive research.39 We have previously demonstrated that tau oligomers also act as the pathological species in the disease progression of progressive supranuclear palsy (PSP) patients.40 Moreover, tau oligomers have been identified in cortical and striatal brain regions in patients with other amyloid diseases, such as Huntington's disease.41 These observations further support testing the levels of tau oligomers in the CSF of other tauopathies as well as other neurodegenerative diseases. Although, our results suggest that CSF tau oligomers could be used as a potential biomarker in combination with the core biomarkers, additional studies, especially longitudinal ones, are required. Such studies are critical not only to diagnose the disease pathology more accurately, but also to prepare for evaluating the upcoming and exciting anti tau therapeutic approaches which have been initiated recently in clinical trials.42 Identifying novel CSF biomarkers for AD may supplement the traditional neuropsychological and imaging diagnostic techniques used for early diagnosis, and may become a useful surrogate for evaluating the pharmacological action of therapies targeting AD and other tau‐associated dementias.
Author Contributions
R.K., U.S., E.P., and K.B contributed to the concept and design of the study. K.B., H.Z., E.P., R.W., and D.G. provided the materials for this study. U.S., E.P., K.B., and H.Z. participated in data acquisition. R.K., U.S., and E.P. analyzed and interpreted the data. U.S. and E.P. prepared the figures. R.K and U.S drafted the manuscript. All authors contributed in revising the manuscript.
Conflict of Interest
Rakez Kayed is the inventor of patent and patent applications on the compositions and methods related to tau oligomers and antibodies.
Supporting information
Figure S1. Biochemical quantification of tau oligomers in AD‐CSF samples.
Acknowledgments
We thank Drs. Todd Masel and Tasneem Hasan for editing the manuscript and all the members from Kayed's lab for their helpful suggestions. This work is supported by grant from National Institute of Health RO1AG054025 and UTMB Health Technology Commercialization Program. Samples from Oregon Health and Science University were funded by Alzheimer's Disease Center, NIH NIA P30 AG008017.
References
- 1. Alzheimer's A. Alzheimer's disease facts and figures. Alzheimer's Dement 2015;2015:332–384. [DOI] [PubMed] [Google Scholar]
- 2. Blennow K, de Leon MJ, Zetterberg H. Alzheimer's disease. Lancet 2006;368:387–403. [DOI] [PubMed] [Google Scholar]
- 3. Sperling R, Mormino E, Johnson K. The evolution of preclinical Alzheimer's disease: implications for prevention trials. Neuron 2014;84:608–622. [DOI] [PMC free article] [PubMed] [Google Scholar]
- 4. Rajan KB, Wilson RS, Weuve J, et al. Cognitive impairment 18 years before clinical diagnosis of Alzheimer disease dementia. Neurology 2015;85:898–904. [DOI] [PMC free article] [PubMed] [Google Scholar]
- 5. Mueller SG, Weiner MW, Thal LJ, et al. Ways toward an early diagnosis in Alzheimer's disease: the Alzheimer's Disease Neuroimaging Initiative (ADNI). Alzheimer's Dement 2005;1:55–66. [DOI] [PMC free article] [PubMed] [Google Scholar]
- 6. Petersen RC, Negash S. Mild cognitive impairment: an overview. CNS Spectr 2008;13:45–53. [DOI] [PubMed] [Google Scholar]
- 7. Tarawneh R, Holtzman DM. The clinical problem of symptomatic Alzheimer disease and mild cognitive impairment. Cold Spring Harb Perspect Med 2012;2:a006148. [DOI] [PMC free article] [PubMed] [Google Scholar]
- 8. Berti V, Polito C, Lombardi G, et al. Rethinking on the concept of biomarkers in preclinical Alzheimer's disease. Neurol Sci 2016;37:663. [DOI] [PubMed] [Google Scholar]
- 9. Albert MS, DeKosky ST, Dickson D, et al. The diagnosis of mild cognitive impairment due to Alzheimer's disease: recommendations from the National Institute on Aging‐Alzheimer's Association workgroups on diagnostic guidelines for Alzheimer's disease. Alzheimer's Dement 2011;7:270–279. [DOI] [PMC free article] [PubMed] [Google Scholar]
- 10. Dubois B, Feldman HH, Jacova C, et al. Research criteria for the diagnosis of Alzheimer's disease: revising the NINCDS‐ADRDA criteria. Lancet Neurol 2007;6:734–746. [DOI] [PubMed] [Google Scholar]
- 11. Olsson B, Lautner R, Andreasson U, et al. CSF and blood biomarkers for the diagnosis of Alzheimer's disease: a systematic review and meta‐analysis. Lancet Neurol 2016;15:673–684. [DOI] [PubMed] [Google Scholar]
- 12. Blennow K, Vanmechelen E, Hampel H. CSF total tau, Abeta42 and phosphorylated tau protein as biomarkers for Alzheimer's disease. Mol Neurobiol 2001;24(1–3):87–97. [DOI] [PubMed] [Google Scholar]
- 13. Frankfort SV, Tulner LR, van Campen JP, et al. Amyloid beta protein and tau in cerebrospinal fluid and plasma as biomarkers for dementia: a review of recent literature. Current Clin Pharmacol 2008;3:123–131. [DOI] [PubMed] [Google Scholar]
- 14. Sjogren M, Andreasen N, Blennow K. Advances in the detection of Alzheimer's disease‐use of cerebrospinal fluid biomarkers. Clin Chim Acta 2003;332(1–2):1–10. [DOI] [PubMed] [Google Scholar]
- 15. Spies PE, Verbeek MM, van Groen T, Claassen JA. Reviewing reasons for the decreased CSF Abeta42 concentration in Alzheimer disease. Front Biosci 2012;17:2024–2034. [DOI] [PubMed] [Google Scholar]
- 16. Zetterberg H, Wahlund LO, Blennow K. Cerebrospinal fluid markers for prediction of Alzheimer's disease. Neurosci Lett 2003;352:67–69. [DOI] [PubMed] [Google Scholar]
- 17. Herukka SK, Hallikainen M, Soininen H, Pirttila T. CSF A beta 42 and tau or phosphorylated tau and prediction of progressive mild cognitive impairment. Neurology 2005;64:1294–1297. [DOI] [PubMed] [Google Scholar]
- 18. Buerger K, Ewers M, Pirttila T, et al. CSF phosphorylated tau protein correlates with neocortical neurofibrillary pathology in Alzheimer's disease. Brain 2006;129(Pt 11):3035–3041. [DOI] [PubMed] [Google Scholar]
- 19. Parnetti L, Lanari A, Silvestrelli G, et al. Diagnosing prodromal Alzheimer's disease: role of CSF biochemical markers. Mech Ageing Dev 2006;127:129–132. [DOI] [PubMed] [Google Scholar]
- 20. Shaw LM, Vanderstichele H, Knapik‐Czajka M, et al. Cerebrospinal fluid biomarker signature in Alzheimer's disease neuroimaging initiative subjects. Ann Neurol 2009;65:403–413. [DOI] [PMC free article] [PubMed] [Google Scholar]
- 21. Skillback T, Farahmand BY, Rosen C, et al. Cerebrospinal fluid tau and amyloid‐beta1‐42 in patients with dementia. Brain 2015;138(Pt 9):2716–2731. [DOI] [PubMed] [Google Scholar]
- 22. Dickerson BC, Sperling RA, Hyman BT, et al. Clinical prediction of Alzheimer disease dementia across the spectrum of mild cognitive impairment. Arch Gen Psychiatry 2007;64:1443–1450. [DOI] [PMC free article] [PubMed] [Google Scholar]
- 23. Blom ES, Giedraitis V, Zetterberg H, et al. Rapid progression from mild cognitive impairment to alzheimer's disease in subjects with elevated levels of tau in cerebrospinal fluid and the APOE epsilon4/epsilon4 genotype. Dement Geriatr Cogn Disord 2009;27:458–464. [DOI] [PMC free article] [PubMed] [Google Scholar]
- 24. Ringman JM, Younkin SG, Pratico D, et al. Biochemical markers in persons with preclinical familial Alzheimer disease. Neurology 2008;71:85–92. [DOI] [PMC free article] [PubMed] [Google Scholar]
- 25. Blennow K, Zetterberg H. The past and the future of Alzheimer's disease CSF biomarkers‐a journey toward validated biochemical tests covering the whole spectrum of molecular events. Frontiers in neuroscience. 2015;9:345. [DOI] [PMC free article] [PubMed] [Google Scholar]
- 26. Zetterberg H. Cerebrospinal fluid biomarkers for Alzheimer's disease: current limitations and recent developments. Curr Opin Psychiatry 2015;28:402–409. [DOI] [PubMed] [Google Scholar]
- 27. Babic M, Svob Strac D, Muck‐Seler D, et al. Update on the core and developing cerebrospinal fluid biomarkers for Alzheimer disease. Croat Med J 2014;55:347–365. [DOI] [PMC free article] [PubMed] [Google Scholar]
- 28. Lasagna‐Reeves CA, Castillo‐Carranza DL, Sengupta U, et al. Identification of oligomers at early stages of tau aggregation in Alzheimer's disease. FASEB J. 2012b;26:1946–1959. [DOI] [PMC free article] [PubMed] [Google Scholar]
- 29. Sengupta U, Guerrero‐Munoz MJ, Castillo‐Carranza DL, et al. Pathological Interface between Oligomeric Alpha‐Synuclein and Tau in Synucleinopathies. Biol Psychiatry 2015;78:672. [DOI] [PubMed] [Google Scholar]
- 30. American Psychiatric Association . APA: Diagnostic and statistical manual of mental disorders, 3rd ed.Revised, Washington D.C., American Psychiatric Association; 1987. [Google Scholar]
- 31. McKhann G, Drachman D, Folstein M, et al. Clinical diagnosis of Alzheimer's disease: report of the NINCDS‐ADRDA Work Group under the auspices of Department of Health and Human Services Task Force on Alzheimer's Disease. Neurology 1984;34:939–944. [DOI] [PubMed] [Google Scholar]
- 32. Blennow K, Hampel H, Weiner M, Zetterberg H. Cerebrospinal fluid and plasma biomarkers in Alzheimer disease. Nat Rev Neurol 2010;6:131–144. [DOI] [PubMed] [Google Scholar]
- 33. Margittai M, Langen R. Template‐assisted filament growth by parallel stacking of tau. Proc Natl Acad Sci USA 2004;101:10278–10283. [DOI] [PMC free article] [PubMed] [Google Scholar]
- 34. Lasagna‐Reeves CA, Castillo‐Carranza DL, Guerrero‐Muoz MJ, et al. Preparation and characterization of neurotoxic tau oligomers. Biochemistry 2010;49:10039–10041. [DOI] [PubMed] [Google Scholar]
- 35. Guzman‐Martinez L, Farias GA, Maccioni RB. Tau oligomers as potential targets for Alzheimer's diagnosis and novel drugs. Front Neurol 2013;4:167. [DOI] [PMC free article] [PubMed] [Google Scholar]
- 36. Henkins KM, Sokolow S, Miller CA, et al. Extensive p‐tau pathology and SDS‐stable p‐tau oligomers in Alzheimer's cortical synapses. Brain Pathol 2012;22:826–833. [DOI] [PMC free article] [PubMed] [Google Scholar]
- 37. Rosen C, Hansson O, Blennow K, Zetterberg H. Fluid biomarkers in Alzheimer's disease ‐ current concepts. Mol Neurodegener 2013;8:20. [DOI] [PMC free article] [PubMed] [Google Scholar]
- 38. Bateman RJ, Xiong C, Benzinger TL, et al. Clinical and biomarker changes in dominantly inherited Alzheimer's disease. N Engl J Med 2012;367:795–804. [DOI] [PMC free article] [PubMed] [Google Scholar]
- 39. Galasko D. Expanding the repertoire of biomarkers for alzheimer's disease: targeted and non‐targeted approaches. Front Neurol 2015;6:256. [DOI] [PMC free article] [PubMed] [Google Scholar]
- 40. Gerson JE, Sengupta U, Lasagna‐Reeves CA, et al. Characterization of tau oligomeric seeds in progressive supranuclear palsy. Acta Neuropathol Commun 2014;2:73. [DOI] [PMC free article] [PubMed] [Google Scholar]
- 41. Vuono R, Winder‐Rhodes S, de Silva R, et al. The role of tau in the pathological process and clinical expression of Huntington's disease. Brain 2015;138(Pt 7):1907–1918. [DOI] [PMC free article] [PubMed] [Google Scholar]
- 42. Pedersen JT, Sigurdsson EM. Tau immunotherapy for Alzheimer's disease. Trends Mol Med 2015;21:394–402. [DOI] [PubMed] [Google Scholar]
- 43. Castillo‐Carranza DL, Sengupta U, Guerrero‐Munoz MJ, et al. Passive immunization with Tau oligomer monoclonal antibody reverses tauopathy phenotypes without affecting hyperphosphorylated neurofibrillary tangles. The Journal of neuroscience 2014;34:4260–4272. [DOI] [PMC free article] [PubMed] [Google Scholar]
Associated Data
This section collects any data citations, data availability statements, or supplementary materials included in this article.
Supplementary Materials
Figure S1. Biochemical quantification of tau oligomers in AD‐CSF samples.