

Abstract
Recent evidence indicates that the miRNA biogenesis factors DROSHA, DGCR8, and DICER exert non‐overlapping functions, and have also roles in miRNA‐independent regulatory mechanisms. However, it is currently unknown whether miRNA‐independent functions of DGCR8 play any role in the maintenance of neuronal progenitors and during corticogenesis. Here, by phenotypic comparison of cortices from conditional Dgcr8 and Dicer knockout mice, we show that Dgcr8 deletion, in contrast to Dicer depletion, leads to premature differentiation of neural progenitor cells and overproduction of TBR1‐positive neurons. Remarkably, depletion of miRNAs upon DCGR8 loss is reduced compared to DICER loss, indicating that these phenotypic differences are mediated by miRNA‐independent functions of DGCR8. We show that Dgcr8 mutations induce an earlier and stronger phenotype in the developing nervous system compared to Dicer mutants and that miRNA‐independent functions of DGCR8 are critical for corticogenesis. Finally, our data also suggest that the Microprocessor complex, with DROSHA and DGCR8 as core components, directly regulates the Tbr1 transcript, containing evolutionarily conserved hairpins that resemble miRNA precursors, independently of miRNAs.
Keywords: Dgcr8, microRNAs, murine corticogenesis, neurogenesis, Tbr1
Subject Categories: Neuroscience, RNA Biology
Introduction
The mammalian neocortex is a complex laminar structure composed by multiple cell types that originates from the differentiation of neural progenitor cells (NPCs) in the telencephalon. Corticogenesis requires tight control of self‐renewal, onset of cell fate commitment of NPCs, as well as differentiation, migration, maturation, and survival of their progeny. Understanding the precise regulation of intrinsic pathways and extrinsic factors that orchestrate these processes is crucial to achieve mechanistic insights of both cortical development and evolution 1, 2.
MicroRNAs (miRNAs) are a class of ~22 nt in length, single‐stranded non‐coding RNAs that control the expression of the majority of protein coding genes (targets) 3, 4, 5, 6, 7 and are critical for corticogenesis and early postnatal development 8, 9. In mammals, canonical miRNAs are generally transcribed as immature (stem‐loop containing) precursor RNAs that are cleaved by two RNAse‐III proteins: DROSHA in the nucleus and DICER in the cytoplasm. Mature single‐stranded miRNAs are then loaded onto the RNA‐induced silencing complex (RISC) and bind to target mRNAs; by virtue of this interaction, miRNAs exert their post‐transcriptional effect through repression of translation and/or stability of target mRNAs 10, 11, 12. Conditional genetic knockouts of essential moieties for miRNA biogenesis, such as the “Microprocessor complex” (composed by the type III ribonuclease DROSHA and the RNA‐binding protein DiGeorge syndrome critical region gene 8 (DGCR8), also known as PASHA), or the type III ribonuclease DICER 13, 14, 15, 16 have been widely used to infer the global role of miRNAs in murine corticogenesis. Interestingly, global miRNA depletion by conditional ablation of Dicer leads to gross severe anatomical abnormalities in cortex as the result of impaired NPCs self‐renewal, differentiation, and survival, depending from the developmental onset or cell type in which ablation occurs 9, 17, 18, 19, 20, indicating a crucial role of DICER for corticogenesis.
Although DROSHA, DGCR8, and DICER are essential for miRNA biogenesis, they also have non‐overlapping functions 21, 22, 23, 24, 25, 26. These functions include, but are not limited to, non‐canonical alternative miRNA biogenesis pathways that bypass the Microprocessor complex, but still depend on DICER 11 such as the direct modulation of RNA stability/transcription by the Microprocessor through miRNA‐independent (and DICER‐independent) mechanisms 27 or Microprocessor‐dependent gene regulations that are independent of DROSHA RNA cleavage 28. Some studies investigated the consequences of genetic ablation of Dicer versus Dgcr8 for late‐embryonic and early postnatal mouse brain development 21, 29 or upon knockdown of Drosha in embryonic mouse cortices 30, reporting that these non‐overlapping functions impact on neuronal development. However, the specific contributions of these alternative pathways/functions to cortical neurogenesis still remain largely unknown. In particular, it is not known whether miRNA‐independent functions of DGCR8 are involved in the maintenance of NPCs pools and their differentiation in corticogenesis. Thus, more comparative studies in which Dgcr8, Drosha, Dicer, or Ago(s) mutants are investigated in parallel are needed to understand the significance of these alternative functions in vivo.
Here, by conditional deletion of Dgcr8 or Dicer genes in the mouse telencephalon, we study their specific and non‐overlapping functions on corticogenesis, and in particular on proliferation/commitment of different NPCs subtypes and neurogenesis. Remarkably, conditional deletion of Dgcr8 results in a more premature cortical impairment compared to Dicer ablation. Our results point out an essential miRNA‐independent function of DGCR8 in corticogenesis that might be required for the regulation of target RNAs and suggest that Tbr1 transcript might be one of such potential targets.
Results
Conditional ablation of Dgcr8 in mouse cortical progenitors impairs corticogenesis
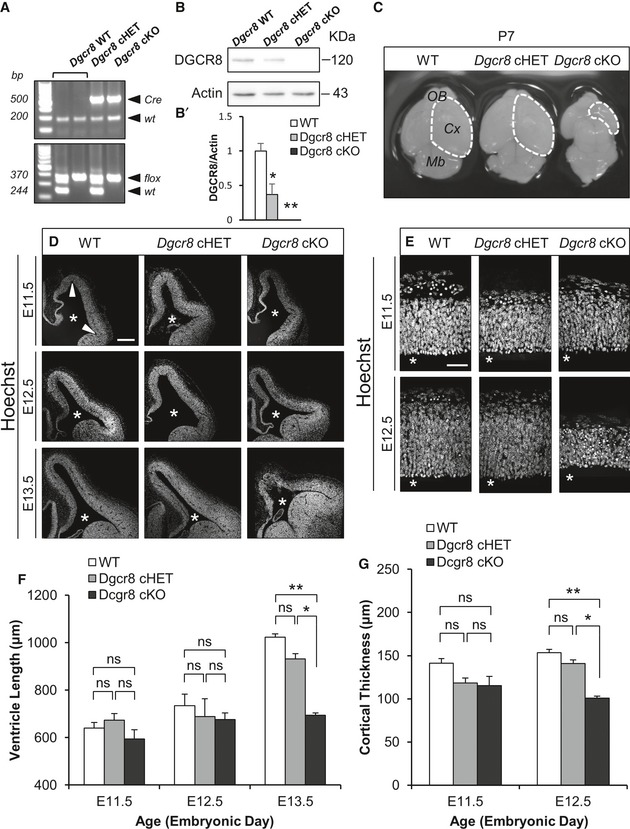
To study the role of DGCR8 in corticogenesis, we conditionally inactivated Dgcr8 gene in apical progenitors cells (APs, a class of cortical NPCs that divide in the Ventricular Zone—VZ—in which we include neuroepithelial and radial glial cells) 1, 31 before the onset of neurogenesis. To this aim, we crossed Dgcr8‐flox mice 32 or Dicer‐flox mice 33 with Emx1‐Cre knock‐in mice 34 and analyzed neocortical development in the resulting embryos (Fig 1A): wild type (WT), heterozygous for Dgcr8‐flox allele (cHET), and conditional knockouts (cKO) for Dicer‐flox (not shown) or Dgcr8‐flox alleles. DGCR8 protein was completely depleted in E13.5 Dgcr8 cKO cortices compared to control cortices (Dgcr8 WT and cHET) of littermate embryos (Fig 1B and B’). Analysis of the gross morphology of postnatal brains of Dgcr8 cKO mice revealed massive hypotrophy of the neocortex and olfactory bulbs, compared to both controls (Fig 1C), indicating a critical role of Dgcr8 during corticogenesis.
Figure 1. Conditional ablation of Dgcr8 by Emx1‐Cre impairs corticogenesis.
-
AGenotyping of the animals used in this study.
-
B, B’Western blot and quantification of DGCR8 and actin expression in E13.5 WT, Dgcr8 cHET, and cKO cortices. Bars are mean ± SEM of three embryos per condition. One‐way ANOVA, *P < 0.05; **P < 0.01.
-
CBrains from P7 WT, Dgcr8 cHET, and cKO mice. Mb, midbrain: Cx, cortex (white dashed line); OB, olfactory bulb.
-
D, EWT, Dgcr8 cHET, and cKO dorsal telencephalon sections stained with Hoechst. Asterisks indicate the ventricular lumen. Scale bars: 200 μm (D) and 50 μm (E).
-
FQuantification of the lateral ventricle surface length (i.e., indicated by the two arrowheads in D) from E11.5 to E13.5. Bars are mean ± SEM of three embryos per condition (18 counted fields per condition). Two‐way ANOVA followed by Tukey's post hoc test, *P < 0.05; **P < 0.01; n.s., not significant.
-
GQuantification of the cortical thickness at embryonic days E11.5 and E12.5. Bars are mean ± SEM of three embryos per condition (18 counted fields per condition). Two‐way ANOVA followed by Tukey's post hoc test, *P < 0.05; **P < 0.01; n.s., not significant.
The ablation of Dicer during corticogenesis was shown to induce massive apoptosis of NPCs and/or neurons 21, 35, 36, 37, 38, 39, 40, 41, 42, 43. Similarly, Dgcr8 ablation in postmitotic neurons of the postnatal mouse neocortex was reported to induce cell death 21. We therefore asked whether cell death occurs upon Dgcr8 deletion in NPCs in our cKO mice. Analysis of cryosections through the dorsal telencephalon of E11.5 to E13.5 WT, Dgcr8 cHET, and Dgcr8 cKO mouse embryos revealed the presence of apoptotic cells from E12.5 in the Dgcr8 cKO cortices, as revealed by pyknotic nuclei and immunoreactivity for activated caspase‐3 44 (Fig EV1A–C). Thus, consistently with our previous observations upon Dicer ablation 36, these results indicated that apoptosis is the main cause for the hypotrophy of the postnatal cortex in Dgcr8 cKO mice.
Figure EV1. Increased apoptosis in the dorsal telencephalon of Dgcr8 cKO embryos from E12.5.
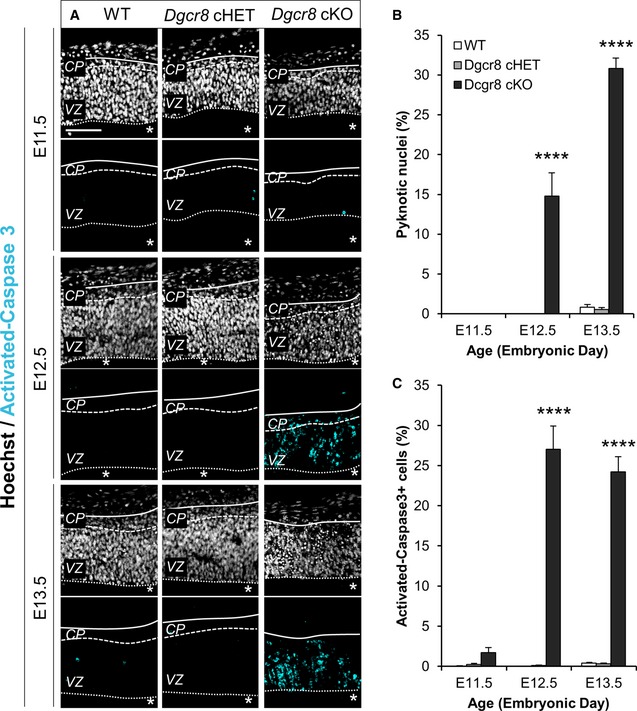
- Fluorescence microscopy images of coronal cryosections through the dorsal telencephalon of E11.5–E13.5 WT, Dgcr8 cHET, and cKO mouse embryos stained for nuclear DNA with Hoechst (white) and anti‐activated caspase‐3 (cyan) antibody. Scale bar: 50 μm. Asterisks indicate the ventricular lumen. Solid and dashed lines indicate cortex boundaries. Cortical plate (CP); ventricular zone (VZ).
- Quantification of pyknotic nuclei in the cortical wall, expressed as a percentage of the total Hoechst‐stained nuclei.
- Quantification of activated caspase‐3+ cells in the cortical wall, expressed as a percentage of the total Hoechst‐stained nuclei.
We then investigated whether ablation of Dgcr8 impaired NPCs expansion, taking into account only alive cells. Ventricular surface length is known to reflect the number of APs present in the VZ of the developing mouse neocortex 1, 31. We have previously shown that this parameter was not altered at E13.5 in Emx1‐Cre Dicer cKO mice 36. In order to ascertain whether this was also the case upon Dgcr8 ablation, we measured ventricular surface length (Fig 1D and F), and cortical wall thickness (Fig 1E and G) in sections of WT, Dgcr8 cHET, and Dgcr8 cKO littermate embryos. The average ventricle length was significantly lower starting from E13.5 (Fig 1D and F), and the cortical wall thickness was significantly smaller at E12.5 (Fig 1E and G) in the telencephalon of Dgcr8 cKO embryos compared to Dgcr8 controls. Given that the ventricular surface length in Dgcr8 cKO cortices was reduced at E13.5, while it was not altered in age‐matched Dicer cKO embryos 36, this result opened the possibility of differential requirements for DGCR8 and DICER for corticogenesis.
Impairment of corticogenesis is more pronounced and premature upon deletion of Dgcr8 than Dicer
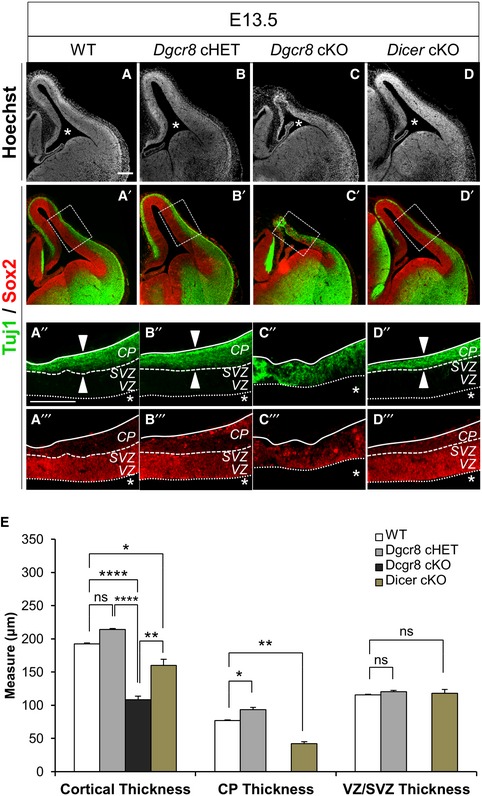
Next, we investigated the architecture and relative proportions of the cortical plate (CP) and progenitors layers (i.e., VZ, and the subventricular zone, SVZ) in Dgcr8‐ versus Dicer‐ablated cortices (Fig 2). Immunofluorescence staining for Tuj1 (pan‐neuronal marker βIII‐tubulin) 45 and Sox2 (stem and progenitor cells marker) 46 was used to identify CP neurons or VZ/SVZ progenitors, respectively. Consistently with previous data 36, a reduction in the neuronal layers thickness was among the earliest detectable phenotypes in the dorsal telencephalon of E13.5 Dicer cKO mouse embryos (Fig 2D–D’’’ and E) compared to WT (Fig 2A–A’’’ and E). In contrast, the structure of the telencephalon was dramatically disorganized in Dgcr8 cKO embryos (Fig 2C–C’’’ and E) compared to both Dicer cKO (Fig 2D–D’’’ and E) and controls cortices (Fig 2A–B’’’ and E). Remarkably, thickness of Dgcr8 cKO cortices (Fig 2C–C’’’ and E) was more reduced than Dicer cKO cortices (Fig 2D–D’’’ and E). Moreover, the onset of cortical disorganization was already detectable at E11.5 in Dgcr8 cKO mice (Appendix Fig S1).
Figure 2. Dgcr8 ablation leads to loss of cortical architecture, while Dicer ablation leads to reduction in neuronal layers.
-
A–D’’’Tuj1 and Sox2 immunofluorescence microscopy images of coronal cryosections through the dorsal telencephalon of E13.5 WT (A, A’), Dgcr8 cHET (B, B’), Dgcr8 cKO (C, C’), and Dicer cKO (D, D’) mouse embryos. (A’’–D’’’) Higher magnification of the brain regions indicated with the dashed boxes in (A’–D’). Scale bar: 200 μm. Asterisks indicate the ventricular lumen. Solid and dashed lines indicate cortex boundaries; white arrowheads indicate cortical plate thickness. Cortical plate (CP); subventricular zone (SVZ); ventricular zone (VZ).
-
EQuantification of the areas of the cortical thickness, the neuronal layer (CP, Tuj1+), and of the germinative (progenitor) layers (VZ/SVZ, Sox2+) from (A’’–D’’’). Bars are mean ± SEM of three embryos per condition (18 counted fields per condition). One‐way ANOVA, *P < 0.05; **P < 0.01; ****P < 0.0001; n.s., not significant.
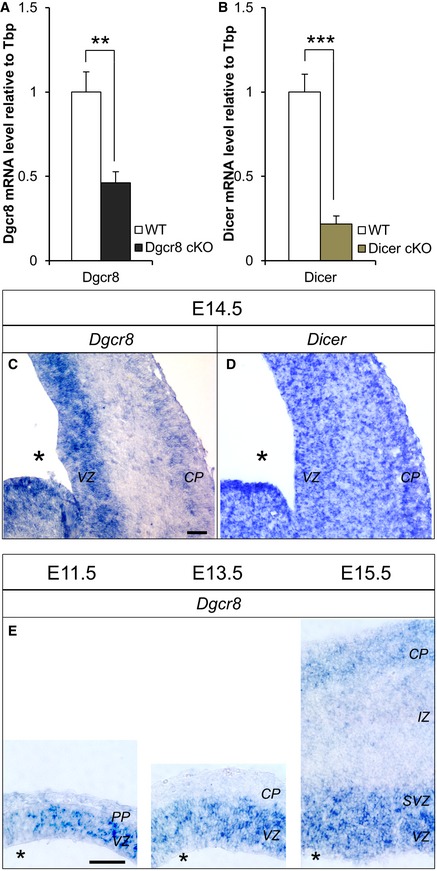
To ascertain whether these phenotypes might arise from different stability of Dgcr8 versus Dicer transcripts upon genetic ablation, we quantified their levels in cortices of E13.5 cKO mice and respective WT littermates by qRT–PCR. This quantification revealed a more dramatic reduction in Dicer transcript than Dgcr8 (Fig EV2A and B). Interestingly, by in situ hybridization we found that Dgcr8 mRNA expression was enriched in the VZ/SVZ (Fig EV2C), while Dicer was expressed throughout the cortical wall (Fig EV2D). Enrichment of Dgcr8 mRNA expression in VZ/SVZ was already detectable at E11.5 and persisted throughout the analyzed stages (Fig EV2E), while its expression in the CP appeared only at E15.5, at lower levels compared to those of VZ/SVZ (Fig EV2E; VZ, CP). These results demonstrate, for the first time in the nervous system, a more premature and pronounced effect upon genetic ablation of Dgcr8 than Dicer and suggest a role of Dgcr8 for the maintenance of NPCs pools and/or differentiation during corticogenesis.
Figure EV2. Quantification of Dicer and Dgcr8 transcript levels in WT and cKO cortices and their expression patterns in WT cortices.
-
A, BqRT–PCR for Dgcr8 (A) or Dicer (B) transcripts in sorted (Tomato+) cells from E13.5 WT, Dgcr8, or Dgcr8 cKO cortices. Bars are mean ± SEM of three embryos per condition (18 counted fields per condition). Unpaired Student's t‐test, **P < 0.01; ***P < 0.001.
-
C–EIn situ hybridization of probes for Dgcr8 (C, E) and Dicer (D) in coronal cryosections through the telencephalon of WT embryos at the indicated developmental times. Scale bars: 500 μm (C, D) and 200 μm (E). Asterisks indicate the ventricular lumen. Solid and dashed lines indicate cortex boundaries. Preplate (PP); cortical plate (CP); subventricular zone (SVZ); ventricular zone (VZ).
Dgcr8 deletion in developing cortex results in increased generation of Tbr1+ neurons
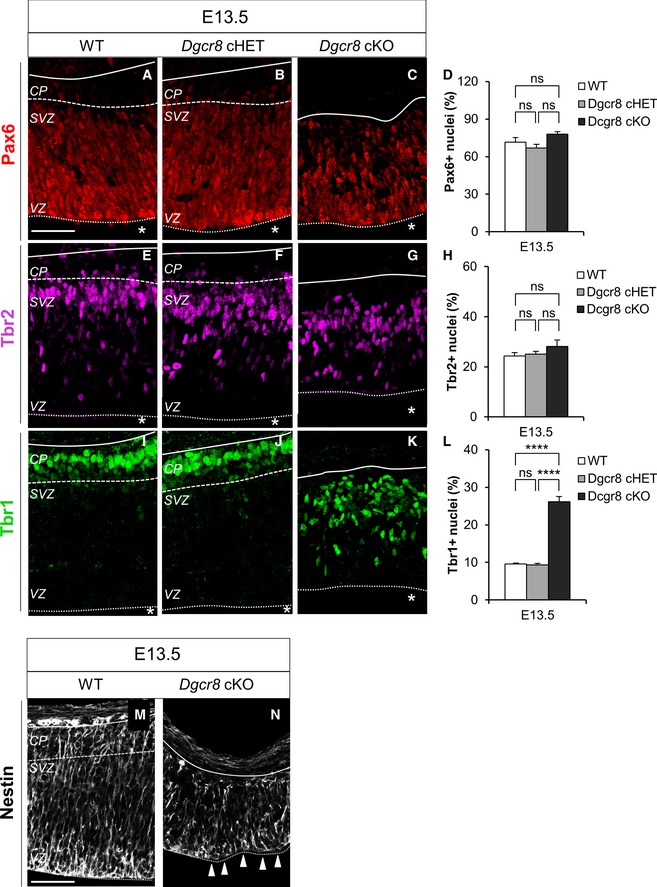
In order to investigate the effect of Dgcr8 deletion for the maintenance and/or differentiation of cortical progenitor pools, we quantified the proportions of apical (APs) and basal (intermediate) progenitors (BPs, progenitors that originate from APs, delaminate from the VZ and divide in the SVZ, in which we include basal progenitors, basal/outer radial glia, and subapical progenitors) 1, 31 and differentiated neurons (Figs 3 and EV3). To this end, we performed immunostaining for the transcription factors Pax6, Tbr2 and Tbr1, markers of APs, BPs, and neurons, respectively 47, 48, 49, in sections of the dorsal telencephalon of E13.5 WT, Dgcr8 cHET, and Dgcr8 cKO mouse embryos (Fig EV3). Interestingly, though we did not find differences in the relative proportions of Pax6+ or Tbr2+ progenitors in cortices of the three Dgcr8 genotypes (Fig EV3A–H), the proportion of Tbr1+ cells was increased threefold in Dgcr8 cKO cortices compared to control embryos (Fig EV3I–L). Moreover, Tbr1+ cells were scattered through the cortical wall of Dgcr8 cKO embryonic cortices (Fig EV3K), in parallel with short and disorganized APs as revealed by immunostaining for radial glial cell marker Nestin (Fig EV3M and N). This result suggests that VZ derangement is the main cause of Tbr1+ cells misplacement upon depletion of DGCR8. The neuronal identity of Tbr1+ cells in Dgcr8 cKO embryos was confirmed by co‐staining with Tuj1 and by lack of co‐labeling with the proliferation marker Mcm2 50 (Appendix Fig S2).
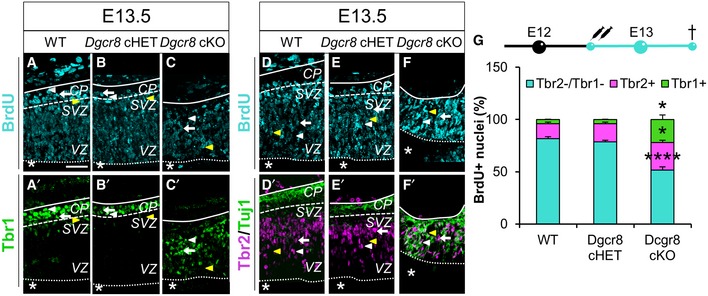
Figure 3. Dgcr8 ablation leads to increased generation of Tbr1+ neurons.
-
A–F’Immunofluorescence microscopy of coronal cryosections through the dorsal telencephalon of E13.5 WT (A, A’, D, D’), Dgcr8 cHET (B, B’, E, E’), and Dgcr8 cKO (C, C’, F, F’) littermate mouse embryos, subjected to two BrdU administrations from E12.5. Double immunostaining for BrdU (A–F, cyan) and Tbr1 (A’–C’, green), or triple immunostaining for BrdU, Tbr2 (D’–F’, magenta), and Tuj1 (D’–F’, green). Arrowheads and arrows indicate categories of counted cells as shown in Appendix Fig S3. Asterisks indicate the ventricular lumen. Solid and dashed lines indicate cortex boundaries. Cortical plate (CP); subventricular zone (SVZ); ventricular zone (VZ). Scale bars: 50 μm.
-
GBrdU injection scheme (up) and quantification (down) of the proportions of Tbr1+ neurons (BrdU+/Tbr1+, green bars), Tbr2+ basal progenitors (BrdU+/Tbr2+, pink bars), and apical progenitors (BrdU+/Tbr1−/Tbr2−, cyan bars) generated in 24 h in similar sections as shown in (A–F’). Apoptotic nuclei are excluded from all the quantifications. Bars are mean ± SEM of three embryos per condition (18 counted fields per condition). One‐way ANOVA, *P < 0.05; ****P < 0.0001.
Figure EV3. Increased proportion of Tbr1+ neurons and no change in total apical and basal progenitors proportions in E13.5 Dgcr8 cKO cortices.
-
A–CImmunofluorescence microscopy of coronal cryosections through the dorsal telencephalon of E13.5 WT (A), Dgcr8 cHET (B), and cKO (C) littermate mouse embryos, showing Pax6 (red) staining.
-
DQuantification of the proportion of Pax6+ apical progenitors in the images shown in (A–C), expressed as a percentage of the total Hoechst‐stained nuclei (not shown).
-
E–GImmunofluorescence microscopy of coronal cryosections through the dorsal telencephalon of E13.5 WT (E), Dgcr8 cHET (F), and cKO (G) littermate mouse embryos, showing Tbr2 (magenta) staining.
-
HQuantification of the proportion of Tbr2+ basal progenitors in the images shown in (E–G), expressed as a percentage of the total Hoechst‐stained nuclei (not shown).
-
I–KImmunofluorescence microscopy of coronal cryosections through the dorsal telencephalon of E13.5 WT (I), Dgcr8 cHET (J), and cKO (K) littermate mouse embryos, showing Tbr1 (green) staining.
-
LQuantification of the proportion of Tbr1+ neurons in the images shown in (I–K), expressed as a percentage of the total Hoechst‐stained nuclei (not shown).
-
M, NImmunostaining for Nestin+ radial glia cells through the dorsal telencephalon of E13.5 WT (M) and Dgcr8 cKO (N) littermate mouse embryos. White arrowheads indicate the disruption of the apical surface organization of the radial glia.
In order to ascertain whether the increased proportion of Tbr1+ neurons upon Dgcr8 ablation might have resulted from increased neurogenesis, we administered Bromodeoxyuridine (BrdU) in WT, Dgcr8 cHET, and Dgcr8 cKO embryos at E12.5 and quantified the proportion of Tbr1+/BrdU+ double‐positive neurons in the dorsal telencephalon at E13.5 (Fig 3A–C’ and G, and Appendix Fig S3A). This quantification revealed a fivefold increase in the proportion of Tbr1+/BrdU+ neurons over total BrdU+ cells in Dgcr8 cKO embryos (Fig 3C–C’ and G, green bar), compared to Dgcr8 controls (Fig 3A–B’ and G, green bars). In the same embryos, we quantified proportion of Tbr2+/BrdU+ BPs over total BrdU+ cells (Fig 3D–G and Appendix Fig S3B) and found that it was significantly higher in Dgcr8 cKO cortices (Fig 3F–G, pink bars) compared to Dgcr8 controls (Fig 3D–E’ and G, pink bars). Finally, to extrapolate the proportion of APs generated during 24 h from BrdU administration, we quantified Tbr2−/Tbr1−/BrdU+ cells over total BrdU+ cells in the same sections and found that this proportion was significantly lower in Dgcr8 cKO cortices compared to Dgcr8 controls (Fig 3G, cyan bars). These data indicate that Dgcr8 ablation increases the generation of Tbr1+ neurons and unbalances maintenance of APs/BPs pools between E12.5 and E13.5.
Opposite effects of Dgcr8 ablation on proliferation of Tbr2+ BPs and Pax6+ APs
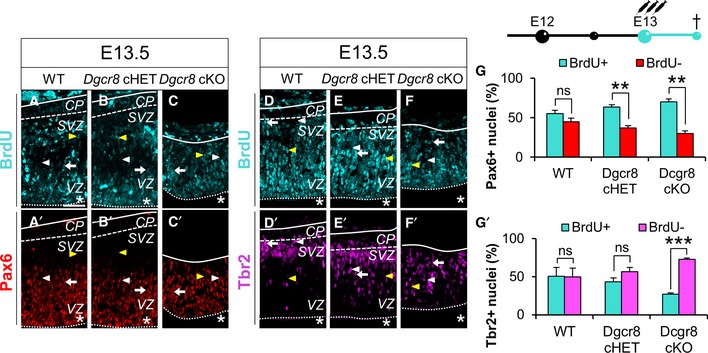
To ascertain which subtype of NPCs was responsible for the overproduction of Tbr1+ neurons in Dgcr8 cKO cortices, we investigated the proliferation of APs and BPs in the dorsal telencephalon of E13.5 WT, Dgcr8 cHET, and Dgcr8 cKO embryos by short BrdU pulses (Fig 4A–G’ and Appendix Fig S3C and D). This analysis revealed an increased proportion of Pax6+/BrdU+ double‐positive cells over the total Pax6+ APs in cortices from Dgcr8 cHET (Fig 4B–B’ and G, cyan bar) and Dgcr8 cKO embryos (Fig 4C–C’ and G, cyan bar), compared to WT littermates (Fig 4A–A’ and G, cyan bar). In contrast, the proportion of Tbr2+/BrdU+ double‐positive cells over the total Tbr2+ BPs was decreased in cortices of Dgcr8 cKO embryos (Fig 4F–G’, cyan bar) compared to both Dgcr8 controls (Fig 4D–E’ and G’, cyan bars). These results indicate that BPs decrease their proliferation while APs increase it upon Dgcr8 ablation. Given that neurogenic NPCs have a longer cell cycle than proliferative ones 51, 52, we concluded that premature differentiation of Tbr2+ BPs cells was accounting for the overproduction of Tbr1+ neurons in Dgcr8‐ablated cortices. We postulate that the increased proliferation of APs (Fig 4G) might represent a compensatory feedback response to BPs drain, thus leading to APs premature consumption (Fig 3G).
Figure 4. Decreased proliferation of Tbr2+ BPs and increased proliferation of Pax6+ APs in Dgcr8 cKO cortices.
-
A–F’Immunofluorescence microscopy of coronal cryosections through the dorsal telencephalon of E13.5 WT (A, A’, D, D’), Dgcr8 cHET (B, B’, E, E’), and Dgcr8 cKO (C, C’, F, F’) littermate mouse embryos, subjected to three BrdU administrations from E13.0. Double immunostaining for BrdU (A–F, cyan) and Pax6 (A’–C’, red) or Tbr2 (D’–F’, magenta). Arrowheads and arrows indicate categories of counted cells as shown in Appendix Fig S3.
-
GBrdU injection scheme (up) and quantification (down) of the proportions of proliferating (BrdU+/Pax6+, cyan bars) and not proliferating apical progenitors (BrdU−/Pax6+, red bars) in similar sections as shown in (A–C’). Asterisks indicate the ventricular lumen. Solid and dashed lines indicate cortex boundaries. Cortical plate (CP); subventricular zone (SVZ); ventricular zone (VZ). Scale bars: 50 μm.
-
G’Quantification of the proportions of proliferating (BrdU+/Tbr2+, cyan bars) and not proliferating basal progenitors (BrdU−/Tbr2+, pink bars) in similar sections as shown in (D–F’).
Upregulation of Tbr1 in newborn cortical neurons is not preceded by changes in Ngn2 expression and is paralleled by defective laminar fate specification in Dgcr8 depleted cortices
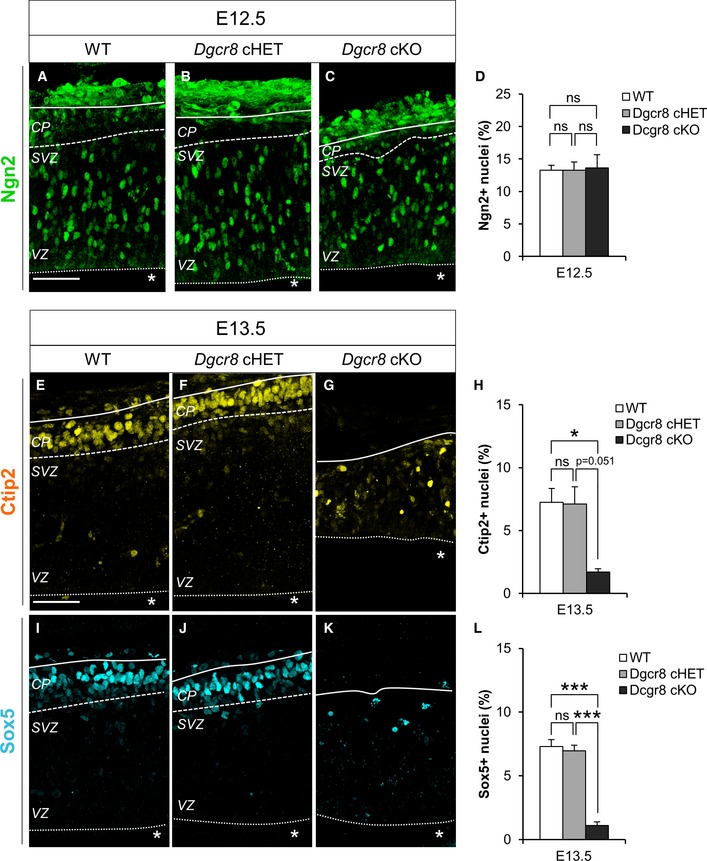
The sequential transcriptional cascade of Pax6, Tbr2, and Tbr1 characterizes cortical neurogenesis 48. The transcription factor Ngn2 is one of the main regulators acting at the top of this cascade. Both Tbr2 and Tbr1 are under the control of Ngn2 53, 54: in developing mice, overexpression of Ngn2 was shown to induce the expression of Tbr1 54 and Ngn2 −/− mutants display reduced Tbr1 expression. In addition, Ngn2 mRNA is destabilized by DROSHA during corticogenesis through a miRNA‐independent post‐transcriptional mechanism 30. In order to investigate whether altered expression of Ngn2 in NPCs could account for the increased number of Tbr1+ neurons and/or for the unbalance of APs/BPs pools observed upon Dgcr8 ablation, we quantified the proportion of Ngn2+ cells in cortices of E12.5 WT, Dgcr8 cHET, and cKO embryos and found no difference (Fig 5A–D). This result indicates that altered Ngn2 expression does not account for the increased generation of Tbr1+ neurons in Dgcr8‐depleted cortices.
Figure 5. Dgcr8 ablation does not alter Ngn2 levels, but downregulates Ctip2 and Sox5 expression in newborn neurons.
-
A–CImmunofluorescence microscopy of coronal cryosections through the dorsal telencephalon of E12.5 WT, Dgcr8 cHET, and Dgcr8 cKO littermate mouse embryos, showing Ngn2 (green) staining.
-
DQuantification of the proportion of Ngn2+ cells, expressed as a percentage of the total Hoechst‐stained nuclei (not shown).
-
E–GImmunofluorescence microscopy of coronal cryosections through the dorsal telencephalon of E13.5 WT, Dgcr8 cHET, and Dgcr8 cKO littermate mouse embryos, showing Ctip2 (yellow) staining.
-
HQuantification of the proportion of Ctip2+ neurons, expressed as a percentage of the total Hoechst‐stained nuclei (not shown).
-
I–KImmunofluorescence microscopy of coronal cryosections through the dorsal telencephalon of E13.5 WT, Dgcr8 cHET, and Dgcr8 cKO littermate mouse embryos, showing Sox5 (cyan) staining.
-
LQuantification of the proportion of Sox5+ neurons, expressed as a percentage of the total Hoechst‐stained nuclei (not shown).
During corticogenesis, subsequent waves of cortical projection neurons are specified and born accumulating in an “inside‐out” pattern in the growing cortical plate, thus giving rise to the six‐layered structure of the mammalian neocortex 55. Tbr1 is known to directly regulate the specification of the deep‐layer six neurons and to orchestrate, together with Ctip2 and Sox5, the laminar fate choices of newly generated cortical neurons 49, 56. To investigate whether laminar fate specification of Tbr1+ neurons was altered upon Dgcr8 ablation, we examined the expression of the transcription factors Ctip2 and Sox5, markers of deep‐layer neurons 57 in cortices of E13.5 WT, Dgcr8 cHET, and Dgcr8 cKO embryos (Fig 5E–L). This analysis revealed a strong decrease in the proportion of both Ctip2+ (Fig 5G and H) and Sox5+ (Fig 5K and L) neurons in Dgcr8 cKO compared to Dgcr8 control embryos (Fig 5E, F, H–J and L).
In sum, these results indicate that Dgcr8 ablation increases generation of Tbr1 positive neurons without changes in Ngn2 expression and alters laminar fate specification of newborn cortical neurons.
miRNA‐independent functions of DGCR8 are required for proper corticogenesis
To identify the molecular mechanisms underlying the phenotypes observed in Dgcr8‐ablated cortices, we first asked whether miRNAs depletion in cortices of Dgcr8 and Dicer cKOs embryos paralleled the severity of the respective phenotypes (Fig 2). To this aim, we isolated total RNA from E13.5 WT, Dgcr8 cHET, Dgcr8 cKO, and Dicer cKO cortices and analyzed libraries of the small RNAs fraction by deep sequencing. Remarkably, we found (out of the total genome‐aligned small RNAs reads obtained in the different libraries; Fig 6A) a more severe depletion of total miRNA reads (i.e., ~75% decrease) in Dicer cKO, compared to Dgcr8 cHET (i.e., ~15% decrease) and Dgcr8 cKO (~35% decrease) (Fig 6B). These results were consistent with previous profiling of miRNAs from Dicer‐ and Dgcr8‐ablated mouse embryonic stem (ES) cells and postnatal brains 21, 22, 23. Remarkably, given that the severity of the phenotypes observed in Dgcr8 and Dicer cKO cortices (Fig 2) was inversely proportional to the residual miRNAs upon Dgcr8 and Dicer deletion (Fig 6B), we postulate that the molecular mechanisms underlying DGCR8 functions in corticogenesis are likely miRNA‐independent.
Figure 6. Aligned miRNA reads in normalized libraries from Dicer cKO and Dgcr8 cKO E13.5 embryonic neocortex.
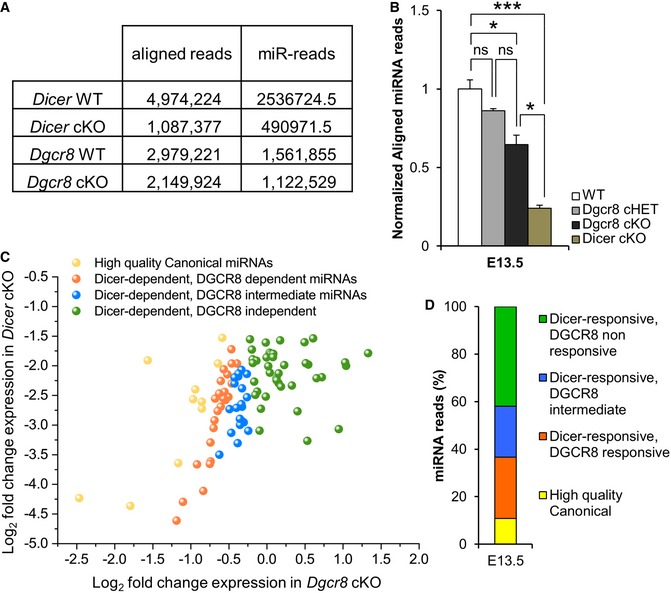
- Unique, genome‐mapping reads from each library.
- Read counts for all genome‐aligned miRNA sequences identified in WT, Dgcr8 cHET, Dgcr8 cKO, and Dicer cKO E13.5 cortices. Data are the mean of 2–4 libraries per condition; bars indicate the variation of the cortices from the mean (SEM). One‐way ANOVA, *P < 0.05; ***P < 0.001; n.s., not significant.
- Each axis indicates the following quotient: read counts from mutant library/read count from wild‐type library, with read counts normalized to the number of snoRNA‐derived reads from that library. Log2 fold regulation decrease < 1.5 in Dicer cKO libraries and < 0.25 in Dgcr8 cKO libraries defined enzyme dependence. miRNAs were categorized in consideration of their dependencies on both Dicer and DGCR8, and are color coded according to the key.
- Fraction (expressed as the % over the total number of miRNAs identified) of Dicer‐responsive, differentially DGCR8‐responsive miRNAs annotated from miRBase release 20.
Next, we also analyzed our libraries to determine DGCR8 vs. DICER responsiveness of the genome‐aligned miRNA sequence reads. Reasoning that Dicer ablation inhibits the biogenesis of nearly all (canonical and non‐canonical) miRNAs, while ablation of Dgcr8 inhibits the biogenesis of canonical miRNAs only 11, 58, we plotted the expression fold‐change values (log2) between each mutant versus WT, and classified miRNAs into four categories according to their responsiveness to DGCR8 and/or DICER (Fig 6C and D). This analysis revealed that the majority of miRNAs (i.e., 58% of reads) were responsive to both DICER and DGCR8, and thus, we classified this group as “canonical miRNAs”. Another group of miRNAs was Dgcr8 non‐responsive and Dicer‐responsive and thus defined as “non‐canonical miRNAs”. In total, we identified 39 bona fide non‐canonical miRNAs (Table EV1). Consistently, eight of them (Fig EV4) were previously classified as non‐canonical miRNAs also in ES cells or in postmitotic neurons 21, 22, 23, 25, 59.
Figure EV4. Classification of DGCR8 and/or DICER‐responsive miRNAs in deep‐sequenced small RNA libraries from E13.5 WT, Dgcr8, and Dicer cKO cortices.
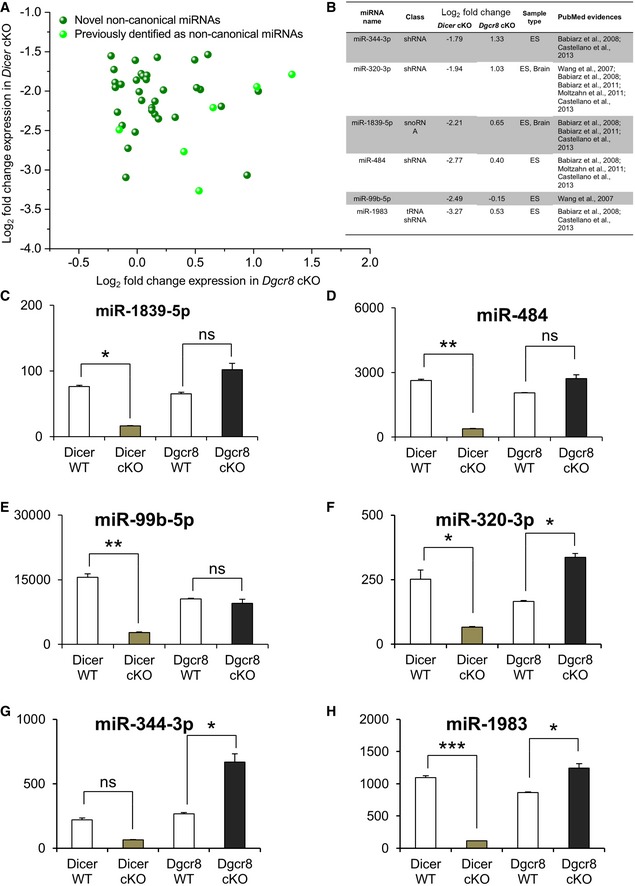
-
A, BDeep‐sequencing log2 fold‐change data of Dicer‐responsive, DGCR8 non‐responsive (i.e., non‐canonical) miRNAs. Axes indicate read counts from cKO library over read counts from WT library. Reads are normalized to snoRNA reads in each library. Light green points (A) and table in (B) indicate previously identified non‐canonical miRNAs.
-
C–HRepresentative read counts of the non‐canonical miRNAs identified in this study. Data are the mean of 2 libraries per condition; error bars indicate the mean variation of the reads in libraries from the two cortices (SEM). One‐way ANOVA, *P < 0.05; **P < 0.01; ***P < 0.001; n.s., not significant.
DGCR8 regulates Tbr1 expression independent of miRNAs
Alternative miRNA‐independent functions of the Microprocessor have been previously reported in other contexts 21, 24, 26, 30, 60, 61, 62, 63, 64, 65. In particular, it has been shown that the Microprocessor protein DROSHA, by cleaving hairpin structures resembling those of pri‐miRNAs, can regulate RNA transcripts independently of miRNAs, eventually leading to RNA target destabilization 30, 58, 60, 66, 67, 68.
Altered Ngn2 level could not account for the increased expression of Tbr1 observed in Dgcr8 cKO cortices (Figs 3, 5, and EV3), suggesting that Tbr1 expression might be regulated at the post‐transcriptional level. Thus, it is possible to hypothesize that DGCR8 loss might cause depletion of some critical miRNAs for Tbr1 expression that DICER loss does not, or in alternative that Tbr1 mRNA could be a target of miRNA‐independent DGCR8‐dependent function.
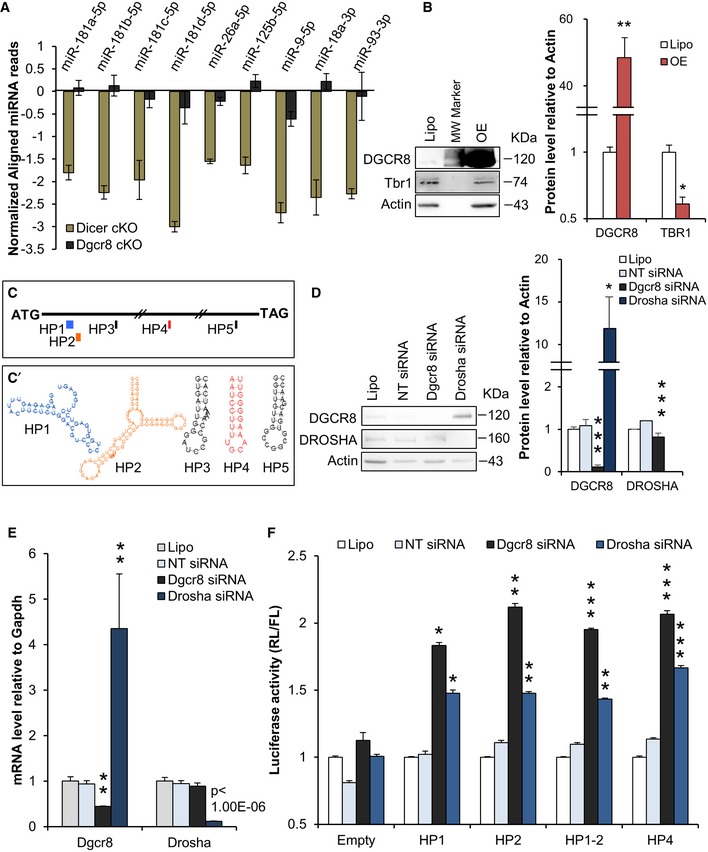
We first analyzed the expression levels of the experimentally supported miRNAs known to target Tbr1 mRNA (TarBase, Fig 7A) or predicted to target Tbr1 (Targetscan, miRanda, Appendix Fig S4). We found that all these miRNAs were more downregulated in Dicer cKO compared to Dgcr8 cKO cortices (Fig 7A and Appendix Fig S4), thus excluding loss of this subset of miRNAs as cause of increased Tbr1 expression. Next, in order to ascertain whether Dgcr8 manipulation can modulate Tbr1 expression levels, we overexpressed Dgcr8 in murine N2A cells. Two days post‐transfection, we found that DGCR8 overexpression leads to decrease in TBR1 protein level (Fig 7B), indicating the DGCR8 can regulate Tbr1 expression in these cells.
Figure 7. The Microprocessor regulates Tbr1 expression likely by targeting evolutionarily conserved hairpin structures in its transcript.
-
ARead counts of experimentally validated miRNAs targeting the Tbr1 transcript in E13.5 Dicer cKO and Dgcr8 cKO cortices.
-
BWestern blot and quantification of DGCR8, TBR1, and actin expression in N2A cells upon DGCR8 overexpression.
-
CPosition of the 5 predicted hairpins (HPs) in Tbr1 mRNA coding sequence (ATG‐TAG, black thin segment).
-
C’Predicted secondary structures of the 5 HPs (color code as in C).
-
DWestern blot and quantification of DGCR8, DROSHA, and actin expression in N2A cells upon Dgcr8 or Drosha knockdown.
-
EqRT–PCR analysis of endogenous Dgcr8 and Drosha mRNA in N2A cells upon Dgcr8 or Drosha knockdown.
-
FN2A cells transfected with Dgcr8, Drosha, or control (NT) siRNAs, respectively, co‐transfected with vectors described in (C) and (C’).
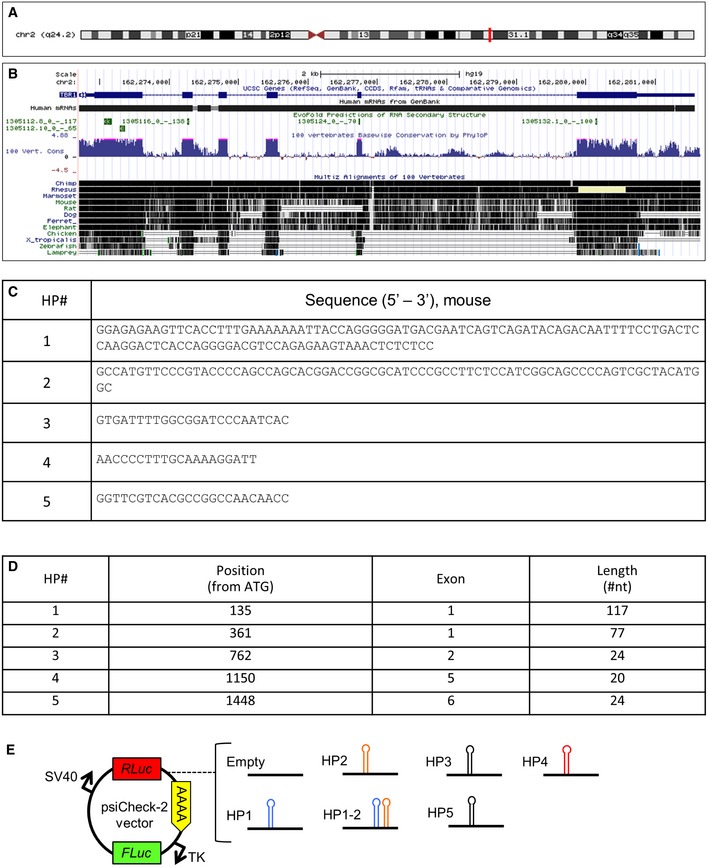
We then searched for evolutionarily conserved secondary structures within Tbr1 mRNA following a previously published approach 30 and found five predicted evolutionarily conserved stem‐loop hairpin structures (HP1–5), all lying in the coding sequence (Fig 7C–C’ and Fig EV5A–D). To investigate whether these structures could be substrate for the Microprocessor function, we cloned each of the five HP, plus one sequence containing the first two HPs (which are very close to each other), downstream of Renilla luciferase (RL) in the psiCheck‐2 plasmid (encoding also for firefly luciferase (FL) used for normalization, Fig EV5E) and transfected them in N2A cells. Knockdown of Dgcr8 and Drosha (Fig 7D and E) did not alter RL/FL ratio in cells transfected with control (empty, Fig 7F) plasmid. In contrast, Dgcr8 and Drosha knockdown increased RL/FL ratio in cells transfected with psiCheck‐2 plasmids containing HP1 (>16%), HP2 (>40%), HP1‐2 (>45%), or HP4 (>53%), respectively (Fig 7F). These data suggest that the Microprocessor complex can exert a repressive function on Tbr1 mRNA by a post‐transcriptional/miRNA‐independent mechanism.
Figure EV5. Evolutionary conservation of the hairpins in the Tbr1 transcript.
-
A, BLocation of the Tbr1 gene on human chromosome 2 (A, red line), and Tbr1 mRNA (B, black solid line; GenBank), position of the 5 predicted hairpins (B, green boxes; EvoFold), and evolutionary conservation of the 5 hairpins in vertebrates (B, blue; PhyloP) and multiple alignment (black) of vertebrate Tbr1 genes (B, black lines).
-
CSequences of the 5 predicted hairpins (HPs) subject of this study (mouse).
-
DLength of the 5 HPs and their position in the Tbr1 mRNA.
-
ESchematic representation of the psiCheck‐2 luciferase plasmids empty or containing the different Tbr1 HPs.
Discussion
Our study clearly demonstrates that DGCR8 exerts essential functions in corticogenesis that are non‐overlapping with those of DICER. Indeed, for the first time in the nervous system, here we show that conditional ablation of Dgcr8 results in a more premature and severe phenotype compared to Dicer. In particular, we find that Dgcr8 is essential for progenitor pools maintenance and differentiation during early corticogenesis. Remarkably, these distinct phenotypes are not paralleled by a greater depletion of miRNAs upon Dgcr8 ablation compared to Dicer. Moreover, our data suggest that the Microprocessor complex can regulate TBR1 expression by a post‐transcriptional/miRNA‐independent mechanism. Thereby, here we propose that miRNA‐independent functions of DGCR8 are critically required for proper corticogenesis.
Mutants for miRNA biogenesis genes, such as Drosha, Dgcr8, Dicer, and Ago(s) are a widely used approach to infer miRNA functions in vivo, reviewed in 9. However, based on the assumption that mutants for genes that share common pathways result in similar phenotypes, and on the prevailing knowledge that canonical miRNAs account for the vast majority of the total miRNAs 23, most of these studies did not perform comparative studies on different knockouts in brain. Moreover, the few comparative studies in brain or other tissues/cell types have so far revealed milder or equal phenotypes in Microprocessor mutants compared to Dicer mutants 27. Here, by showing that Dgcr8 and Dicer mutants have distinct non‐overlapping phenotypes in the developing telencephalon, we demonstrate that the impact of alternative/miRNA‐independent functions of the Microprocessor 21, 24, 28, 30, 60, 61, 62, 63, 64, 65, 68 has been so far underestimated in corticogenesis. Our study thus paves the way to further comparative investigations of Dgcr8 vs. Dicer mutants in other developmental times/tissues.
Our results indicate that Dgcr8 deletion alters NPCs proliferation and leads to a dramatic overproduction of Tbr1 (and TUJ1)‐positive neurons 36, 38. Specifically, the premature cell cycle exit of BPs accounts for the overproduction of these neurons upon conditional knockout of Dgcr8. Thus, here we postulate that in early corticogenesis DGCR8 might control the maintenance of APs/BPs pools to prevent their premature consumption, while DICER primarily controls the differentiation of newborn neurons 36. This scenario would be consistent with the enriched expression pattern of Dgcr8 mRNA in the VZ/SVZ and with the mild effect of Dicer depletion on NPCs expansion [36 and this study].
Our data suggest that DGCR8 regulates TBR1 level post‐transcriptionally, possibly by targeting hairpin structures in its transcript, thus extending the emerging notion that alternative functions of the Microprocessor are required for corticogenesis 30. However, and differently from the study of Knuckles et al, we did not find any difference in Ngn2 levels. This result might be explained by the existence of distinct Microprocessor complexes, bearing different affinities for targets (such as pri‐miRNAs or mRNAs or subsets). Indeed, a recent study indicated that TDP‐43 (TAR DNA‐binding protein 43), a RNA‐binding protein implicated in RNA metabolism and accessory component of Microprocessor complex, may be the factor that regulates the affinity of DROSHA complex for Ngn2 mRNA in cells undergoing neuronal differentiation. Interestingly, TDP‐43 was dispensable for DROSHA‐mediated DGCR8 regulation, whereas it was essential for Ngn2 expression control 68. We therefore speculate that DGCR8 and TDP‐43 might form distinct Microprocessor complexes, with different affinities for certain target RNAs that, by influencing the target‐specificity of DROSHA cleavage, fine tune cortical neurogenesis. Further studies will be needed to identify targets and mechanisms of these DGCR8‐dependent regulations in cortical development. Moreover, here we also provide novel insight of different miRNAs biogenesis pathways during cortical development. In particular, we find that, in contrast to other tissues/cell types where canonical miRNAs typically account for about 90% of the total 23, the proportions of canonical and non‐canonical miRNAs seem roughly similar in developing cortex. This potentially remarkable finding, however, warrants future validation, given that the incomplete depletion of DGCR8 protein (e.g., below detection limit of the anti‐DGCR8 immuno‐blotting, see Fig 1) might account in part for the residual miRNAs observed in Dgcr8 cKO mice.
Finally, our results have crucial implications for the study of the DiGeorge syndrome (also known as 22q11.2 deletion syndrome). This syndrome is caused by the hemizygous deletion of several genes, among which Dgcr8 69; it is characterized by altered corticogenesis, neurogenesis 70, and cognitive deficits, among other symptoms 71. However, so far the haploinsufficiency of Dgcr8 or miRNAs has not been addressed as cause of early cortical defects. Perhaps, the investigation of alternative miRNA‐independent function of DGCR8 in mouse models of DiGeorge syndrome might shed new light toward the identification of the molecular mechanism underlying defective corticogenesis of one of the most common genetic syndromes in humans.
Materials and Methods
Mouse lines and genotyping
Mice were housed under standard conditions at Istituto Italiano di Tecnologia (IIT), Genoa, Italy. All experiments and procedures were approved by the Italian Ministry of Health (Permits No. 057/2013 and 214/2015‐PR) and IIT Animal Use Committee, in accordance with the Guide for the Care and Use of Laboratory Animals of the European Community Council Directives. Emx1 Cre/wt knock‐in mice 34 were crossed with Dicer flox/flox mice 33 and genotyped, as previously described 36. Dgcr8 flox/flox mice 32 were crossed with Emx1 Cre/wt knock‐in mice to obtain Dgcr8 flox/wt/Emx1 Cre/wt. Conditional ablation of Dgcr8 gene was performed by crossing Dgcr8 flox/flox mice with Dgcr8 flox/wt Emx1 Cre/wt mice. Mice resulting from these crossings were used for the experiments and are listed hereunder: Dgcr8 flox/wt Emx1 wt/wt, Dgcr8 flox/flox Emx1 wt/wt (controls); Dgcr8 flox/wt Emx1 Cre/wt (conditional Dgcr8 heterozygous); Dgcr8 flox/flox Emx1 Cre/wt (conditional Dgcr8 knockout). Dgcr8‐flox and WT alleles were genotyped by PCR with the following primers: Dgcr8‐Fwd 5′‐GACATCAATCTGAGTAGAGACAGG‐3′ and Dgcr8‐Rev 5′‐CAGATGGTAACTAACCTGCCAACC‐3′, annealed at 60°C and resulting in PCR fragments of 244 (WT) or 370 (flox) base pairs. For timed mating vaginal plug day was defined as E0.5.
BrdU labeling, immunofluorescence, in situ hybridization, and imaging
BrdU labeling was carried out by intraperitoneal injections of pregnant females at the indicated dpc as previously published 36. Mice were sacrificed at the indicated time points after the first BrdU injection. Coronal cryosections (18–20 μm) through the fixed brains were prepared at the indicated ages, and processed for immunofluorescence or in situ hybridization on brain cryosections was performed as previously described 36. Immunofluorescence was performed by re‐hydrating cryosections in 1× PBS and subsequently permeabilizing them with progressive steps in 0.3–0.1% Triton in 1× PBS (PBST). Cryosections were subjected to antigen retrieval (when specified, Table EV2) with 10 mM citric acid at pH 6.0 for 10 min at 95°C, followed by 20–30 minutes of cooling and extensive washing in 0.1% PBST at RT. Blocking was performed in 0.1% PBST/5% normal goat serum for 1 h. Sections were then incubated with primary antibodies diluted in blocking solution for 14–16 h at 4°C in the darkness, washed extensively, and incubated with secondary antibodies diluted in blocking solution for 2 h. Progressive washing steps in 0.1% PBST and then 1× PBS were performed, and sections were incubated with Hoechst (1:300 in 1× PBS from a stock solution of 1 mg/ml in dimethyl sulfoxide, DMSO, Sigma) for 30 min in the darkness, extensively washed in 1× PBS, mounted with ProLong Gold Antifade (Invitrogen), air‐dried overnight in the darkness, and sealed with nail polish (Electron Microscopy Sciences). For BrdU staining, the procedure above described was applied with modifications: after the first steps of hydration, the sections were (when specified) directly subjected to antigen retrieval with 100 μM citric acid for 30 min at 80°C, followed by cooling down for 20–30 min. BrdU unmasking was performed by incubating cryosections in 2N HCl for 30 minutes at 30.2°C, followed by extensive washing in 1× PBS. Antibodies and conditions are specified in Table EV2. Brain slices were mounted with ProLong Gold Antifade (Invitrogen‐Thermo Fisher Scientific) and coverslipped. Fluorescence images were acquired with BX51 microscope (Olympus) equipped with Neurolucida stage and software (MBF Bioscience), or with LiveScan Swept Field Confocal Microscope (SFC), Nikon and analyzed with Nikon software version 4.11.0 (NIS Elements Viewer), ImageJ version 1.48u (Wayne Rasband, National Institutes of Health, USA), or Photoshop CS4 (Adobe). Black boxes were added outside the cortical tissue subjected to the analysis in immunofluorescence images in order to cover debris or tissue from the contralateral hemisphere or, in the case of Dgcr8 cKO embryonic neocortices (smaller than control littermates), to prepare figure panels with identical size. In situ hybridization on brain cryosections was performed as previously described 36 with minor changes. Riboprobes for Dgcr8 and Dicer were synthesized from PCR‐amplified cDNAs with SP6 and T7 RNA polymerases (Promega) with DIG‐labeled nucleotides (Roche) following manufacturer's instructions. Probes were purified with RNAeasy mini kit (Qiagen) following manufacturer's instructions. Probes were used at the final concentration of 50 ng/ml in hybridization solution, pre‐hybridization, hybridization, and washing steps were performed at 70°C.
Quantification and analysis of embryonic dorsal telencephalon immunofluorescence images
Immunopositive cells for the indicated markers were counted through the depth of the telencephalic wall, and their numbers expressed as a proportion of total cell populations as indicated in figures and legends. For all the presented quantifications, data from each condition are the mean of 18 counted fields per condition (three embryos, three cryosections along the rostro‐caudal axis per embryo, two fields per cryosections). The cortical wall thickness was estimated to the nearest 12.5 μm along the side of each counting; three brains were counted per condition; three sections along the rostro‐caudal axis were counted per brain. For the evaluation of the ventricular length, the distance from the pallial–subpallial boundary to the dorsal‐most point of the telencephalon was measured; three brains were counted per condition; three sections along the rostro‐caudal axis were counted per brain. For cells counts, comparisons between control and Dgcr8‐ablated or Dicer‐ablated animals involved littermate or aged matched embryos; considering the size differences between control and Dgcr8‐ or Dicer‐ablated embryonic dorsal telencephalon that emerged during development, care was taken that corresponding regions were analyzed and that the fields compared covered the same amount of ventricular surface.
Fluorescence‐activated cell sorting (FACS), RNA extraction, cDNA preparation, and quantitative real‐time PCR
To assess Dgcr8 flox recombination, Dicer flox Emx1 Cre and Dgcr8 flox Emx1Cre mice were crossed with Td‐Tomato flox/flox mice (Jackson laboratory stock number 007908) 72. Cortices were dissociated with the Neural Tissue Dissociation Kit (P) 130‐092‐628 (Miltenyi). Cells were collected from E13.5 embryos and were sorted by FACS, separating Tomato+ from Tomato− subpopulations.
For miRNA profiling, total RNA was extracted from the dorsal telencephalon of WT, Dgcr8 cHET, Dgcr8 cKO, and Dicer cKO E13.5 littermate embryos (two embryos per condition) with RNeasy micro kit (Qiagen) according to the manufacturer's instructions. Total RNA was extracted from FACS‐sorted Tomato+ cells of E13.5 WT, and Dicer cKO and Dgcr8 cKO embryos and N2A cells using QIAzol lysis reagent (Qiagen). Synthesis of cDNA from total RNA was performed with ImProm‐II™ Reverse Transcription System (Promega). Quantitative real‐time PCR (qRT–PCR) was performed using Quantifast SYBR Green method (Qiagen) with probes listed in Table EV3. Expression analysis was performed using the comparative cycle threshold (Ct) method.
Deep sequencing and analysis of small RNAs
The Illumina® TruSeq™ Small RNA Sample preparation kit was used to prepare and sequence total small RNA species, following manufacturer's instructions. Sequencing pipeline was performed at the Center for Genomic Science of IIT@SEMM as previously published 73. Among small RNAs classes, snoRNAs proportions were stable between the samples and thus were chosen for normalization. We determined the enzyme dependencies for the genome‐aligned miRNA sequences reads to which at least 50 reads from the WT data set mapper: Those were identified as miRNAs robustly expressed and evaluated according to the read number from WT versus mutant samples. Canonical and non‐canonical miRNAs were then evaluated according to the read number obtained in WT samples and then classified according to their processing dependencies in mutant samples. The DGCR8 and Dicer dependences of miRNAs were then considered concurrently. To classify each miRNA as Dicer‐ and DGCR8‐dependent (i.e., canonical), we required at least a −1.5 log2 fold regulation decrease in the number of reads in Dicer cKO mutant background, and at least −0.25 log2 fold regulation decrease in the number of reads in Dgcr8 cKO mutant background. To classify each miRNA as Dicer‐dependent and DGCR8‐independent (i.e., non‐canonical), we required at least a −1.5 log2 fold regulation decrease in the number of reads in Dicer cKO mutant background, and more than −0.25 log2 fold regulation decrease in the number of reads in Dgcr8 cKO mutant background. The analysis of Tbr1‐targeting miRNAs (predicted or experimentally associated) was conducted with the three software packages TarBase, TargetScan (taking in account only miRNAs having at least a context score of −0.2), and miRanda 74, 75. The deep‐sequencing data from this publication have been submitted to the NCBI GEO database 76 assigned the identifier GSE82069.
Plasmids and cloning
The putative Tbr1 hairpin sequences were identified as previously described 30 taking advantage of EvoFold 77, with the secondary structure prediction program RNAfold 78 and cloned between the Renilla luciferase coding region and its synthetic poly(A) in the psiCheck‐2 plasmid (Promega) by GeneArt™ (Thermo Fisher Scientific). Dgcr8 cDNA was PCR amplified and cloned into pCAGGS vector.
Cell culture, transfection, luciferase assay, and Western blotting
N2A cells were maintained at standard conditions, 50 nM of control siRNAs, or Dgcr8 or Drosha siRNA (cat # D‐001206‐14, M‐051364‐00, M‐065630‐03 Dharmacon) were reverse transfected with Lipofectamine 2000 (Invitrogen), according to the manufacturer's protocol. The next day, cells were transfected with psiCheck‐2 vectors. Two days after siRNA transfection, cells were harvested for RNA extraction or lysed for analysis of Renilla and firefly luciferase activities with Dual Luciferase Assay System (Promega). For total protein extraction, embryonic neocortices or cell pellets were homogenized in RIPA buffer. Cortices were sonicated (10 short pulses) and left on ice for 15 min. Neocortices or cell pellets were clarified by centrifugation at 20,000 g, and the protein concentration was determined using a Bradford Assay kit (Bio‐Rad). For blot analysis, equal amounts of protein were run on Mini‐PROTEAN® TGX™ Precast Gels (Bio‐Rad) and transferred on nitrocellulose membranes (GE Healthcare). Membranes were probed with rabbit anti‐DGCR8 (Proteintech, 10996‐1‐AP, 1:1,000), rabbit anti‐DROSHA (Cell Signaling, D28B1; 1:1,000), rabbit anti Tbr1 (Abcam, ab31940; 1:1,000), and rabbit anti‐actin (Sigma, A2066; 1:5,000) followed by HRP‐conjugated secondary antibody anti‐rabbit (Invitrogen, A16104; 1:2,000). LAS 4000 Mini Imaging System (GE Healthcare) was used to digitally acquire chemiluminescence signals, and the band intensities were quantified using Fiji. The specificity of antibodies to DGCR8 and DROSHA was verified on N2A cells transfected with Dgcr8 siRNA or Drosha siRNA, respectively.
Statistical analysis
Data are expressed as mean ± standard error of the mean (SEM) for all quantifications and assays. Differences between groups were tested for statistical significance, where appropriate using one‐way analysis of variance (ANOVA) or two‐way ANOVA followed by Tukey's post hoc testing. Statistical analysis of luciferase assays results was conducted by two‐tailed paired Student's t‐test. Significance was expressed as follows: *P‐value < 0.05; **P‐value < 0.01; ***P‐value < 0.001; ****P‐value < 0.0001; n.s., not significant.
Author contributions
DDPT conceived, supervised, and coordinated the project. FNio Co‐supervised FM during the initial experiments. Investigation: FM performed all the experiments; NH carried out the experiments in Figs 4, 5A–H and EV3M–N; RP performed the Western blots in Figs 1 and 7; MJM carried out and analyzed deep‐sequencing experiments under FN supervision; FM prepared all the Figures; HA prepared the data in Figs 6C and EV4A; FM and HA performed the Formal Analysis; DDPT and FM co‐wrote the manuscript. All authors approved the final version of the manuscript.
Conflict of interest
The authors declare that they have no conflict of interest.
Supporting information
Appendix
Expanded View Figures PDF
Table EV1
Table EV2
Table EV3
Review Process File
Acknowledgements
We thank Drs. G Hannon (Cold Spring Harbor Laboratory, MA, USA), E. Fuchs (Rockefeller Univ. NY, USA), and S. Itohara (RIKEN, Wako, Japan) for kindly providing Dicer‐flox, Dgcr8‐flox, and Emx1‐Cre mouse lines, respectively. We thank Dr. M. Nanni, C. Gasperini, and the IIT‐NBT technical staff (Drs. M. Pesce and E. Albanesi) for help with some experiments, and the staff of IIT Animal Facility (F. Piccardi, and Dr. M. Morini) for excellent assistance in animal experiments. We thank Dr. E. Taverna (Max Planck Institute for Evolutionary Anthropology, Germany) for critical reading of the manuscript. FN was supported by the European Research Executive Agency (REA) through the FP7‐PEOPLE‐2010‐RG “miRNAs/22q11DS” (No. 268298). DDPT and FN were supported by intramural funds of Fondazione Istituto Italiano di Tecnologia (IIT).
EMBO Reports (2017) 18: 603–618
References
- 1. Kriegstein A, Noctor S, Martínez‐Cerdeño V (2006) Patterns of neural stem and progenitor cell division may underlie evolutionary cortical expansion. Nat Rev Neurosci 7: 883–890 [DOI] [PubMed] [Google Scholar]
- 2. Taverna E, Götz M, Huttner WB (2014) The cell biology of neurogenesis: toward an understanding of the development and evolution of the neocortex. Annu Rev Cell Dev Biol 30: 465–502 [DOI] [PubMed] [Google Scholar]
- 3. Lee RC, Feinbaum RL, Ambros V (1993) The C. elegans heterochronic gene lin‐4 encodes small RNAs with antisense complementarity to lin‐14. Cell 75: 843–854. [DOI] [PubMed] [Google Scholar]
- 4. Reinhart BJ, Slack FJ, Basson M, Pasquinelli AE, Bettinger JC, Rougvie AE, Horvitz HR, Ruvkun G (2000) The 21‐nucleotide let‐7 RNA regulates developmental timing in Caenorhabditis elegans . Nature 403: 901–906 [DOI] [PubMed] [Google Scholar]
- 5. Pasquinelli AE, Reinhart BJ, Slack F, Martindale MQ, Kuroda MI, Maller B, Hayward DC, Ball EE, Degnan B, Müller P et al (2000) Conservation of the sequence and temporal expression of let‐7 heterochronic regulatory RNA. Nature 408: 86–89 [DOI] [PubMed] [Google Scholar]
- 6. Wightman B, Ha I, Ruvkun G (1993) Posttranscriptional regulation of the heterochronic gene lin‐14 by lin‐4 mediates temporal pattern formation in C. elegans . Cell 75: 855–862 [DOI] [PubMed] [Google Scholar]
- 7. Friedman RC, Farh KK‐H, Burge CB, Bartel DP (2009) Most mammalian mRNAs are conserved targets of microRNAs. Genome Res 19: 92–105 [DOI] [PMC free article] [PubMed] [Google Scholar]
- 8. Aksoy‐Aksel A, Zampa F, Schratt G (2014) MicroRNAs and synaptic plasticity–a mutual relationship. Philos Trans R Soc Lond B Biol Sci 369: 20130515 [DOI] [PMC free article] [PubMed] [Google Scholar]
- 9. Barca‐Mayo O, De Pietri Tonelli D (2014) Convergent microRNA actions coordinate neocortical development. Cell Mol Life Sci 71: 2975–2995 [DOI] [PMC free article] [PubMed] [Google Scholar]
- 10. Filipowicz W, Sonenberg N (2015) The long unfinished march towards understanding microRNA‐mediated repression. RNA 21: 519–524 [DOI] [PMC free article] [PubMed] [Google Scholar]
- 11. Ha M, Kim VN (2014) Regulation of microRNA biogenesis. Nat Rev Mol Cell Biol 15: 509–524 [DOI] [PubMed] [Google Scholar]
- 12. Krol J, Loedige I, Filipowicz W (2010) The widespread regulation of microRNA biogenesis, function and decay. Nat Rev Genet 11: 597–610 [DOI] [PubMed] [Google Scholar]
- 13. Denli AM, Tops BBJ, Plasterk RHA, Ketting RF, Hannon GJ (2004) Processing of primary microRNAs by the Microprocessor complex. Nature 432: 231–235 [DOI] [PubMed] [Google Scholar]
- 14. Gregory RI, Yan K‐P, Amuthan G, Chendrimada T, Doratotaj B, Cooch N, Shiekhattar R (2004) The Microprocessor complex mediates the genesis of microRNAs. Nature 432: 235–240 [DOI] [PubMed] [Google Scholar]
- 15. Han J, Lee Y, Yeom K‐H, Kim Y‐K, Jin H, Kim VN (2004) The Drosha‐DGCR8 complex in primary microRNA processing. Genes Dev 18: 3016–3027 [DOI] [PMC free article] [PubMed] [Google Scholar]
- 16. Landthaler M, Yalcin A, Tuschl T (2004) The human DiGeorge syndrome critical region gene 8 and Its D. melanogaster homolog are required for miRNA biogenesis. Curr Biol 14: 2162–2167 [DOI] [PubMed] [Google Scholar]
- 17. Shenoy A, Danial M, Blelloch RH (2015) Let‐7 and miR‐125 cooperate to prime progenitors for astrogliogenesis. EMBO J 34: 1180–1194 [DOI] [PMC free article] [PubMed] [Google Scholar]
- 18. Zhang C, Ge X, Liu Q, Jiang M, Li MW, Li H (2015) MicroRNA‐mediated non‐cell‐autonomous regulation of cortical radial glial transformation revealed by a Dicer1 knockout mouse model. Glia 63: 860–876 [DOI] [PubMed] [Google Scholar]
- 19. Petri R, Malmevik J, Fasching L, Åkerblom M, Jakobsson J (2014) MiRNAs in brain development. Exp Cell Res 321: 84–89 [DOI] [PubMed] [Google Scholar]
- 20. Howng S‐YB, Huang Y, Ptáček L, Fu Y‐H (2015) Understanding the role of dicer in astrocyte development. PLoS One 10: e0126667 [DOI] [PMC free article] [PubMed] [Google Scholar]
- 21. Babiarz JE, Hsu R, Melton C, Thomas M, Ullian EM, Blelloch R (2011) A role for noncanonical microRNAs in the mammalian brain revealed by phenotypic differences in Dgcr8 versus Dicer1 knockouts and small RNA sequencing. RNA 17: 1489–1501 [DOI] [PMC free article] [PubMed] [Google Scholar]
- 22. Babiarz JE, Ruby JG, Wang Y, Bartel DP, Blelloch R (2008) Mouse ES cells express endogenous shRNAs, siRNAs, and other Microprocessor‐independent, Dicer‐dependent small RNAs. Genes Dev 22: 2773–2785 [DOI] [PMC free article] [PubMed] [Google Scholar]
- 23. Castellano L, Stebbing J (2013) Deep sequencing of small RNAs identifies canonical and non‐canonical miRNA and endogenous siRNAs in mammalian somatic tissues. Nucleic Acids Res 41: 3339–3351 [DOI] [PMC free article] [PubMed] [Google Scholar]
- 24. Dhir A, Dhir S, Proudfoot NJ, Jopling CL (2015) Microprocessor mediates transcriptional termination in genes encoding long noncoding microRNAs. Nat Struct Mol Biol 22: 319–327 [DOI] [PMC free article] [PubMed] [Google Scholar]
- 25. Wang Y, Medvid R, Melton C, Jaenisch R, Blelloch R (2007) DGCR8 is essential for microRNA biogenesis and silencing of embryonic stem cell self‐renewal. Nat Genet 39: 380–385 [DOI] [PMC free article] [PubMed] [Google Scholar]
- 26. Macias S, Cordiner RA, Gautier P, Plass M, Cáceres JF (2015) DGCR8 acts as an adaptor for the exosome complex to degrade double‐stranded structured RNAs. Mol Cell 60: 873–885 [DOI] [PMC free article] [PubMed] [Google Scholar]
- 27. Yang J‐S, Lai EC (2011) Alternative miRNA biogenesis pathways and the interpretation of core miRNA pathway mutants. Mol Cell 43: 892–903 [DOI] [PMC free article] [PubMed] [Google Scholar]
- 28. Gromak N, Dienstbier M, Macias S, Plass M, Eyras E, Cáceres JF, Proudfoot NJ (2013) Drosha regulates gene expression independently of RNA cleavage function. Cell Rep 5: 1499–1510 [DOI] [PMC free article] [PubMed] [Google Scholar]
- 29. Hsu R, Schofield CM, Dela Cruz CG, Jones‐Davis DM, Blelloch R, Ullian EM (2012) Loss of microRNAs in pyramidal neurons leads to specific changes in inhibitory synaptic transmission in the prefrontal cortex. Mol Cell Neurosci 50: 283–292 [DOI] [PMC free article] [PubMed] [Google Scholar]
- 30. Knuckles P, Vogt MA, Lugert S, Milo M, Chong MMW, Hautbergue GM, Wilson SA, Littman DR, Taylor V (2012) Drosha regulates neurogenesis by controlling neurogenin 2 expression independent of microRNAs. Nat Neurosci 15: 962–969 [DOI] [PubMed] [Google Scholar]
- 31. Götz M, Huttner WB (2005) The cell biology of neurogenesis. Nat Rev Mol Cell Biol 6: 777–788 [DOI] [PubMed] [Google Scholar]
- 32. Yi R, Pasolli HA, Landthaler M, Hafner M, Ojo T, Sheridan R, Sander C, O'Carroll D, Stoffel M, Tuschl T et al (2009) DGCR8‐dependent microRNA biogenesis is essential for skin development. Proc Natl Acad Sci USA 106: 498–502 [DOI] [PMC free article] [PubMed] [Google Scholar]
- 33. Murchison EP, Partridge JF, Tam OH, Cheloufi S, Hannon GJ (2005) Characterization of Dicer‐deficient murine embryonic stem cells. Proc Natl Acad Sci USA 102: 12135–12140 [DOI] [PMC free article] [PubMed] [Google Scholar]
- 34. Iwasato T, Datwani A, Wolf AM, Nishiyama H, Taguchi Y, Tonegawa S, Knöpfel T, Erzurumlu RS, Itohara S (2000) Cortex‐restricted disruption of NMDAR1 impairs neuronal patterns in the barrel cortex. Nature 406: 726–731 [DOI] [PMC free article] [PubMed] [Google Scholar]
- 35. Davis TH, Cuellar TL, Koch SM, Barker AJ, Harfe BD, McManus MT, Ullian EM (2008) Conditional loss of Dicer disrupts cellular and tissue morphogenesis in the cortex and hippocampus. J Neurosci 28: 4322–4330 [DOI] [PMC free article] [PubMed] [Google Scholar]
- 36. De Pietri Tonelli D, Pulvers JN, Haffner C, Murchison EP, Hannon GJ, Huttner WB (2008) miRNAs are essential for survival and differentiation of newborn neurons but not for expansion of neural progenitors during early neurogenesis in the mouse embryonic neocortex. Development 135: 3911–3921 [DOI] [PMC free article] [PubMed] [Google Scholar]
- 37. Hong J, Zhang H, Kawase‐Koga Y, Sun T (2013) MicroRNA function is required for neurite outgrowth of mature neurons in the mouse postnatal cerebral cortex. Front Cell Neurosci 7: 151 [DOI] [PMC free article] [PubMed] [Google Scholar]
- 38. Kawase‐Koga Y, Otaegi G, Sun T (2009) Different timings of Dicer deletion affect neurogenesis and gliogenesis in the developing mouse central nervous system. Dev Dyn 238: 2800–2812 [DOI] [PMC free article] [PubMed] [Google Scholar]
- 39. Li Q, Bian S, Hong J, Kawase‐Koga Y, Zhu E, Zheng Y, Yang L, Sun T (2011) Timing specific requirement of microRNA function is essential for embryonic and postnatal hippocampal development. PLoS One 6: e26000 [DOI] [PMC free article] [PubMed] [Google Scholar]
- 40. Makeyev EV, Zhang J, Carrasco MA, Maniatis T (2007) The MicroRNA miR‐124 promotes neuronal differentiation by triggering brain‐specific alternative pre‐mRNA splicing. Mol Cell 27: 435–448 [DOI] [PMC free article] [PubMed] [Google Scholar]
- 41. McLoughlin HS, Fineberg SK, Ghosh LL, Tecedor L, Davidson BL (2012) Dicer is required for proliferation, viability, migration and differentiation in corticoneurogenesis. Neuroscience 223: 285–295 [DOI] [PMC free article] [PubMed] [Google Scholar]
- 42. Nowakowski TJ, Mysiak KS, Pratt T, Price DJ (2011) Functional dicer is necessary for appropriate specification of radial glia during early development of mouse telencephalon. PLoS One 6: e23013 [DOI] [PMC free article] [PubMed] [Google Scholar]
- 43. Saurat N, Andersson T, Vasistha NA, Molnár Z, Livesey FJ (2013) Dicer is required for neural stem cell multipotency and lineage progression during cerebral cortex development. Neural Dev 8: 14 [DOI] [PMC free article] [PubMed] [Google Scholar]
- 44. Galluzzi L, Aaronson SA, Abrams J, Alnemri ES, Andrews DW, Baehrecke EH, Bazan NG, Blagosklonny MV, Blomgren K, Borner C et al (2009) Guidelines for the use and interpretation of assays for monitoring cell death in higher eukaryotes. Cell Death Differ 16: 1093–1107 [DOI] [PMC free article] [PubMed] [Google Scholar]
- 45. Menezes JR, Luskin MB (1994) Expression of neuron‐specific tubulin defines a novel population in the proliferative layers of the developing telencephalon. J Neurosci 14: 5399–5416 [DOI] [PMC free article] [PubMed] [Google Scholar]
- 46. Bani‐Yaghoub M, Tremblay RG, Lei JX, Zhang D, Zurakowski B, Sandhu JK, Smith B, Ribecco‐Lutkiewicz M, Kennedy J, Walker PR et al (2006) Role of Sox2 in the development of the mouse neocortex. Dev Biol 295: 52–66 [DOI] [PubMed] [Google Scholar]
- 47. Götz M, Barde Y‐A (2005) Radial glial cells defined and major intermediates between embryonic stem cells and CNS neurons. Neuron 46: 369–372 [DOI] [PubMed] [Google Scholar]
- 48. Englund C, Fink A, Lau C, Pham D, Daza RAM, Bulfone A, Kowalczyk T, Hevner RF (2005) Pax6, Tbr2, and Tbr1 are expressed sequentially by radial glia, intermediate progenitor cells, and postmitotic neurons in developing neocortex. J Neurosci 25: 247–251 [DOI] [PMC free article] [PubMed] [Google Scholar]
- 49. Hevner RF, Shi L, Justice N, Hsueh Y‐P, Sheng M, Smiga S, Bulfone A, Goffinet AM, Campagnoni AT, Rubenstein JL (2001) Tbr1 regulates differentiation of the preplate and layer 6. Neuron 29: 353–366 [DOI] [PubMed] [Google Scholar]
- 50. Hanna‐Morris A, Badvie S, Cohen P, McCullough T, Andreyev HJN, Allen‐Mersh TG (2009) Minichromosome maintenance protein 2 (MCM2) is a stronger discriminator of increased proliferation in mucosa adjacent to colorectal cancer than Ki‐67. J Clin Pathol 62: 325–330 [DOI] [PubMed] [Google Scholar]
- 51. Caviness VS, Takahashi T, Nowakowski RS (1995) Numbers, time and neocortical neuronogenesis: a general developmental and evolutionary model. Trends Neurosci 18: 379–383 [DOI] [PubMed] [Google Scholar]
- 52. Takahashi T, Nowakowski RS, Caviness VS (1995) The cell cycle of the pseudostratified ventricular epithelium of the embryonic murine cerebral wall. J Neurosci 15: 6046–6057 [DOI] [PMC free article] [PubMed] [Google Scholar]
- 53. Ochiai W, Nakatani S, Takahara T, Kainuma M, Masaoka M, Minobe S, Namihira M, Nakashima K, Sakakibara A, Ogawa M et al (2009) Periventricular notch activation and asymmetric Ngn2 and Tbr2 expression in pair‐generated neocortical daughter cells. Mol Cell Neurosci 40: 225–233 [DOI] [PubMed] [Google Scholar]
- 54. Mattar P, Langevin LM, Markham K, Klenin N, Shivji S, Zinyk D, Schuurmans C (2008) Basic helix‐loop‐helix transcription factors cooperate to specify a cortical projection neuron identity. Mol Cell Biol 28: 1456–1469 [DOI] [PMC free article] [PubMed] [Google Scholar]
- 55. Lodato S, Arlotta P (2015) Generating neuronal diversity in the mammalian cerebral cortex. Annu Rev Cell Dev Biol 31: 699–720 [DOI] [PMC free article] [PubMed] [Google Scholar]
- 56. Srinivasan K, Leone DP, Bateson RK, Dobreva G, Kohwi Y, Kohwi‐Shigematsu T, Grosschedl R, McConnell SK (2012) A network of genetic repression and derepression specifies projection fates in the developing neocortex. Proc Natl Acad Sci USA 109: 19071–19078 [DOI] [PMC free article] [PubMed] [Google Scholar]
- 57. Arlotta P, Molyneaux BJ, Chen J, Inoue J, Kominami R, Macklis JD (2005) Neuronal subtype‐specific genes that control corticospinal motor neuron development in vivo . Neuron 45: 207–221 [DOI] [PubMed] [Google Scholar]
- 58. Chong MMW, Zhang G, Cheloufi S, Neubert TA, Hannon GJ, Littman DR (2010) Canonical and alternate functions of the microRNA biogenesis machinery. Genes Dev 24: 1951–1960 [DOI] [PMC free article] [PubMed] [Google Scholar]
- 59. Moltzahn F, Olshen AB, Baehner L, Peek A, Fong L, Stöppler H, Simko J, Hilton JF, Carroll P, Blelloch R (2011) Microfluidic‐based multiplex qRT‐PCR identifies diagnostic and prognostic microRNA signatures in the sera of prostate cancer patients. Cancer Res 71: 550–560 [DOI] [PMC free article] [PubMed] [Google Scholar]
- 60. Han J, Pedersen JS, Kwon SC, Belair CD, Kim Y‐K, Yeom K‐H, Yang W‐Y, Haussler D, Blelloch R, Kim VN (2009) Posttranscriptional crossregulation between Drosha and DGCR8. Cell 136: 75–84 [DOI] [PMC free article] [PubMed] [Google Scholar]
- 61. Luhur A, Chawla G, Wu Y‐C, Li J, Sokol NS (2014) Drosha‐independent DGCR8/Pasha pathway regulates neuronal morphogenesis. Proc Natl Acad Sci USA 111: 1421–1426 [DOI] [PMC free article] [PubMed] [Google Scholar]
- 62. Macias S, Plass M, Stajuda A, Michlewski G, Eyras E, Cáceres JF (2012) DGCR8 HITS‐CLIP reveals novel functions for the Microprocessor. Nat Struct Mol Biol 19: 760–766 [DOI] [PMC free article] [PubMed] [Google Scholar]
- 63. Seong Y, Lim D‐H, Kim A, Seo JH, Lee YS, Song H, Kwon Y‐S (2014) Global identification of target recognition and cleavage by the Microprocessor in human ES cells. Nucleic Acids Res 42: 12806–12821 [DOI] [PMC free article] [PubMed] [Google Scholar]
- 64. Triboulet R, Chang H‐M, Lapierre RJ, Gregory RI (2009) Post‐transcriptional control of DGCR8 expression by the Microprocessor. RNA 15: 1005–1011 [DOI] [PMC free article] [PubMed] [Google Scholar]
- 65. Shenoy A, Blelloch R (2009) Genomic analysis suggests that mRNA destabilization by the Microprocessor is specialized for the auto‐regulation of Dgcr8. PLoS One 4: e6971 [DOI] [PMC free article] [PubMed] [Google Scholar]
- 66. Ganesan G, Rao SMR (2008) A novel noncoding RNA processed by Drosha is restricted to nucleus in mouse. RNA 14: 1399–1410 [DOI] [PMC free article] [PubMed] [Google Scholar]
- 67. Karginov FV, Cheloufi S, Chong MMW, Stark A, Smith AD, Hannon GJ (2010) Diverse endonucleolytic cleavage sites in the mammalian transcriptome depend upon microRNAs, Drosha, and additional nucleases. Mol Cell 38: 781–788 [DOI] [PMC free article] [PubMed] [Google Scholar]
- 68. Di Carlo V, Grossi E, Laneve P, Morlando M, Dini Modigliani S, Ballarino M, Bozzoni I, Caffarelli E (2013) TDP‐43 regulates the Microprocessor complex activity during in vitro neuronal differentiation. Mol Neurobiol 48: 952–963 [DOI] [PubMed] [Google Scholar]
- 69. Drew LJ, Crabtree GW, Markx S, Stark KL, Chaverneff F, Xu B, Mukai J, Fenelon K, Hsu P‐K, Gogos JA et al (2011) The 22q11.2 microdeletion: fifteen years of insights into the genetic and neural complexity of psychiatric disorders. Int J Dev Neurosci 29: 259–281 [DOI] [PMC free article] [PubMed] [Google Scholar]
- 70. Meechan DW, Tucker ES, Maynard TM, LaMantia AS (2009) Diminished dosage of 22q11 genes disrupts neurogenesis and cortical development in a mouse model of 22q11 deletion/DiGeorge syndrome. Proc Natl Acad Sci USA 106: 16434–16445 [DOI] [PMC free article] [PubMed] [Google Scholar]
- 71. Forstner AJ, Degenhardt F, Schratt G, Nöthen MM (2013) MicroRNAs as the cause of schizophrenia in 22q11.2 deletion carriers, and possible implications for idiopathic disease: a mini‐review. Front Mol Neurosci 6: 47 [DOI] [PMC free article] [PubMed] [Google Scholar]
- 72. Madisen L, Zwingman TA, Sunkin SM, Oh SW, Zariwala HA, Gu H, Ng LL, Palmiter RD, Hawrylycz MJ, Jones AR et al (2010) A robust and high‐throughput Cre reporting and characterization system for the whole mouse brain. Nat Neurosci 13: 133–140 [DOI] [PMC free article] [PubMed] [Google Scholar]
- 73. Muller H, Marzi MJ, Nicassio F (2014) IsomiRage: from Functional Classification to Differential Expression of miRNA Isoforms. Front Bioeng Biotechnol 2: 38 [DOI] [PMC free article] [PubMed] [Google Scholar]
- 74. Lewis BP, Burge CB, Bartel DP (2005) Conserved seed pairing, often flanked by adenosines, indicates that thousands of human genes are microRNA targets. Cell 120: 15–20 [DOI] [PubMed] [Google Scholar]
- 75. Vergoulis T, Vlachos IS, Alexiou P, Georgakilas G, Maragkakis M, Reczko M, Gerangelos S, Koziris N, Dalamagas T, Hatzigeorgiou AG (2012) TarBase 6.0: capturing the exponential growth of miRNA targets with experimental support. Nucleic Acids Res 40: D222–D229 [DOI] [PMC free article] [PubMed] [Google Scholar]
- 76. Edgar R, Domrachev M, Lash AE (2002) Gene Expression Omnibus: NCBI gene expression and hybridization array data repository. Nucleic Acids Res 30: 207–210 [DOI] [PMC free article] [PubMed] [Google Scholar]
- 77. Pedersen JS, Bejerano G, Siepel A, Rosenbloom K, Lindblad‐Toh K, Lander ES, Kent J, Miller W, Haussler D (2006) Identification and classification of conserved RNA secondary structures in the human genome. PLoS Comput Biol 2: e33 [DOI] [PMC free article] [PubMed] [Google Scholar]
- 78. Hofacker IL, Fontana W, Stadler PF, Bonhoeffer LS, Tacker M, Schuster P (1994) Fast folding and comparison of RNA secondary structures. Monatshefte fur Chemie Chem Mon 125: 167–188 [Google Scholar]
Associated Data
This section collects any data citations, data availability statements, or supplementary materials included in this article.
Supplementary Materials
Appendix
Expanded View Figures PDF
Table EV1
Table EV2
Table EV3
Review Process File