

Abstract
Upon aging, hematopoietic stem cells (HSCs) undergo changes in function and structure, including skewing to myeloid lineages, lower reconstitution potential and loss of protein polarity. While stem cell intrinsic mechanisms are known to contribute to HSC aging, little is known on whether age‐related changes in the bone marrow niche regulate HSC aging. Upon aging, the expression of osteopontin (OPN) in the murine bone marrow stroma is reduced. Exposure of young HSCs to an OPN knockout niche results in a decrease in engraftment, an increase in long‐term HSC frequency and loss of stem cell polarity. Exposure of aged HSCs to thrombin‐cleaved OPN attenuates aging of old HSCs, resulting in increased engraftment, decreased HSC frequency, increased stem cell polarity and a restored balance of lymphoid and myeloid cells in peripheral blood. Thus, our data suggest a critical role for reduced stroma‐derived OPN for HSC aging and identify thrombin‐cleaved OPN as a novel niche informed therapeutic approach for ameliorating HSC phenotypes associated with aging.
Keywords: aging, hematopoietic stem cell, microenvironment, niche, osteopontin
Subject Categories: Ageing; Cell Adhesion, Polarity & Cytoskeleton; Stem Cells
Introduction
One cause of aging of the hematopoietic system is aging of hematopoietic stem cells (HSCs). While upon aging the number of phenotypic HSCs increases, their regenerative potential as measured in transplantation assays decreases. Hematopoiesis in the aged shows preferential differentiation into myeloid cells at the loss of support for the B‐cell lineage. An apolar distribution of the small RhoGTPase Cdc42 and the cytoskeletal protein tubulin within the cytosol, and of histone 4 acetylated on lysine 16 (AcH4K16) in the nucleus (Florian et al, 2012) caused by increased activity of the small RhoGTPase Cdc42, as well as additional changes in epigenetic modifications referred to as epigenetic drift and altered gene expression profiles (e.g., high expression of myeloid genes) are additional hallmarks of aged HSCs (Chambers et al, 2007; Florian & Geiger, 2010; Florian et al, 2012; Beerman et al, 2013). Historically, aging of HSCs was thought to be solely influenced by stem cell intrinsic mechanisms (Rossi et al, 2005; Florian et al, 2012). Novel data though imply also the HSC niche in driving or exacerbating aging of HSC (Li et al, 2001; Liang et al, 2005; Zhu et al, 2007). Elucidation of the mechanisms by which aging of the niche affects HSC aging will support the design of rationale therapeutic interventions to attenuate aging in hematopoiesis (Khong et al, 2015; Khatri et al, 2016). While mechanisms through which the niche regulates young HSCs have started to be elucidated (Visnjic et al, 2004; Xie et al, 2009; Méndez‐Ferrer et al, 2010; Nombela‐Arrieta et al, 2013; Bruns et al, 2014; Acar et al, 2015; Gur‐Cohen et al, 2015), data on the extent of aging of the niche and the contribution to aging of HSCs are rare. Changes in the niche composition or function upon aging involve decreased bone formation, enhanced adipogenesis and changes in extracellular matrix (ECM) components (Calvi et al, 2003; Zhang et al, 2003; Naveiras et al, 2009; Geiger et al, 2013). Skewing of aged HSCs toward myeloid differentiation was recently linked to increased secretion of the pro‐inflammatory CC‐chemokine ligand 5 (CCL5; also known as RANTES) in aged stroma (Ergen et al, 2012). Osteopontin (OPN), a secreted matrix glycoprotein, is produced in BM stroma by pre‐osteoblasts, osteoblasts and osteocytes (Nilsson et al, 2005; Grassinger et al, 2009). In young mice, OPN regulates HSC pool size, stem cell homing, trans‐marrow migration and engraftment (Nilsson et al, 2005; Stier et al, 2005; Haylock & Nilsson, 2006; Grassinger et al, 2009). Here, we report that OPN is reduced in aged stroma and that reduced OPN levels confer aging‐associated phenotypes on HSCs. Treatment of aged HSCs with thrombin‐activated OPN phenotypically and functionally attenuated HSC aging, establishing lack of OPN as a critical factor in the aged niche conferring aging on HSC.
Results
Transplantation of young HSCs into an aged microenvironment causes HSC expansion and enhanced myeloid contribution
The extent to which aging of the niche and the microenvironment contributes to aging‐associated phenotypes of HSCs is still a matter of debate. Therefore, hetero‐chronic transplant assays were performed in which BM cells from young (8–10 weeks old) donors were transplanted into either young (8–10 weeks old) or old (19–21 months old) recipients (Y→Y, Y→O) (Fig 1A). We detected a decrease in the frequency of donor‐derived cells in Y→O compared to Y→Y recipients in peripheral blood (PB) 20 weeks after transplantation (Fig 1B). Y→O mice further presented with an elevated frequency of long‐term HSCs (LT‐HSCs, gated as LSK CD34−/lowFlk2−) among Lin− Sca‐1+ c‐kit+ cells (LSK) in BM and showed a decrease in the frequency of short‐term HSCs (ST‐HSCs, gated as LSK CD34+Flk2−) when compared to the frequency in Y→Y recipients (Fig 1C). In addition, we found in Y→O mice, as previously reported, an increase in the frequency of myeloid cells in PB. The frequency of T cells was decreased, as expected in an environment with an aged thymus, while the frequency of B cells, also as reported previously, was not affected (Fig 1D) (Ergen et al, 2012). HSCs in Y→O mice were primarily apolar for tubulin and AcH4K16 (aged), while HSCs in Y→Y mice remained polar (young) (Fig 1E). Hence, an aged niche is able to confer a set of aging‐associated phenotypes on HSCs.
Figure 1. Transplantation of young BM cells into an aged microenvironment causes HSC expansion and myeloid development.
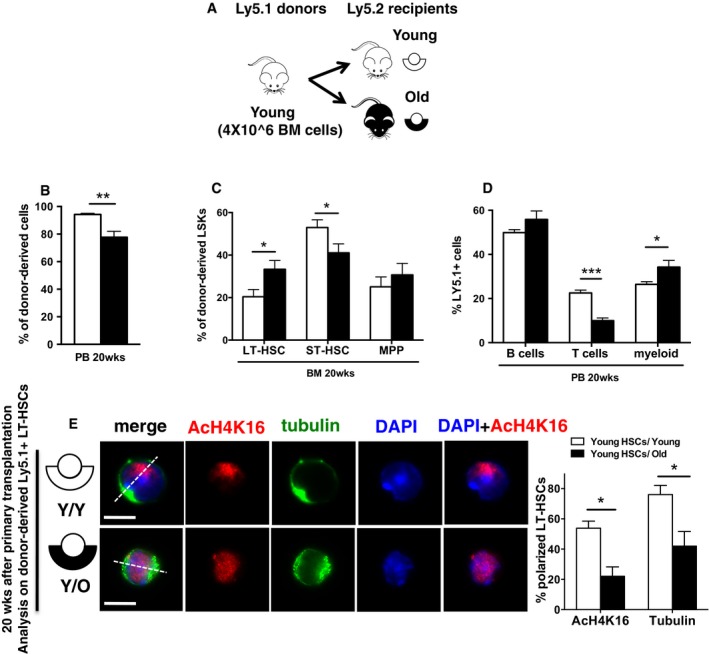
- Schematic representation of the experimental setup: (Ly5.1+) BM cells from young were transplanted into either young or old recipient (Ly5.2+) mice. Twenty weeks after transplant, recipient mice were sacrificed and donor‐derived Ly5.1+ cells were analyzed in detail by flow cytometry and cell sorting.
- Frequency of young donor contribution (Ly5.1+ cells) to total WBC in PB in young and old recipient (Ly5.2+) mice.
- Frequency of young LT‐HSCs, ST‐HSCs and MPP cells in BM among donor‐derived Ly5.1+ LSK cells in young and old recipient (Ly5.2+) mice.
- Frequency of young B cells, T cells and myeloid cells among donor‐derived Ly5.1+ cells in PB in young and old recipient (Ly5.2+) mice.
- Representative distribution of AcH4k16 (red) and tubulin (green) in donor‐derived LT‐HSCs (Ly5.1+ cells) sorted from the Y→Y and Y→O experimental groups 20 weeks after transplant. Scale bar, 6 μm. Frequency of donor‐derived young LT‐HSCs polarized for AcH4K16 and tubulin sorted from young and old recipient (Ly5.2+) mice. n = 3; ˜40 cells scored per sample in each experimental repetition.
Age‐related changes in endosteal‐enriched stroma cells
We next characterized the nature of aging‐associated changes in stroma (Köhler et al, 2009; Grassinger et al, 2010). Cells that are located < 10 cell diameters to the bone are enriched for stroma cells from the endosteal region of the bone referred to as the endosteal niche and were detached for our experiments by collagenase treatment (Fig 2Ai–iii). This cell population is thus enriched in non‐hematopoietic stroma cells and, as most of the vascular structures are present in this region, contains all types of stroma cells present in the BM (Mendelson & Frenette, 2014). Flow cytometric analyses identified a decrease in the frequency of stroma cells (CD45− Ter119−, Fig EV1A) as well as osteoblasts (OBs, CD45−Ter119−CD31−Sca1−CD51+ cells) upon aging, while the frequency of other niche cell populations like CD31+ endothelial cells (gated as CD45−Ter119−Sca1+CD31+), mesenchymal stem cells (MSCs gated as CD45−Ter119−CD31−Sca1+CD51+) and CXCL12 abundant reticular cells (CAR+ cells gated as CD45−Ter119−CD31−CXCL12+) was similar (Fig 2B). We also detected a decrease in the frequency of both mesenchymal progenitors able to differentiate into fibroblasts (Fig EV1B) and osteoblasts (Fig EV1C) in aged mice. Aging thus changes the cellular composition of stroma. These changes in composition though seem to be primarily linked to stroma close to the endosteum, as the stroma cell composition in the central part of the BM was interestingly not affected by aging (Fig EV1D).
Figure 2. Stroma‐derived OPN decreases alongside with OBs decrease in the stroma upon aging.
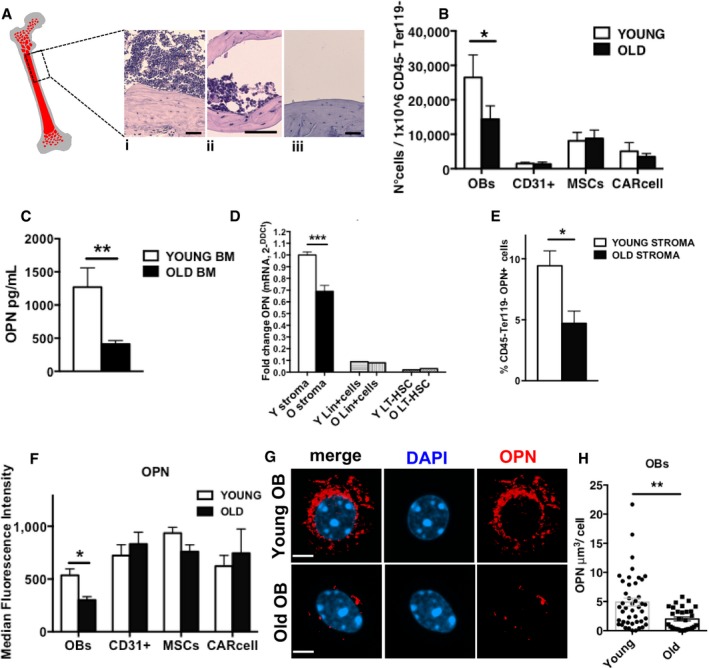
- Representative cartoon of a bone section: endosteum (gray), BM (red). (i) BM section. (ii) BM section after BM flushing. This cell fraction close to the endosteum was used for subsequent experiments. (iii) Bone after BM flushing and incubation with collagenase IV. Scale bar, 50 μm.
- Relative frequency of osteoblasts, CD31+ endothelial cells, MSCs and CAR cells in endosteal‐enriched stroma population of young and old mice (n = 7).
- Concentration of OPN in the BM supernatant from either young or old mice (n = 6).
- Relative level of OPN RNA in young and old cells isolated from the endosteal bone region, lineage‐positive cells and LT‐HSCs (stroma cells n = 7 young, n = 7 old; lineage positive n = 3 young, n = 3 old; LT‐HSC n = 4 young, n = 4 old).
- Frequency of CD45−Ter119−OPN+ cells (OPN‐positive stroma cells) in the endosteal‐enriched stroma population from young and old mice (n = 5).
- OPN median fluorescence intensity in young and old endosteal‐enriched stroma populations (OBs, CD31+ endothelial, MSCs and CAR+ cells) from three experimental repeats (n = 9 young, n = 6 old).
- Representative immunofluorescence three‐dimensional images of DAPI (blue) and OPN (red) localization in young and old OBs (scale bar 2.10 μm). Two experiments with ˜15–20 cells scored per sample in each experimental repetition.
- Volume measurement of OPN signal in young and old OBs.
Figure EV1. BM niche microenvironment changes upon aging with respect to decreased cell frequency, decreased CFU‐F/OB ability and altered cytokines secretion.

-
ARelative frequency of CD45− Ter119− cells (endosteal‐enriched stroma population) in the cell fraction close to the endosteum in young and aged mice (n = 9).
-
B, CFrequency of CFU‐F (B) and CFU‐OB (C) among 300,000 young or old cells isolated from the endosteal bone region (n = 4).
-
DRelative frequency of osteoblasts OBs, CD31+ endothelial cells, MSCs and CAR cells in BM central stroma population of young and old mice (n = 5).
-
EConcentration of cytokines in the BM supernatant of young and old mice (n = 3).
-
F, GNumbers of LT‐HSCs (F) and ST‐HSCs (G) in spleen of young and old mice (n = 4–5 per group).
Osteopontin is decreased in aged BM
We next investigated whether levels of specific secreted proteins associated with distinct types of niche cells changed in the BM extracellular fluid upon aging. While we detected an aging‐associated increase in the level of multiple chemokines and cytokines tested (Fig EV1E), which included the already reported increase in RANTES and other pro‐inflammatory cytokines, OPN was the only cytokine in our test group to present with a decrease in the level in the BM extracellular fluid upon aging (Fig 2C). Changes in OPN upon aging thus correlate positively with a reduced function of HSCs upon aging. A pro‐inflammatory cytokine microenvironment in the BM upon aging that is usually associated with mobilization might also explain our finding of elevated HSPC numbers in the spleen of aged mice (Fig EV1F and G). Consistent with a low level of OPN in the extracellular fluid, stroma cells in aged mice presented with reduced levels of OPN mRNA (Fig 2D), while the low level of OPN expression in HSCs as well as differentiated hematopoietic (lin+ cells) was not affected by aging (Fig 2D). Intracellular staining further revealed a decrease in the frequency of cells positive for OPN protein among aged stroma cells (Fig 2E). While OPN protein was detected in OBs, CD31+ endothelial cells, MSCs and the CAR+ subpopulation of endosteal‐enriched stroma cells at distinct levels, only OBs showed a decrease in OPN protein upon aging (Fig 2F). Expression of OPN in endosteal‐enriched stroma cells other than OBs, CD31+ endothelial cells, MSCs and CAR+ cells was not altered upon aging, suggesting that primarily changes in the level of OPN in OBs are responsible for changes of the OPN level in stroma upon aging (Fig EV2A). Quantitative immunofluorescence confocal microscopy (Fig 2G) further confirmed that the decrease in OPN protein upon aging is restricted to OBs (Figs 2H and EV2B, and Movies EV1 and EV2). The decrease in OPN upon aging in BM owes therefore most likely to a combination of both a decrease in the number of OBs expressing OPN (Fig EV2C) and a lower expression of OPN per OB.
Figure EV2. OPN staining in stroma OBs, CD31+ endothelial cells, CAR + cells and MSCs.
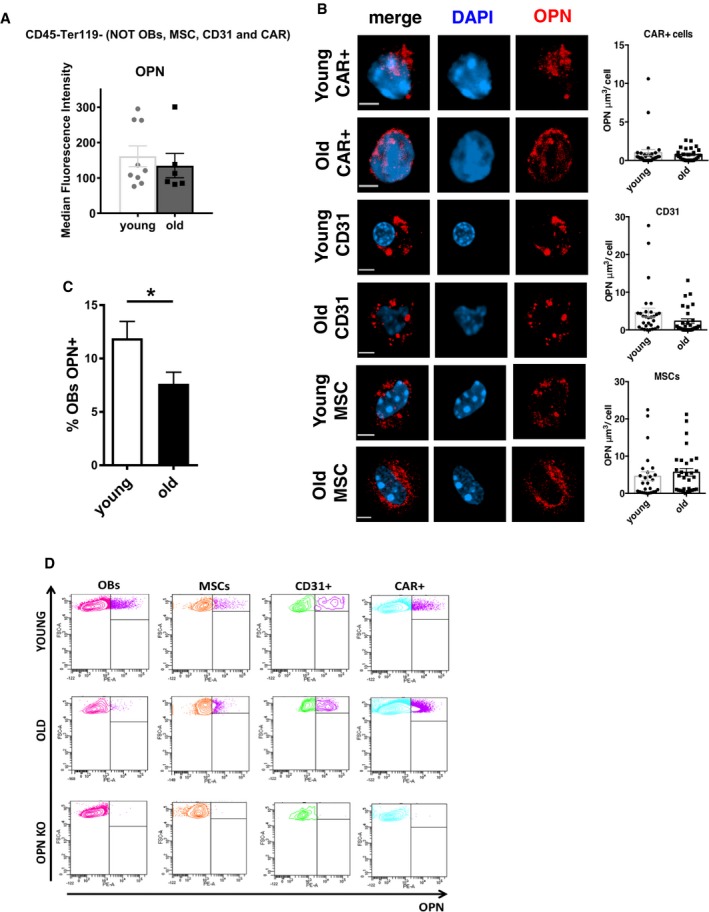
- Relative frequency of left over endosteal‐enriched stroma population OPN‐positive nonosteoblasts, CD31+ endothelial cells, MSCs and CAR cells of young and old mice (n = 4).
- Representative immunofluorescence three‐dimensional images of DAPI (blue) and OPN (red) localization in young and old CAR+ cells (scale bar 1.40 μm), CD31+ endothelial (scale bar 1.80 μm) and MSCs (scale bar 1.90 μm) with relative OPN signal volume quantification. Representative of two experiments with ˜15–20 cells scored per sample in each experimental repetition.
- Relative frequency of OPN‐positive osteoblasts in endosteal‐enriched stroma population of young and old mice (n = 4).
- Representative plot showing specificity of the anti‐OPN antibody in young, old and OPN KO endosteal‐enriched stroma population.
Lack of stromal OPN confers aging‐like phenotypes on HSCs
We next initiated in vitro co‐culture experiments in which young HSCs were plated onto freshly isolated young, OPN KO and old endosteal‐enriched stroma cells (Fig 3A and B) to investigate whether the aging‐associated decline in OPN in stroma might be able to confer aging‐associated changes on HSCs. After 72 h of co‐cultivation, which allows for two to three rounds of cell replication of the HSCs, the number of phenotypic HSCs (Fig 3C) was increased when young cells were cultured on OPN KO and old stroma compared to young stroma, like in aged animals. This increase was specific to HSCs, as the frequency of more differentiated ST‐HSCs and multipotent progenitors (MPPs, gated as LSK CD34+Flk2+) remained unaltered (Fig 3D and E). Young HSCs, independent on the type of stroma cultured on, remained more than 95% viable and presented on average with 10% of cells in cycle (BrdU+) (Fig EV3A and B), excluding that differences in apoptosis or cycling contributed to the elevated number of HSC found on OPN KO or aged stroma.
Figure 3. OPN KO microenvironment, like an old environment, prematurely increases the number of young HSCs, decreases their engraftment and protein polarity.

-
ASchematic representation of the experimental setup.
-
BConcentration of OPN in the co‐culture supernatant of young BM lineage negative onto young, young OPN KO and old endosteal‐enriched stroma population.
-
C–ENumber of young LT‐HSCs (C), ST‐HSCs (D) and MPPs (E) Ly5.1+ onto young, young OPN KO and old endosteal‐enriched stroma population.
-
FSchematic representation of the experimental setup.
-
GFrequency of young donor contribution (Ly5.1+ cells) to total WBC in PB in young, young OPN KO and old recipient (Ly5.2+) mice.
-
HFrequency of young LT‐HSC, ST‐HSC and MPP cells in BM among donor‐derived LSK cells in young, young OPN KO and old recipient (Ly5.2+) mice.
-
IFrequency of young B cells, T cells and myeloid cells among donor‐derived Ly5.1+ cells in PB in young, young OPN KO and old recipient (Ly5.2+) mice.
-
JRepresentative distribution of AcH4k16 (red) and tubulin (green) in donor‐derived LT‐HSCs (Ly5.1+ cells) 20 weeks after transplant. Scale bar, 6 μm. Same data as in Fig 1 are shown for the young and old groups, and same experimental conditions have been applied for the additional OPN KO recipient mice group.
-
KFrequency of donor‐derived young LT‐HSCs polarized for AcH4K16 and tubulin from young, young OPN KO and old recipient (Ly5.2+) mice. n = 5; ˜40 cells scored per sample in each experimental repetition.
Figure EV3. OPN −/− mice, like old mice, show decreased OB number, increase in inflammatory cytokines and increase in LT‐HSCs with associated apolarity.
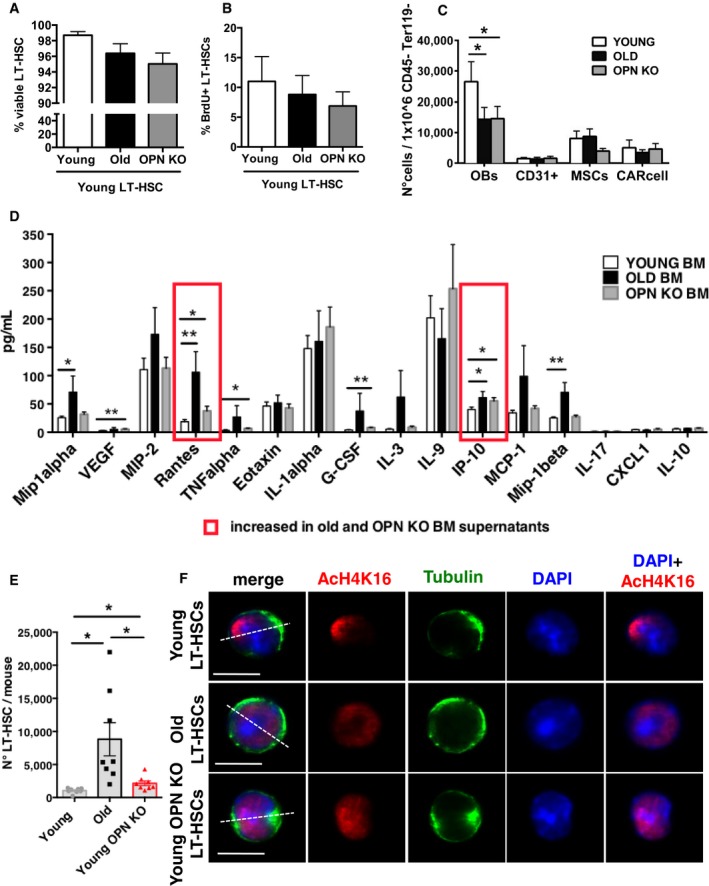
-
A, BFrequency of young LT‐HSCs Ly5.1+ Annexin V negative (A) and BrdU+ (B) co‐cultured onto young, young OPN KO and old endosteal‐enriched stroma population (n = 6).
-
CRelative frequency of osteoblasts, CD31+ endothelial cells, MSCs and CAR cells in endosteal‐enriched stroma population of young, old and young OPN KO mice (n = 6–7).
-
DConcentration of cytokines in the BM supernatant of young, old and young OPN KO mice (n = 3).
-
ENumber of LT‐HSCs per mouse sorted from young, old and young OPN KO mice (n = 8).
-
FRepresentative distribution of AcH4k16 (red) and tubulin (green) in LT‐HSCs sorted from young, old and young OPN knockout mice (Ly5.2 background). Nuclei are stained with DAPI (blue). Scale bar, 5 μm. Merged pictures on a dark background are shown.
Additional heterochronic transplants were performed to determine the extent of premature aging of HSCs when exposed to an OPN KO stroma in vivo. BM cells from young (8–10 weeks old) donors were transplanted into young (8–10 weeks old), OPN KO (8–10 weeks old) and old (19–21 months old) recipients (Y→Y, Y→OPN KO, Y→O) (Fig 3F). In both Y→OPN KO and Y→O transplants, a decrease in the overall donor‐derived cell engraftment in PB was observed compared to Y→Y (Fig 3G). Y→OPN KO mice showed an aging‐like increase in the frequency of HSCs in BM that was indistinguishable from the frequency in Y→O, but very distinct from Y→Y controls (Fig 3H) as also already described for early hematopoietic progenitor cells (LSK) cells in OPN−/− animals (Nilsson et al, 2005). Y→O animals presented with an increase in the frequency of myeloid cells over lymphoid T cells, while B‐cell frequencies were not affected (Fig 3I, see also Fig 1). Y→OPN KO animals though did not yet recapitulate an aged phenotype in differentiated cells, showing a normal contribution to myeloid, T and B cells in PB similar to Y→Y controls (Fig 3I). Moreover, HSCs became to a large extent apolar for tubulin and AcH4K16 in Y→OPN KO animals, similar to HSCs in Y→O transplants, while HSCs in Y→Y animals remained mainly polar (Fig 3J and K). Endosteal‐enriched stroma cells in a young OPN KO mouse mimicked old stroma also with respect to a lower overall number of OBs (Fig EV3C) and elevated levels of IP‐10 as well as RANTES in the BM extracellular fluid (Fig EV3D), which implies that these aging‐associated changes in stroma are mechanistically downstream of OPN. In aggregation, these data support that an OPN−/− stroma can confer premature aging‐like phenotypes on HSCs (reconstitution potential, frequency, polarity) independent of lineage skewing. We obtained similar phenotypes as described above when animals devoid of OPN in all tissues (Nilsson et al, 2005; Stier et al, 2005) were analyzed: an increase in LT‐HSC number, a decrease in protein polarity and an increase in Cdc42 activity (Figs EV3E and F, and EV4A–D). Finally, we detected accelerated aging‐associated differentiation skewing in BM of middle‐aged OPN−/− mice (18 months). These animals presented with a reduced frequency of B cells and an increase in myeloid cells compared to age‐matched littermates (Fig EV4E). 18‐month‐old OPN−/− mice also showed though a significant decrease in common myeloid progenitor cells (CMPs) but also a trend in a lower frequency of common lymphoid progenitor cells (CLPs) compared to old wild‐type mice (Fig EV4F).
Figure EV4. Increased HSCs number in OPN −/− mice present with augmented Cdc42 activity and premature lineage skewing.

- Frequency of LT‐HSCs polarized for AcH4K16 and tubulin sorted from young, old and young OPN KO mice. n = 6; ˜40 cells scored per sample in each experimental repetition.
- Cdc42 activity in young, old and young OPN KO lineage‐depleted bone marrow cells (Lin−BM) was determined by pull‐down/Western blot assay. Active Cdc42 (Cdc42‐GTP) was normalized with respect total Cdc42 and actin.
- Ratio of the densitometric score of the Cdc42‐GTP form and the total Cdc42 expression from panel (B), n = 5.
- Number of LT‐HSCs per mouse sorted from young, old (24 months), young OPN KO mice and old OPN KO (18 months) (Ly5.2+) mice (n = 5–8).
- Frequency of B cells, T cells, and myeloid cells in BM in young, old (24 months), young OPN KO and old OPN KO (18 months) (Ly5.2+) mice (n = 5).
- Frequency of MEPs, CMPs, GMPs and CLPs progenitors in BM cells in young, old (24 months), young OPN KO and old OPN KO (18 months) (Ly5.2+) mice (n = 5).
- Schematic representation of the experimental setup: the recipient mice were analyzed after 15 h from the cell injection.
- Cartoon demonstrating processing of the bones for analysis.
- Ratio of CFSE+ HSPCs per section (3–4 biological repeats/group). Average HSPC numbers scored/mouse in young n = 39, old n = 63 and OPN KO = 70 in three biological repeats.
Aged HSCs are found at a greater distance from the endosteum within the BM and present with a reduced lodging ability (Köhler et al, 2009). We next tested the contribution of loss of OPN to these aging‐associated phenotypes. To this end, young, CFSE‐labeled HSPCs were transplanted into young, old and young OPN KO recipients (Fig EV4G). Long bones were harvested 15 h later and cut into longitudinal sections and subsequently analyzed for HSPC localization (Fig EV4H). We determined the number of homed young HSPC in the whole bone via 3D reconstitution of the data. The OPN KO environment, like the old environment, harbored double the number of young HSPCs when compared to young recipients (Fig EV4I). In aggregation, these data suggest that an OPN KO microenvironment resembles an old microenvironment with respect to harboring more HSPCs. Transplantations of BM cells from Y→Y, Y→OPN KO and Y→O transplants into secondary recipient (young) mice (Appendix Fig S1A) revealed in the Y→OPN KO and Y→O groups, as anticipated, a decrease in the overall donor‐derived cell engraftment in PB when compared to secondary transplants of Y→Y mice (Appendix Fig S1B). The frequency of HSC decreased though to a youthful level irrespective of the previous type of stroma exposure, and the differentiation pattern in BM was similar to the one in Y→Y transplants (Appendix Fig S1C and D). These data imply that at least some of the aging‐associated phenotypes conferred upon HSCs by low OPN might be amendable to attenuation by a young stromal microenvironment.
Young stroma attenuates phenotypes associated with aged HSCs
Old HSCs, when cultured either on a young, young OPN KO or an old (OPN low) stroma population (Fig EV5A and B) presented with similar numbers of HSCs, irrespective of the type of stroma they were cultivated on, and the level of apoptosis and BrdU uptake (cycling) of aged HSCs were similar while cultured the distinct types of stroma (Fig EV5C–G). Experiments in which BM cells from old donors (19–21 months) were transplanted into old (19–21 months old), young OPN KO (8–10 weeks old) and young recipients (8–10 weeks old) (O→O, O→OPN KO, O→Y) (Fig 4A) revealed though that young stroma, in contrast to an aged or OPN KO stroma, conferred an elevated, more youthful contribution to chimerism in PB on aged HSCs (Fig 4B). O→Y recipients further presented with a significant decrease in the frequency of LT‐HSCs in BM when compared to O→O controls (Fig 4C). Old HSCs, when transplanted into young animals, re‐established a more youthful pattern of lineage differentiation, with a decrease in the frequency of myeloid cells and an increase in T‐lymphoid cells compared to O→O (Fig 4D) and a decrease in the frequency of CMPs compared to O→O (Fig EV5H and I). These data imply that aging‐associated stem cell phenotypes might be malleable by a young, OPN‐positive stroma in vivo, while a young OPN KO microenvironment is not able to do so (no rescue of B and myeloid cells, Fig 4D). The fact that our in vitro co‐culture experiments (Fig EV5A), in contrast to the in vivo transplants (Fig 4A), did not show attenuation of aging parameters on young stroma suggested that additional co‐factors only present in vivo might be necessary for OPN to act on aged HSCs. OPN that has been enzymatically digested by thrombin (Thr) can regulate HSCs attraction and niche retention (Grassinger et al, 2009). Analyses of BM sections by immunofluorescence revealed that Thr and OPN co‐localize at the endosteum, supporting a likely interaction of Thr and OPN in vivo (Fig 4E), which was further supported by our finding that BM harbors, besides full‐length OPN, also fragments of OPN which are consistent in size with OPN digested by Thr in vitro (Fig 4F and G).
Figure EV5. A young stroma microenvironment supports the increase in old MPPs in vitro and the decrease in old CMPs in vivo .

-
ASchematic representation of the experimental setup.
-
BConcentration of OPN in the co‐culture supernatant of old BM lineage negative onto young, young OPN KO and old endosteal‐enriched stroma population (n = 4).
-
C–ENumber of old LT‐HSCs (C), ST‐HSCs (D) and MPPs (E) Ly5.1+ onto young, young OPN KO and old endosteal‐enriched stroma population (n = 4).
-
F, GFrequency of old LT‐HSCs Ly5.2+ Annexin V negative (F) and BrdU+ (G) co‐cultured onto young, young OPN KO and old endosteal‐enriched stroma population (n = 4).
-
H, IFrequency of young (H) and old (I) (Ly5.1+) MEPs, CMPs, GMPs and CLPs progenitors in BM cells in young, old and young OPN KO recipients (Ly5.2+) mice after 20 weeks upon transplantation. Data are based on six experimental repeats with five recipient mice per group (e.g., n = 25–30 per group).
Figure 4. A young microenvironment restores HSC frequency, protein polarity and lineage of differentiation.
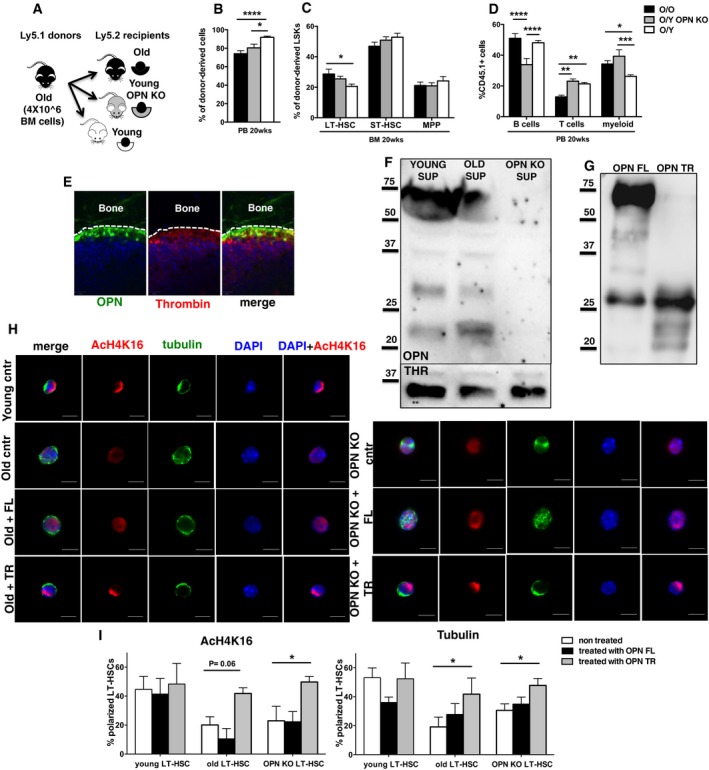
- Schematic representation of the experimental setup.
- Frequency of old donor contribution (Ly5.1+ cells) to total WBC in PB in young, young OPN KO and old recipient (Ly5.2+) mice.
- Frequency of old LT‐HSC, ST‐HSC and MPP cells in BM among donor‐derived LSK cells in young, young OPN KO and old recipients (Ly5.2+) mice.
- Frequency of old B cells (B220+), T cells (CD3+) and myeloid cells among donor‐derived Ly5.1+ cells in PB in young, young OPN KO and old recipient (Ly5.2+) mice.
- Whole mount immunofluorescence staining on young mouse femors. Representative co‐distribution of OPN (green) and thrombin (red) in the endosteal region of young mouse femurs.
- Representative Western blot analysis for OPN and thrombin of the BM supernatants from young, old and OPN KO mice. n = 3.
- Western blot analysis showing the OPN full‐length form (OPN FL) and the thrombin‐cleaved OPN truncated form fragments size (OPN TR).
- Representative distribution of AcH4k16 (red) and tubulin (green) in young, old, old treated with OPN FL, old treated with OPN TR, OPN KO, OPN KO treated with OPN FL, and OPN KO treated with OPN TR LT‐HSCs. Scale bar, 5 μm.
- Percentage of LT‐HSCs polarized for AcH4K16 and tubulin for all the experimental groups. n = 4; ˜40 cells scored per sample in each experimental repetition.
Thrombin‐activated OPN attenuates phenotypes associated with aged HSCs
HSCs from young, OPN KO and old mice were treated for 16 h ex vivo with recombinant OPN or recombinant OPN activated by thrombin (OPN TR). Both apolar old and apolar HSCs from OPN KO mice (Fig EV3E and F), when treated with OPN TR, turned polar (Fig 4H). OPN not processed by Thr did not alter the polarity status (Fig 4H and I). Thus, OPN TR exposure reverts the apolar status of old or prematurely aged HSCs from the OPN KO mouse to a polar, youthful one. HPLC separation of OPN TR revealed (Appendix Fig S2Ai and ii), similar to WB analyses of OPN TR (Fig 4G), four distinct protein fractions (fraction A to D). Fraction D was the single active fraction that was able to revert the polarity status of HSCs from old and OPN KO animals to an extent similar to total OPN TR to a youthful level (Fig 5A and B, and Appendix Fig S3A). Fraction D of OPN TR was also able to reduce the activity of the small RhoGTPAse Cdc42 (that regulates polarity) in aged hematopoietic cells almost to the level found in young cells (Fig 5C). WB analyses revealed that fraction D, which in terms of absolute protein content, is the smallest of the four fractions, presented with bands around 20 and 25 kDa in size (Appendix Fig S2Bi and ii) which are fragments similar in size to fragments from OPN detected in the BM in vivo (Fig 4F). Protein sequencing approaches indicated that the two fragments in fraction D represent fragments from the predicated thrombin cleavage site in OPN (Fig EV6Ai). As besides OPN fragments also thrombin was found exclusively in fraction D (Fig EV6Aii), fraction D was further divided into six subfractions and thrombin was only found in one subfraction (26–27), while the other five fractions were devoid of thrombin (Fig EV6B). As all of the fraction D subfractions were able to re‐polarize aged HSCs (Fig EV6C), a direct role for thrombin in changing polarity could be excluded.
Figure 5. Treatment with OPN fraction D attenuates aged LT‐HSC dysfunction and restores the polarity of tubulin and Ach4K16 by activating integrin α9β1 on HSCs.
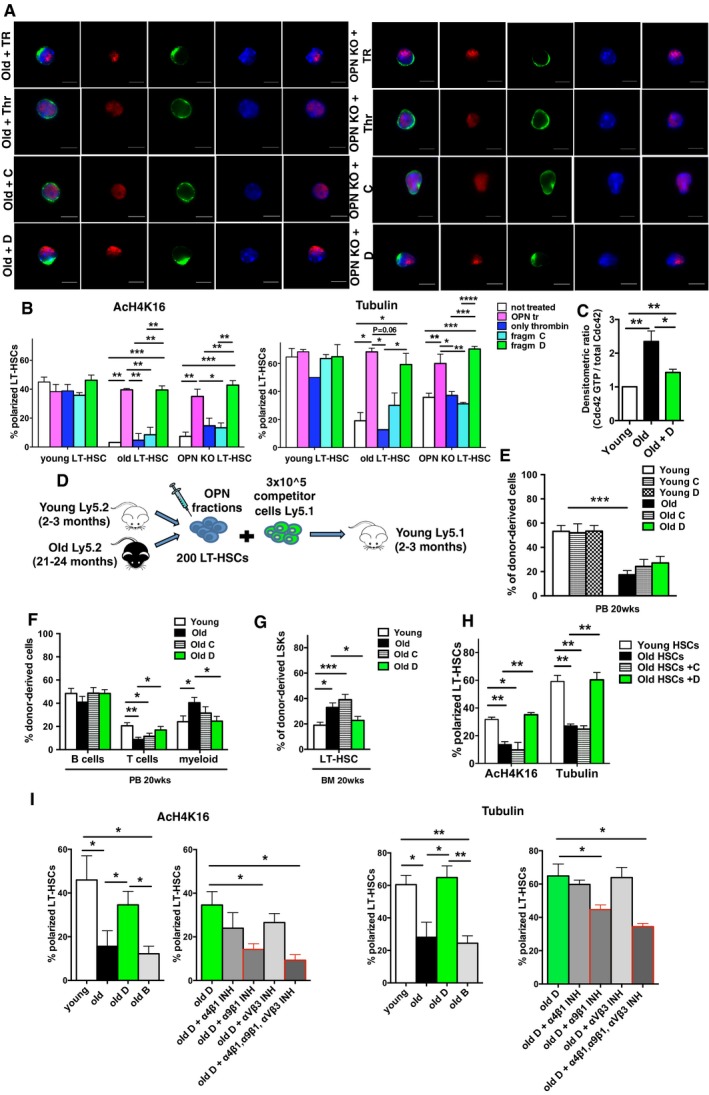
- Representative distribution of AcH4k16 (red) and tubulin (green) in old with OPN TR, old treated with thrombin, old treated with fraction C and old treated with fraction D LT‐HSCs (same treatment condition for OPN KO LT‐HSCs). Scale bar, 5 μm.
- Percentage of LT‐HSCs polarized for AcH4K16 and tubulin for all the experimental groups. n = 4; ˜40 cells scored per sample in each experimental repetition.
- Cdc42 activity in young, old and old treated with fraction D lineage‐depleted bone marrow cells (Lin− BM) determined by pull‐down/Western blot assay. Graph represents the ratio of the densitometric score of the Cdc42‐GTP form and the total Cdc42 expression, n = 5 pull‐down assays.
- Schematic representation of the experimental setup.
- Frequency of donor contribution to total WBC in PB in young recipient mice 20 weeks after transplantation.
- Frequency of old, old with fraction C and old with fraction D, B cells, T cells and myeloid cells among donor‐derived Ly5.2+ cells in PB in young recipient mice.
- Frequency of old, old with fraction C and old with fraction D LT‐HSCs in BM among donor‐derived LSK cells in young recipient mice.
- Percentage of LT‐HSCs polarized for AcH4K16 and tubulin in donor‐derived LT‐HSCs (Ly5.2+ cells) sorted from the old, old with fraction C and old with fraction D experimental groups 20 weeks after transplant. ˜40 cells scored per sample in each experimental repetition, n = 3.
- Percentage of LT‐HSCs polarized for AcH4K16 and tubulin in the experimental groups listed. n = 3; ˜30 cells scored per sample in each experimental repetition.
Figure EV6. OPN fragments 20–25 kDa re‐polarize old LT‐HSCs.

- OPN fraction D (20–25 kDa) sequence after enzymatic digestion. In blue, the thrombin cleavage site is shown. (ii) Chromatogram of the second digestion of fraction D with 8 M urea.
- Western blot analysis of all the fractions obtained from the digestion of fraction D. Antibodies anti‐OPN and anti‐thrombin were used.
- All the subfractions were tested on LT‐HSCs. Percentage of LT‐HSCs polarized for AcH4K16 and tubulin are shown for all the experimental groups. n = 3. ˜40 cells scored per sample in each experimental repetition.
- Percentage of LT‐HSCs polarized for AcH4K16 and tubulin in the experimental groups listed. n = 3; ˜30 cells scored per sample in each experimental repetition. The percentage of polarized cells is plotted over the total number of cells scored.
Next, we tested whether aged HSCs that were re‐polarized to a youthful level by OPN fraction D also displayed a youthful in vivo function. Aged HSCs, treated for 16 h with fraction D, were competitively transplanted into young recipients and the outcome compared to competitive transplants with young and aged untreated HSCs and with young and aged HSCs treated with fraction C (does not re‐polarize aged HSCs) (Fig 5D). While the overall level of engraftment after 22 weeks was similar in recipients transplanted with aged HSCs and aged HSCs treated with fraction D (Fig 5E), aged fraction D‐treated HSCs presented with an increase in contribution to the T‐cell compartment, no change in the B‐cell compartment and a significantly reduced contribution to the myeloid compartment in PB compared to aged, untreated controls (Fig 5F). Animals transplanted with fraction D‐treated aged HSCs showed an almost twofold reduction of HSCs frequency, representing a youthful level (Fig 5G). Aged, fraction C‐treated HSCs did not show changes in contribution when compared to experiments in which aged, untreated HSCs were transplanted, demonstrating that fraction D acts exclusively on aged HSCs (Appendix Fig S3B–D). Closing the circle, polarity in donor‐derived HSCs from recipients transplanted with fraction D was increased to a youthful frequency when compared to the frequency of polar HSCs found in recipients transplanted with untreated or with fraction C‐treated aged HSCs (Fig 5H). Although the overall level of engraftment remained unchanged compared to non‐treated aged controls, treatment of aged HSCs ex vivo with thrombin‐activated OPN fragments resulted in HSCs youthful for polarity and frequency in vivo and also changed the frequency of myeloid and T cell to a youthful level. Thrombin‐treated OPN is known to be able to bind, among others α4β1, α9β1 and αVβ3 receptors on HSCs and by this means to regulate homing, lodging and engraftment (Nilsson et al, 2005; Grassinger et al, 2009). Finally, in order to determine the extent of the engagement of the above listed integrin receptors in the signaling cascade of thrombin‐activated OPN fragment D, old HSCs were treated ex vivo 16 h with OPN fraction D in the presence of previously established and validated peptide inhibitors (Grassinger et al, 2009) for these integrins (Materials and Methods). Old HSCs, when treated with an α9β1 peptide inhibitor as well as with when treated with all three peptide inhibitors together (against α4β1, α9β1 and αVβ3), resulted in a block of the re‐polarizing activity of fraction D on aged HSCs (Fig 5I) while the other integrin peptide inhibitors on their own did not affect polarity of old HSCs (Fig EV6D). Integrin α9β1 is thus a downstream effector of OPN fraction D activity in initiating a signaling cascade regulating Cdc42 activity and stem cell polarity and consequently stem cell aging and attenuation of aging.
Discussion
Aging of HSCs was thought to be primarily regulated by cell intrinsic‐driven mechanisms (Morrison et al, 1996; Rossi et al, 2005; Chambers & Goodell, 2007; Geiger et al, 2013). In this study, we demonstrate a critical role for decreased OPN in osteoblasts in aged endosteal‐enriched stroma cells for inferring aging‐associated phenotypes on HSCs, while exposing old LT‐HSCs to OPN fragments activated by thrombin results in the attenuation of aging‐associated phenotypes and function of aged HSCs. Mechanistically, OPN regulates in a novel, not yet described function, the activity of the small RhoGTPase Cdc42 in hematopoietic cells. We have previously shown that the level of the activity of the small RhoGTPase CdC42 is causally linked to aging and rejuvenation of HSCs (Florian et al, 2012). It was also previously reported that a decrease in OPN‐positive cells in the endosteal niche of diabetic mice correlates with decreased expression levels of N‐cadherin and β‐catenin on LT‐HSCs (Chiba et al, 2013). Upon aging, a switch in Wnt‐signaling in aged HSCs occurs (Roozen et al, 2012; Florian et al, 2013; Kim et al, 2014) which thus raises the possibility that the reduction in stromal OPN upon aging might likely contribute to or at least further enhance aging‐related Wnt pathway dysregulation. Analysis of the cytokine/chemokine composition of the BM extracellular fluid upon aging confirmed a previously published increase in the pro‐inflammatory protein RANTES in BM upon aging (Fig EV1E). A role for OPN in regulating expression and secretion of Rantes from mesenchymal stroma cells through interaction of OPN with surface integrin receptors has been previously described (Mi et al, 2011). IP‐10, also known as CXCL10, is a chemokine secreted by monocytes, endothelial cells and fibroblasts in response to IFN‐γ. Nothing has been reported so for with respect to a likely connection of these cytokines and OPN in BM and aging, though a recent study reported increased IP‐10 serum levels in elderly patients (de Bonfante et al, 2015). As implied by previous studies (Nilsson et al, 2005; Stier et al, 2005; Grassinger et al, 2009), our results further confirm that OPN cleaved by thrombin is biologically active. OPN is a secreted glycoprotein able to bind HSCs through, among others, interactions with CD44 and α9β1/α4β1 integrins (Stier et al, 2005; Grassinger et al, 2009). Thrombin‐mediated cleavage of OPN reveals a cryptic binding site in OPN for α4β1 and α9β1 integrins that are expressed on HSPCs (Smith et al, 1996; Grassinger et al, 2009). We demonstrate that OPN fragment D signals via α9β1 integrin to regulate Cdc42 activity to control HSCs polarity. This implies a novel role for α9β1 integrin not yet reported with respect to regulation of cell polarity.
Aged HSCs treated with the OPN fragment D show a more youthful level of myeloid cell production upon transplantation. Young OPN KO mice present with an aging‐like increase in CMPs compare to young wild‐type animals even though the frequency of mature myeloid cells is not yet compromised. But that seems to be only a matter of time, as increased myeloid production to a level even higher compared to old wild type happens in mid‐aged 18‐month‐old OPN KO mice. Also the heterochronic transplant experiments support a critical role for OPN in maintaining a youthful level of myeloid cells in the BM. OPN has also an important role in supporting lymphopoiesis; in fact, middle‐aged OPN KO mice show both impaired B‐ and T‐cell production and a trend toward a lower number of CLPs. Lack of OPN in the niche of young mice also significantly decreases B‐cell levels compared to for example levels in O→O controls. This strongly implies that a reduction in stroma‐derived OPN upon aging contributes to the aging‐associated lymphoid/myeloid differentiation skewing.
In summary, our data demonstrate a stem cell extrinsic contribution to HSC aging (Medyouf et al, 2014; Morrison & Scadden, 2014) and indicate a critical role for reduced stroma‐derived OPN in promoting aging‐associated phenotypes on HSCs. We further identified thrombin‐cleaved OPN as a novel treatment for ameliorating segments of hematopoietic stem cell aging.
Materials and Methods
Mice
C57BL/6J mice (8–10 weeks old) were purchased from Janvier (St. Berthevin Cedex, France). Aged C57BL/6J mice (19–24 months old) were obtained from the internal divisional stock (derived from mice obtained from Charles River Laboratories). OPN knockout mice backcrossed to the C57BL/6J background were previously published and obtained from Liaw L. laboratory (Liaw et al, 1998). All mice were housed in the animal barrier facility under pathogen‐free conditions at the University of Ulm. All mouse experiments were performed in compliance with the German Law for Welfare of Laboratory Animals and were approved by the Institutional Review Board “Regierungsprasidium Tubingen” of the University of Ulm.
Heterochronic transplantation of BM cells
4 × 10⁶ BM cells were isolated from either young (8–10 weeks old) or old (19–21 months old) Ly5.1+ donors and transplanted into lethally irradiated young, old and young OPN KO recipient (Ly5.2+) mice. Peripheral blood chimerism was determined by FACS analysis every 4 weeks up to 20 weeks after transplant. The transplantation experiment was performed six times with a cohort of five recipients mice per group each transplant (n = 25–30 mice per group).
Flow cytometry and cell sorting
Peripheral blood, spleen and bone marrow cell immunostaining was performed according to standard procedures, and samples were analyzed on a LSRII flow cytometer (BD Biosciences). Monoclonal antibodies to Ly5.2 (clone 104, eBioscience) and Ly5.1 (clone A20, eBioscience) were used to distinguish donor from recipient cells. For peripheral blood and bone marrow lineage analysis, the antibodies used were all from eBioscience: anti‐CD3e (clone 145‐2C11), anti‐B220 (clone RA3‐6B2), anti‐Mac‐1 (clone M1/70) and anti‐Gr‐1 (clone RC57BL/6‐8C5). Lineage FACS analysis data are plotted as the percentage of B220+, CD3+ and myeloid (Gr‐1+, Mac‐1+ and Gr‐1+Mac‐1+) cells among donor‐derived Ly5.1+ cells in case of a transplantation experiment or among total white blood cells. As for early hematopoiesis analysis, mononuclear cells were isolated by low‐density centrifugation (Histopaque 1083, Sigma) and stained with a cocktail of biotinylated lineage antibodies. Biotinylated antibodies used for lineage staining were all rat anti‐mouse antibodies: anti‐CD11b (clone M1/70), anti‐B220 (clone RA3‐6B2), anti‐CD5 (clone 53‐7.3), anti‐Gr‐1 (clone RB6‐8C5), anti‐Ter119 and anti‐CD8a (clone 53‐6.7). After lineage depletion by magnetic separation (Dynabeads, Invitrogen), cells were stained with anti‐Sca‐1 (clone D7) (eBioscience), anti‐c‐Kit (clone 2B8) (eBioscience), anti‐CD34 (clone RAM34) (eBioscience), anti‐CD127 (clone A7R34) (eBioscience), anti CD16/CD32 (clone 2.4G2) (BD Biosciences), anti‐Flk‐2 (clone A2F10) (eBioscience) and streptavidin (eBioscience). FACS analysis data were plotted as percentage of long‐term hematopoietic stem cells (LT‐HSCs, gated as LSK CD34−/lowFlk2−), short‐term hematopoietic stem cells (ST‐HSCs, gated as LSK CD34+Flk2−) and multipotent progenitors (MPPs, gated as LSK CD34+Flk2+) distributed among donor‐derived LSKs (Linnegc‐Kit+Sca‐1+ cells). To isolate LT‐HSCs, lineage depletion was performed to enrich for lineage‐negative cells. Lineage‐negative cells were then stained as mentioned above and sorted using a BD FACSAria III (BD Biosciences).
For intracellular flow cytometric staining of OPN, young and aged BM stroma cells were stained with anti‐mouse Ly5.2 (clone 104) and anti‐mouse Ter119 antibodies. Additionally, stroma cells were also stained for OBs (CD45− Ter119− CD31− Sca1− CD51+), MSCs (CD45− Ter119− CD31− Sca1+ CD51+), CAR+ cells (CD45− Ter119− CD31− CXCL12+) and CD31+ endothelial cells (CD45− Ter119− Sca1+ CD31+) (Winkler et al, 2010; Schepers et al, 2012; Guezguez et al, 2013). At the end of the surface staining, cells were fixed and permeabilized with Cytofix/Cytoperm solution (BD Biosciences) and incubated with 10% donkey serum (Sigma) in BD Perm/Wash Buffer (BD Biosciences) for 30 min. Primary antibody incubation was performed at room temperature in BD Perm/Wash Buffer (BD Biosciences) for 1 h. The primary antibody for OPN was obtained from R&D Systems (goat polyclonal PE conjugated). Specificity of the anti‐OPN antibody was tested on BM stroma‐enriched population from OPN KO mice (Fig EV2D).
Immunofluorescence staining
Freshly sorted LT‐HSCs were seeded on fibronectin‐coated glass coverslips. For polarity staining, LT‐HSCs were incubated for 12–16 h in HBSS 10% FBS at 37°C, 5% CO2, 3% O2, in growth factor‐free medium and then fixed with BD Cytofix fixation buffer (BD Biosciences). After fixation, cells were gently washed with PBS, permeabilized with 0.2% Triton X‐100 (Sigma) in PBS for 20 min and blocked with 10% donkey serum (Sigma) for 30 min. Primary and secondary antibody incubations were performed for 1 h at room temperature. Coverslips were mounted with ProLong Gold Antifade reagent with DAPI (Invitrogen, Molecular Probes). The cells were stained with an anti‐α‐tubulin antibody (Abcam, rat monoclonal ab6160) detected with an anti‐rat DyLight488‐conjugated antibody (Jackson ImmunoResearch); an anti‐AcH4K16 antibody (Upstate‐Millipore, rabbit polyclonal) detected with an anti‐rabbit DyLight549‐conjugated antibody (Jackson ImmunoResearch); samples were imaged with an AxioObserver Z1 microscope (Zeiss) equipped with a 63 × PH objective. Images were analyzed with AxioVision 4.6 software. As for polarity scoring, the localization of each single stained protein was considered polarized when a clear asymmetric distribution was visible by drawing a line across the middle of the cell. A total of 40–50 LT‐HSCs were singularly analyzed per sample. Data are plotted as percentage of the total number of cells scored per sample. Freshly sorted stroma cells OBs, MSCs, CAR+cells and C31+ endothelial cells were seeded on fibronectin‐coated glass coverslips and incubated/treated as described above. Primary antibody goat anti‐mouse OPN and Cy3 donkey anti‐goat secondary antibody were used. A total of 30 LT‐HSCs were singularly analyzed. The cells were examined under a Zeiss LSM 710 confocal microscope, and the volume measurement of OPN signal was analyzed with the image analysis software Volocity 3D (PerkinElmer).
Western blot and Cdc42‐GTPase effector domain pull‐down assays
Relative levels of GTP‐bound Cdc42 were determined by an effector pull‐down assay. Briefly, lineage‐depleted bone marrow cells (4 × 10⁶) were lysed in a Mg2+ lysis/wash buffer (Upstate cell signaling solutions) containing 10% glycerol, 25 mM sodium fluoride, 1 mM sodium orthovanadate and a protease inhibitor cocktail (Roche Diagnostics). Samples were incubated with PAK‐1 binding domain/agarose beads and bound (activated) as well as unbound (non‐activated) Cdc42 fractions were probed by immunoblotting with an anti‐Cdc42 antibody (Millipore, rabbit polyclonal). Activated protein was normalized to total protein and/or β‐actin (Sigma), and the relative amount was quantified by densitometry.
Endosteal‐enriched stroma population isolation
To isolate cells close to the endosteum, femora and tibiae were isolated from young (8–10 weeks old) and aged (22–24 months old) mice. The bones were cleaned and the associated muscle tissues removed. After the bone marrow was flushed out, the bones were incubated and shaken in 1.5 mg/ml collagenase IV (Worthington)/PBS for 1.5 h at 37°C. The bones were washed extensively with IMDM/10% FBS and the dissociated cells collected. This stroma cell fraction was filtered through a 70‐μm cell strainer and counted.
Co‐culture of endosteal‐enriched stroma population with BM cells depleted of differentiated cells
Freshly isolated stroma‐enriched cells were co‐culture with BM lineage‐negative depleted cell at the ratio 1:1 in growth factor‐free medium IMDM 10% FBS at 37°C, 5% CO2, 3% O2 for 72 h. After 24 h in culture, BrdU was added to the cells at a final concentration of 1 mM. At the endpoint, cells were harvested by intensive washing with HBSS and incubated with Cell dissociation buffer enzyme‐free based (Gibco, Life Technology) for 30–50 min at 37°C. After being counted, cells were stained with the HSC surface markers: anti‐Sca‐1 (clone D7) (eBioscience), anti‐c‐Kit (clone 2B8) (eBioscience), anti‐CD34 (clone RAM34) (eBioscience), anti‐CD127 (clone A7R34) (eBioscience), anti‐CD16/CD32 (clone 2.4G2) (BD Biosciences), anti‐Flk‐2 (clone A2F10) (eBioscience) and streptavidin (eBioscience). After washing, cells were stained with anti‐Annexin V antibody (BD Horizon) to identify apopotic cells rate. Finally after fixation and permeabilization, the cells were stained with antibody anti‐BrdU to verify the cell cycle status. The analysis was performed on a LSRII flow cytometer (BD Biosciences).
Quantitative real‐time PCR
RNA was isolated from bone‐derived stroma cells as well as from FACS‐sorted LT‐HSCs and lineage+ cells with the microRNA Extraction kit (Qiagen) and all was used for cDNA conversion. All real‐time PCRs were run with TaqMan real‐time PCR reagents and primers from Applied Biosystem on an ABI 9700HT real‐time machine. Normalization was made with GAPDH, and fold change was calculated by DDC t (Delta delta C t) method.
Cytometric beads array and ELISA assay
Total BM supernatant was flushed out from tibias and femurs of 2‐ and 24‐month‐old mice, and collected after centrifuging down the BM cells. Cytokine concentrations in the sample supernatants were determined by enzyme‐linked immunosorbent assay (ELISA) using MilliplexTM Multiplex kits (Millipore, Billerica, MA, USA) according to manufacturer's protocol. Briefly, in a 96‐well multiscreen filter plate, 25 μl sample in duplicate was incubated with 25 μl antibody‐coated beads overnight at 4°C on a plate shaker. Plates were then washed two times on a vacuum apparatus, and 25 μl of secondary antibody was added and incubated at room temperature for 1 h on while shaking. Finally, 25 μl of streptavidin‐RPE was added directly to the secondary antibody and incubated for 30 min at room temperature with shaking. Plates were then washed two more times, and 100 μl of sheath fluid was added. Plates were shaken for 5 min and then read using luminex technology on the Bio‐Plex™ (Bio‐Rad, Hercules, CA). Concentrations were calculated from standard curves using recombinant proteins and expressed in pg/ml. The cytokine analysis was conducted by the Research Flow Cytometry Core at Cincinnati Children's Hospital. ELISA was performed on BM supernatants and stroma cells culture supernatants for OPN (capture antibody: goat anti‐mouse OPN and detection antibody: biotinylated goat anti‐mouse OPN, R&D Systems) and SDF‐1 (capture antibody: mouse anti‐human/mouse SDF‐1 and detection antibody: biotinylated goat anti‐human/mouse SDF‐1, R&D Systems).
Colony‐forming unit assay fibroblasts and osteoblasts
1 × 10⁶ isolated bone‐derived stroma cells from young and aged mice were seeded in triplicates (0.3 × 10⁶ cells in each plate) with cytokine‐supplemented MethoCult™ M3134 medium (STEMCELL Technologies) for 10–12 days. Cells were than stained with Differential Wright Giemsa stain, and then, colonies were enumerated based on size and morphology (Gonzalez‐Nieto et al, 2012).
Purification of thrombin‐digested OPN
The thrombin‐digested OPN was separated by reverse‐phase chromatography (RPC) on a RPC 18 column (Macherey and Nagel, Nucleosil, 300‐5, 4.6 × 250 mm) using a linear gradient from 0 to 60% buffer B (A: water, 0.1% TFA; B: A + 80% acetonitrile, 0.1% TFA). Aliquots of 20% of the resulting fractions were lyophilized and tested. The resulting active fraction D corresponding to 0.3 mg digested OPN was incubated for 10 min at RT with 8 M urea and then re‐chromatographed under the same conditions. Aliquots of 20% were lyophilized and tested.
Ex vivo treatment with OPN fragments and integrin peptide inhibitors
HSCs were purified from young (8–10 weeks old) and old (20–24 months old) Ly5.2+ donors and either treated or untreated with 40 ng/ml thrombin‐digested OPN fragments for 16 h at 37°C. Treatment was also performed in the presence of integrin peptide inhibitors (1 μM dissolved in PBS) for 16 h at 37°C. These inhibitors specifically bind the α4β1, α9β1 and αVβ3 receptors on HSCs without activation (Grassinger et al, 2009). Peptide sequence for α4β1 inhibitor: ETVTASTQADTFT, α9β1 inhibitor: SLAYGLR, αVβ3 inhibitor: GRGDS. HSCs were transplanted into 8‐ to 10‐week‐old Ly5.1+ recipients with 3 × 10⁵ competitor BM cells. Peripheral blood chimerism was determined by FACS analysis every 8 weeks up to 20 weeks after transplant. The transplantation experiment was performed four times with a cohort of five recipients mice per group each transplant (n = 20 mice per group).
Statistical analyses
Data were assumed to meet normal distribution. The variance was similar between groups that were statistically compared. All data are plotted as mean + 1 standard error (s.e.m.). The s.e.m. is used to indicate the precision of an estimated mean. Such a data representation does not affect the statistical analyses as variance information is used in the test statistics. A paired Student's t‐test was used to determine the significance of the difference between means of two groups. One‐way ANOVA or two‐way ANOVA were used to compare means among three or more independent groups. Bonferroni post‐test to compare all pairs of data set was determined when overall P‐value was < 0.05. All statistical analyses were determined with Prism 6.0d version. In each figure legend, the number (n) of biological repeats (samples obtained from experiments repeated in different days and starting from different mice) included in the final statistical analysis is indicated. Mice for experiments were randomly chosen from our in‐house colonies or suppliers.
Author contributions
NG and HG designed and interpreted experiments and wrote the manuscript. NG performed and analyzed experiments. MS performed homing experiments. HG helped in performing transplantation experiments. KS, KE and GM assisted in transplantation experiments. LS performed HPLC/purification experiments. FK, TW, MCF, JMW and JAC assisted in designing and interpreting experiments.
Conflict of interest
The authors declare that they have no conflict of interest.
Supporting information
Appendix
Expanded View Figures PDF
Movie EV1
Movie EV2
Review Process File
Acknowledgements
We thank the Cores at Ulm University and CCHMC for cell sorting support and the Tierforschungszentrum of the University of Ulm for supporting our animal work. This work was supported by grants from the Deutsche Forschungsgemeinschaft (KFO 142 and SFB 1074) and the BMBF‐funded Program SyStaR to H.G. and from the National Institute of Health, HL076604, DK077762 and AG040118 to H.G. We thank Lucy Liaw for the kind gift of the OPN knockout mice. J.M.W. was supported by DFG WE 1919/5‐1.
The EMBO Journal (2017) 36: 840–853
See also: K Gustafsson & DT Scadden (April 2017)
References
- Acar M, Kocherlakota KS, Murphy MM, Peyer JG, Oguro H, Inra CN, Jaiyeola C, Zhao Z, Luby‐Phelps K, Morrison SJ (2015) Deep imaging of bone marrow shows non‐dividing stem cells are mainly perisinusoidal. Nature 526: 126–130 [DOI] [PMC free article] [PubMed] [Google Scholar]
- Beerman I, Bock C, Garrison BS, Smith ZD, Gu H, Meissner A, Rossi DJ (2013) Proliferation‐dependent alterations of the DNA methylation landscape underlie hematopoietic stem cell aging. Cell Stem Cell 12: 413–425 [DOI] [PubMed] [Google Scholar]
- de Bonfante HL, de Almeida CS, Abramo C, Grunewald STF, Levy RA, Teixeira HC (2015) CCL2, CXCL8, CXCL9 and CXCL10 serum levels increase with age but are not altered by treatment with hydroxychloroquine in patients with osteoarthritis of the knees. Int J Rheum Dis doi:10.1111/1756‐185X.12589 [DOI] [PubMed] [Google Scholar]
- Bruns I, Lucas D, Pinho S, Ahmed J, Lambert MP, Kunisaki Y, Scheiermann C, Schiff L, Poncz M, Bergman A, Frenette PS (2014) Megakaryocytes regulate hematopoietic stem cell quiescence through CXCL4 secretion. Nat Med 20: 1315–1320 [DOI] [PMC free article] [PubMed] [Google Scholar]
- Calvi LM, Adams GB, Weibrecht KW, Weber JM, Olson DP, Knight MC, Martin RP, Schipani E, Divieti P, Bringhurst FR, Milner LA, Kronenberg HM, Scadden DT (2003) Osteoblastic cells regulate the haematopoietic stem cell niche. Nature 425: 841–846 [DOI] [PubMed] [Google Scholar]
- Chambers SM, Goodell MA (2007) Hematopoietic stem cell aging: wrinkles in stem cell potential. Stem Cell Rev 3: 201–211 [DOI] [PubMed] [Google Scholar]
- Chambers SM, Shaw CA, Gatza C, Fisk CJ, Donehower LA, Goodell MA (2007) Aging hematopoietic stem cells decline in function and exhibit epigenetic dysregulation. PLoS Biol 5: e201 [DOI] [PMC free article] [PubMed] [Google Scholar]
- Chiba H, Ataka K, Iba K, Nagaishi K, Yamashita T, Fujimiya M (2013) Diabetes impairs the interactions between long‐term hematopoietic stem cells and osteopontin‐positive cells in the endosteal niche of mouse bone marrow. Am J Physiol Cell Physiol 305: C693–C703 [DOI] [PMC free article] [PubMed] [Google Scholar]
- Ergen AV, Boles NC, Goodell MA (2012) Rantes/Ccl5 influences hematopoietic stem cell subtypes and causes myeloid skewing. Blood 119: 2500–2509 [DOI] [PMC free article] [PubMed] [Google Scholar]
- Florian MC, Dörr K, Niebel A, Daria D, Schrezenmeier H, Rojewski M, Filippi MD, Hasenberg A, Gunzer M, Scharffetter‐Kochanek K, Zheng Y, Geiger H (2012) Cdc42 activity regulates hematopoietic stem cell aging and rejuvenation. Cell Stem Cell 10: 520–530 [DOI] [PMC free article] [PubMed] [Google Scholar]
- Florian MC, Geiger H (2010) Concise review: polarity in stem cells, disease, and aging. Stem Cells 28: 1623–1629 [DOI] [PMC free article] [PubMed] [Google Scholar]
- Florian MC, Nattamai KJ, Dörr K, Marka G, Uberle B, Vas V, Eckl C, Andrä I, Schiemann M, Oostendorp RA, Scharffetter‐Kochanek K, Kestler HA, Zheng Y, Geiger H (2013) A canonical to non‐canonical Wnt signalling switch in haematopoietic stem‐cell ageing. Nature 503: 392–396 [DOI] [PMC free article] [PubMed] [Google Scholar]
- Geiger H, de Haan G, Florian MC (2013) The ageing haematopoietic stem cell compartment. Nat Rev Immunol 13: 376–389 [DOI] [PubMed] [Google Scholar]
- Gonzalez‐Nieto D, Li L, Kohler A, Ghiaur G, Ishikawa E, Sengupta A, Madhu M, Arnett JL, Santho RA, Dunn SK, Fishman GI, Gutstein DE, Civitelli R, Barrio LC, Gunzer M, Cancelas JA (2012) Connexin‐43 in the osteogenic BM niche regulates its cellular composition and the bidirectional traffic of hematopoietic stem cells and progenitors. Blood 119: 5144–5154 [DOI] [PMC free article] [PubMed] [Google Scholar]
- Grassinger J, Haylock DN, Storan MJ, Haines GO, Williams B, Whitty GA, Vinson AR, Be CL, Li S, Sørensen ES, Tam PP, Denhardt DT, Sheppard D, Choong PF, Nilsson SK (2009) Thrombin‐cleaved osteopontin regulates hemopoietic stem and progenitor cell functions through interactions with alpha9beta1 and alpha4beta1 integrins. Blood 114: 49–59 [DOI] [PubMed] [Google Scholar]
- Grassinger J, Haylock DN, Williams B, Olsen GH, Nilsson SK (2010) Phenotypically identical hemopoietic stem cells isolated from different regions of bone marrow have different biologic potential. Blood 116: 3185–3196 [DOI] [PubMed] [Google Scholar]
- Guezguez B, Campbell CJV, Boyd AL, Karanu F, Casado FL, Di Cresce C, Collins TJ, Shapovalova Z, Xenocostas A, Bhatia M (2013) Regional localization within the bone marrow influences the functional capacity of human HSCs. Cell Stem Cell 13: 175–189 [DOI] [PubMed] [Google Scholar]
- Gur‐Cohen S, Itkin T, Chakrabarty S, Graf C, Kollet O, Ludin A, Golan K, Kalinkovich A, Ledergor G, Wong E, Niemeyer E, Porat Z, Erez A, Sagi I, Esmon CT, Ruf W, Lapidot T (2015) PAR1 signaling regulates the retention and recruitment of EPCR‐expressing bone marrow hematopoietic stem cells. Nat Med 21: 1307–1317 [DOI] [PMC free article] [PubMed] [Google Scholar]
- Haylock DN, Nilsson SK (2006) Osteopontin: a bridge between bone and blood. Br J Haematol 134: 467–474 [DOI] [PubMed] [Google Scholar]
- Khatri R, Krishnan S, Roy S, Chattopadhyay S, Kumar V, Mukhopadhyay A (2016) Reactive oxygen species limit the ability of bone marrow stromal cells to support hematopoietic reconstitution in aging mice. Stem Cells Dev 25: 948–958 [DOI] [PMC free article] [PubMed] [Google Scholar]
- Khong DM, Dudakov JA, Hammett MV, Jurblum MI, Khong SM, Goldberg GL, Ueno T, Spyroglou L, Young LF, van den Brink MR, Boyd RL, Chidgey AP (2015) Enhanced hematopoietic stem cell function mediates immune regeneration following sex steroid blockade. Stem Cell Reports 4: 445–458 [DOI] [PMC free article] [PubMed] [Google Scholar]
- Kim AD, Melick CH, Clements WK, Stachura DL, Distel M, Panáková D, MacRae C, Mork LA, Crump JG, Traver D (2014) Discrete Notch signaling requirements in the specification of hematopoietic stem cells. EMBO J 33: 2363–2373 [DOI] [PMC free article] [PubMed] [Google Scholar]
- Köhler A, Schmithorst V, Filippi M‐D, Ryan MA, Daria D, Gunzer M, Geiger H (2009) Altered cellular dynamics and endosteal location of aged early hematopoietic progenitor cells revealed by time‐lapse intravital imaging in long bones. Blood 114: 290–298 [DOI] [PMC free article] [PubMed] [Google Scholar]
- Li F, Jin F, Freitas A, Szabo P, Weksler ME (2001) Impaired regeneration of the peripheral B cell repertoire from bone marrow following lymphopenia in old mice. Eur J Immunol 31: 500–505 [DOI] [PubMed] [Google Scholar]
- Liang Y, Van Zant G, Szilvassy SJ (2005) Effects of aging on the homing and engraftment of murine hematopoietic stem and progenitor cells. Blood 106: 1479–1487 [DOI] [PMC free article] [PubMed] [Google Scholar]
- Liaw L, Birk DE, Ballas CB, Whitsitt JS, Davidson JM, Hogan BL (1998) Altered wound healing in mice lacking a functional osteopontin gene (spp1). J Clin Invest 101: 1468–1478 [DOI] [PMC free article] [PubMed] [Google Scholar]
- Medyouf H, Mossner M, Jann JC, Nolte F, Raffel S, Herrmann C, Lier A, Eisen C, Nowak V, Zens B, Müdder K, Klein C, Obländer J, Fey S, Vogler J, Fabarius A, Riedl E, Roehl H, Kohlmann A, Staller M et al (2014) Myelodysplastic cells in patients reprogram mesenchymal stromal cells to establish a transplantable stem cell niche disease unit. Cell Stem Cell 14: 824–837 [DOI] [PubMed] [Google Scholar]
- Mendelson A, Frenette PS (2014) Hematopoietic stem cell niche maintenance during homeostasis and regeneration. Nat Med 20: 833–846 [DOI] [PMC free article] [PubMed] [Google Scholar]
- Méndez‐Ferrer S, Michurina TV, Ferraro F, Mazloom AR, Macarthur BD, Lira SA, Scadden DT, Ma'ayan A, Enikolopov GN, Frenette PS (2010) Mesenchymal and haematopoietic stem cells form a unique bone marrow niche. Nature 466: 829–834 [DOI] [PMC free article] [PubMed] [Google Scholar]
- Mi Z, Bhattacharya SD, Kim VM, Guo H, Talbot LJ, Kuo PC (2011) Osteopontin promotes CCL5‐mesenchymal stromal cell‐mediated breast cancer metastasis. Carcinogenesis 32: 477–487 [DOI] [PMC free article] [PubMed] [Google Scholar]
- Morrison SJ, Scadden DT (2014) The bone marrow niche for haematopoietic stem cells. Nature 505: 327–334 [DOI] [PMC free article] [PubMed] [Google Scholar]
- Morrison SJ, Wandycz AM, Akashi K, Globerson A, Weissman IL (1996) The aging of hematopoietic stem cells. Nat Med 2: 1011–1016 [DOI] [PubMed] [Google Scholar]
- Naveiras O, Nardi V, Wenzel PL, Hauschka PV, Fahey F, Daley GQ (2009) Bone‐marrow adipocytes as negative regulators of the haematopoietic microenvironment. Nature 460: 259–263 [DOI] [PMC free article] [PubMed] [Google Scholar]
- Nilsson SK, Johnston HM, Whitty GA, Williams B, Webb RJ, Denhardt DT, Bertoncello I, Bendall LJ, Simmons PJ, Haylock DN (2005) Osteopontin, a key component of the hematopoietic stem cell niche and regulator of primitive hematopoietic progenitor cells. Blood 106: 1232–1239 [DOI] [PubMed] [Google Scholar]
- Nombela‐Arrieta C, Pivarnik G, Winkel B, Canty KJ, Harley B, Mahoney JE, Park S‐Y, Lu J, Protopopov A, Silberstein LE (2013) Quantitative imaging of haematopoietic stem and progenitor cell localization and hypoxic status in the bone marrow microenvironment. Nat Cell Biol 15: 533–543 [DOI] [PMC free article] [PubMed] [Google Scholar]
- Roozen PPC, Brugman MH, Staal FJT (2012) Differential requirements for Wnt and Notch signaling in hematopoietic versus thymic niches. Ann N Y Acad Sci 1266: 78–93 [DOI] [PubMed] [Google Scholar]
- Rossi DJ, Bryder D, Zahn JM, Ahlenius H, Sonu R, Wagers AJ, Weissman IL (2005) Cell intrinsic alterations underlie hematopoietic stem cell aging. Proc Natl Acad Sci USA 102: 9194–9199 [DOI] [PMC free article] [PubMed] [Google Scholar]
- Schepers K, Hsiao EC, Garg T, Scott MJ, Passegué E (2012) Activated Gs signaling in osteoblastic cells alters the hematopoietic stem cell niche in mice. Blood 120: 3425–3435 [DOI] [PMC free article] [PubMed] [Google Scholar]
- Smith LL, Cheung HK, Ling LE, Chen J, Sheppard D, Pytela R, Giachelli CM (1996) Osteopontin N‐terminal domain contains a cryptic adhesive sequence recognized by alpha9beta1 integrin. J Biol Chem 271: 28485–28491 [PubMed] [Google Scholar]
- Stier S, Ko Y, Forkert R, Lutz C, Neuhaus T, Grünewald E, Cheng T, Dombkowski D, Calvi LM, Rittling SR, Scadden DT (2005) Osteopontin is a hematopoietic stem cell niche component that negatively regulates stem cell pool size. J Exp Med 201: 1781–1791 [DOI] [PMC free article] [PubMed] [Google Scholar]
- Visnjic D, Kalajzic Z, Rowe DW, Katavic V, Lorenzo J, Aguila HL (2004) Hematopoiesis is severely altered in mice with an induced osteoblast deficiency. Blood 103: 3258–3264 [DOI] [PubMed] [Google Scholar]
- Winkler IG, Barbier V, Wadley R, Zannettino ACW, Williams S, Lévesque J‐P (2010) Positioning of bone marrow hematopoietic and stromal cells relative to blood flow in vivo: serially reconstituting hematopoietic stem cells reside in distinct nonperfused niches. Blood 116: 375–385 [DOI] [PubMed] [Google Scholar]
- Xie Y, Yin T, Wiegraebe W, He XC, Miller D, Stark D, Perko K, Alexander R, Schwartz J, Grindley JC, Park J, Haug JS, Wunderlich JP, Li H, Zhang S, Johnson T, Feldman RA, Li L (2009) Detection of functional haematopoietic stem cell niche using real‐time imaging. Nature 457: 97–101 [DOI] [PubMed] [Google Scholar]
- Zhang J, Niu C, Ye L, Huang H, He X, Tong WG, Ross J, Haug J, Johnson T, Feng JQ, Harris S, Wiedemann LM, Mishina Y, Li L (2003) Identification of the haematopoietic stem cell niche and control of the niche size. Nature 425: 836–841 [DOI] [PubMed] [Google Scholar]
- Zhu X, Gui J, Dohkan J, Cheng L, Barnes PF, Su D‐M (2007) Lymphohematopoietic progenitors do not have a synchronized defect with age‐related thymic involution. Aging Cell 6: 663–672 [DOI] [PubMed] [Google Scholar]
Associated Data
This section collects any data citations, data availability statements, or supplementary materials included in this article.
Supplementary Materials
Appendix
Expanded View Figures PDF
Movie EV1
Movie EV2
Review Process File